. 2023 Dec 14;42(1):338.
doi: 10.1186/s13046-023-02922-8.

Nutlin-3a induces KRAS mutant/p53 wild type lung cancer specific methuosis-like cell death that is dependent on GFPT2

Affiliations

Nutlin-3a induces KRAS mutant/p53 wild type lung cancer specific methuosis-like cell death that is dependent on GFPT2

Dasom Kim et al. J Exp Clin Cancer Res. .

Abstract

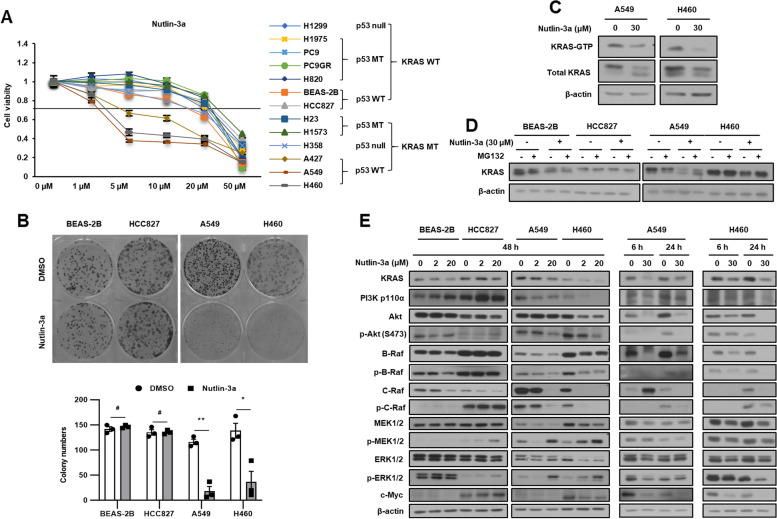
Background: Oncogenic KRAS mutation, the most frequent mutation in non-small cell lung cancer (NSCLC), is an aggressiveness risk factor and leads to the metabolic reprogramming of cancer cells by promoting glucose, glutamine, and fatty acid absorption and glycolysis. Lately, sotorasib was approved by the FDA as a first-in-class KRAS-G12C inhibitor. However, sotorasib still has a derivative barrier, which is not effective for other KRAS mutation types, except for G12C. Additionally, resistance to sotorasib is likely to develop, demanding the need for alternative therapeutic strategies.

Methods: KRAS mutant, and wildtype NSCLC cells were used in vitro cell analyses. Cell viability, proliferation, and death were measured by MTT, cell counting, colony analyses, and annexin V staining for FACS. Cell tracker dyes were used to investigate cell morphology, which was examined by holotomograpy, and confocal microscopes. RNA sequencing was performed to identify key target molecule or pathway, which was confirmed by qRT-PCR, western blotting, and metabolite analyses by UHPLC-MS/MS. Zebrafish and mouse xenograft model were used for in vivo analysis.

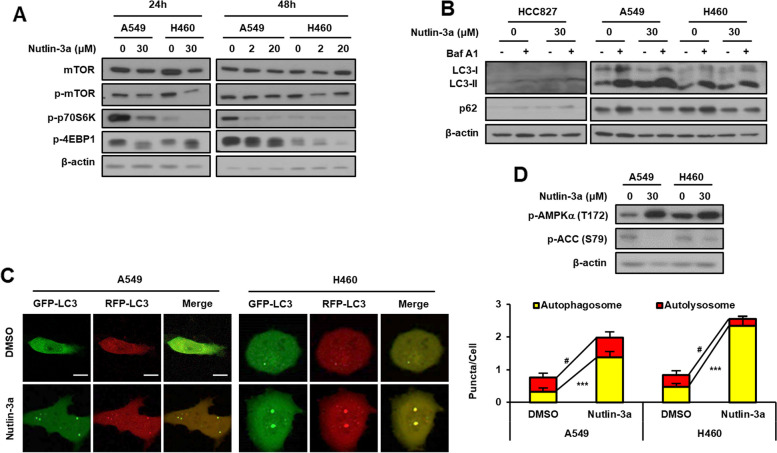
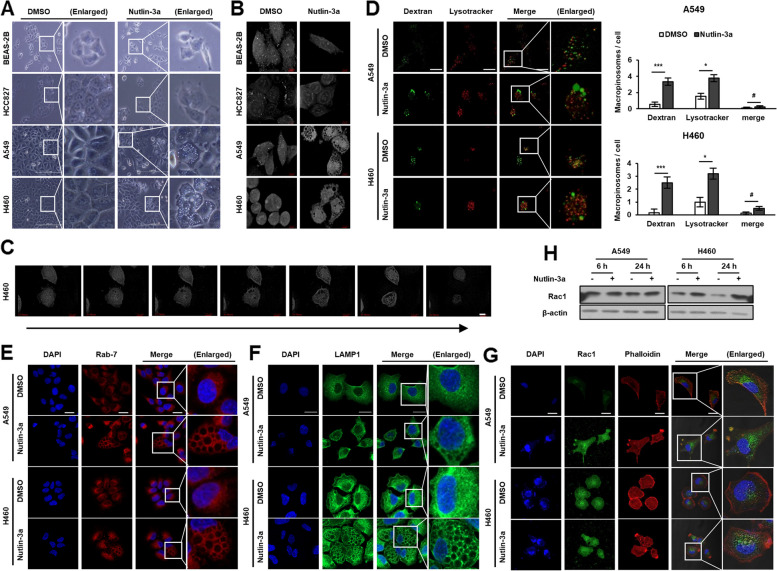
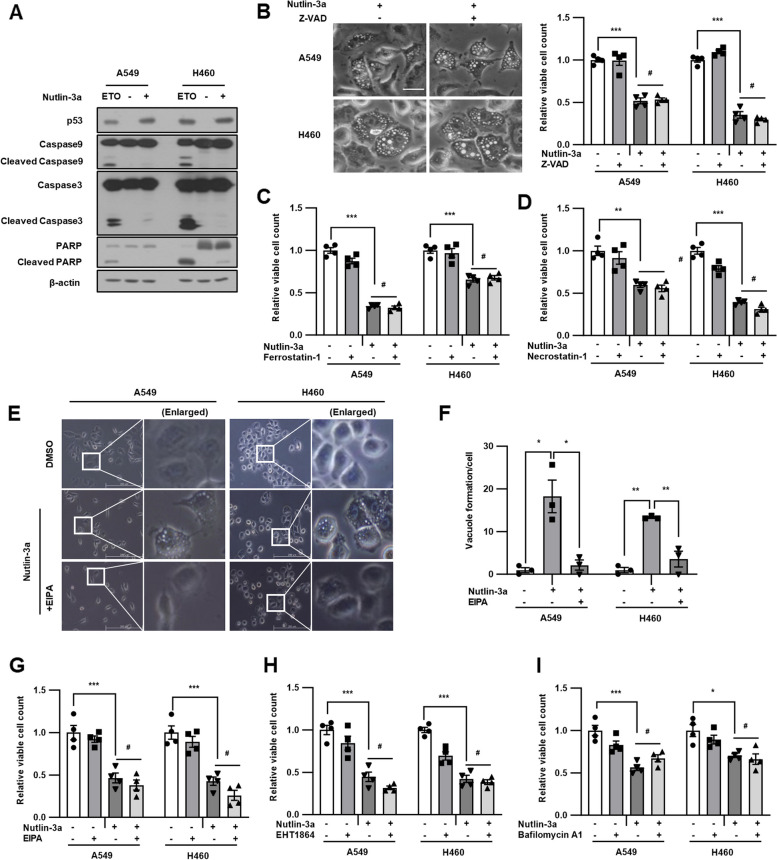
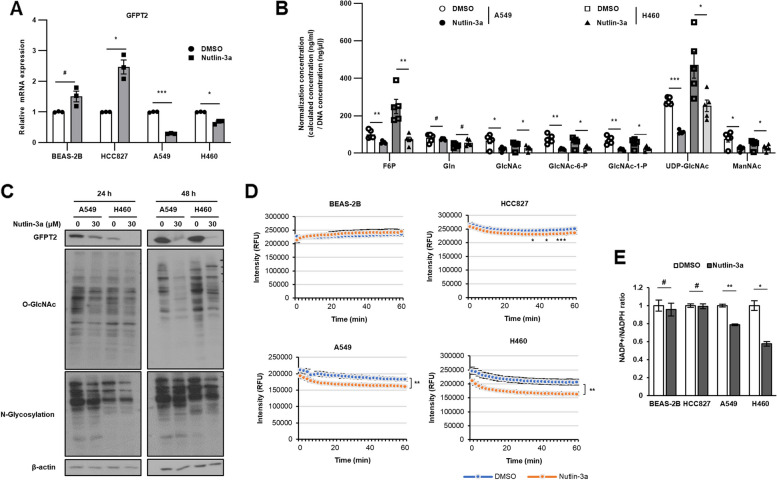
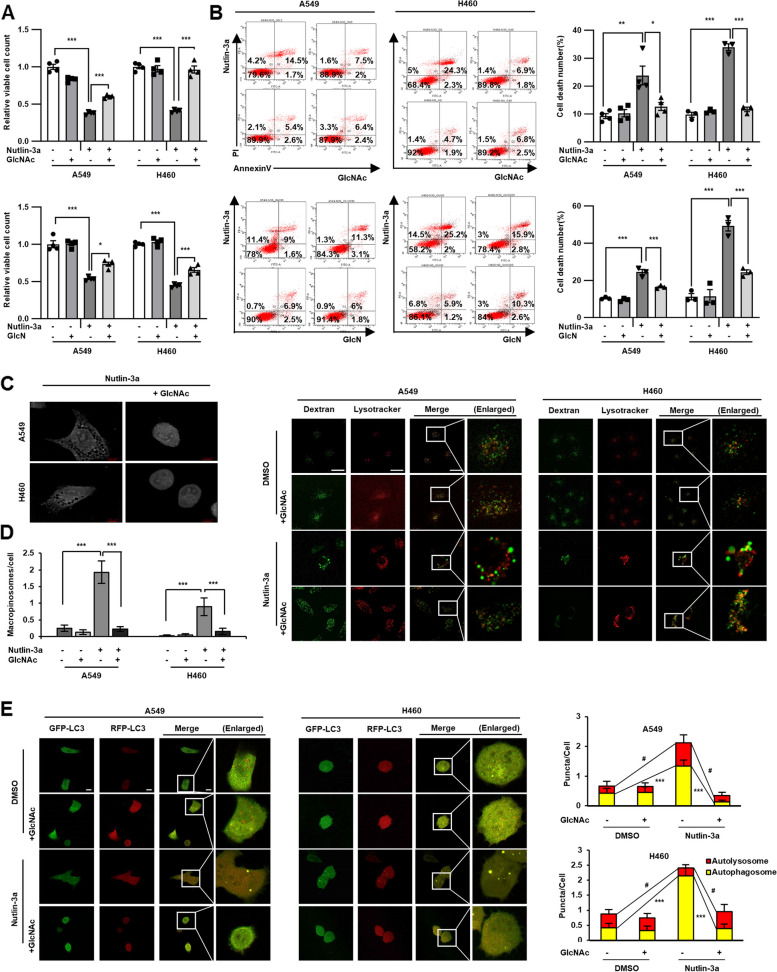
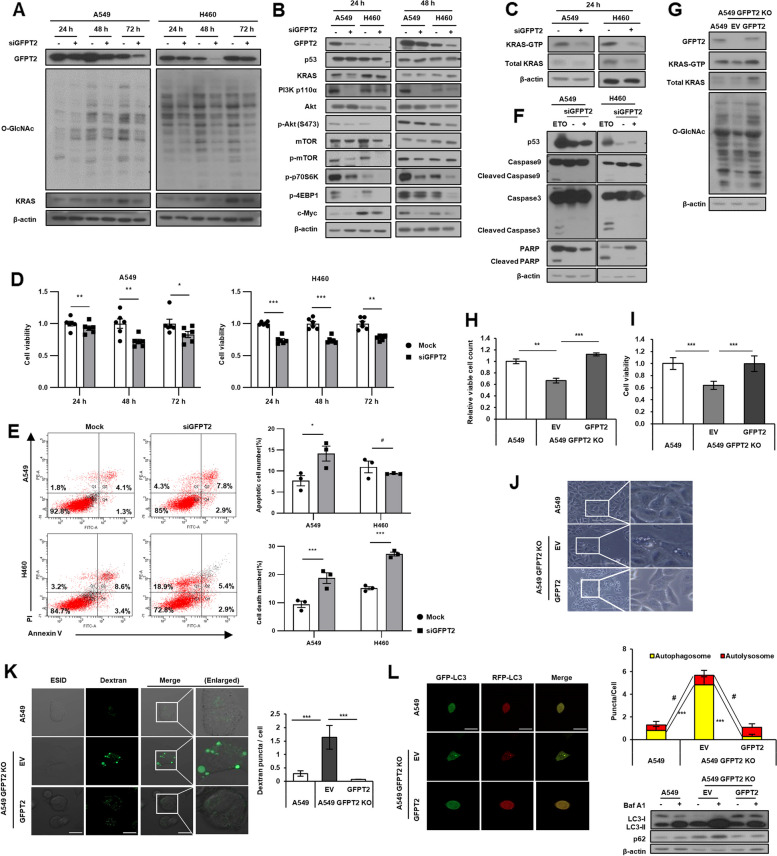
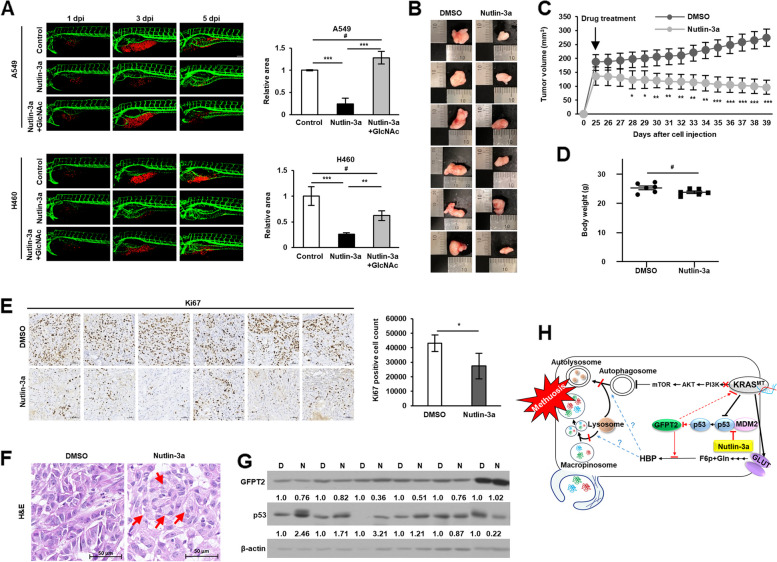
Results: In this study, we found that nutlin-3a, an MDM2 antagonist, inhibited the KRAS-PI3K/Akt-mTOR pathway and disrupted the fusion of both autophagosomes and macropinosomes with lysosomes. This further elucidated non-apoptotic and catastrophic macropinocytosis associated methuosis-like cell death, which was found to be dependent on GFPT2 of the hexosamine biosynthetic pathway, specifically in KRAS mutant /p53 wild type NSCLC cells.

Conclusion: These results indicate the potential of nutlin-3a as an alternative agent for treating KRAS mutant/p53 wild type NSCLC cells.

Keywords: GFPT2; HBP; KRAS mutation; Macropinocytosis; Methuosis; Nutlin-3a.


Conflict of interest statement

No.

Figures

Fig. 1
Fig. 1
Nutlin-3a reduces KRAS mutant NSCLC cell viability via the KRAS-PI3K/Akt pathways. A Cell viability was determined using MTT assay after nutlin-3a treatment for 48 h. B Cell proliferation examined using the colony formation assay after nutlin-3a treatment (2 μM) for 14 days (top); quantification of colony formation (bottom). C KRAS-GTP form detected by the KRAS activation assay after nutlin-3a treatment for 24 h. D KRAS protein stability was detected by western blotting after treatment of MG132 (10 μM) for 6 h before harvest. E KRAS downstream molecules were detected by western blotting. *p < 0.05, **p < 0.01, ***p < 0.001 compared with control
Fig. 2
Fig. 2
Nutlin-3a disrupts the fusion of autophagosomes and lysosomes in KRAS MT/p53 WT NSCLC cells. A Downregulation of the mTOR pathway detected by western blotting after nutlin-3a treatment. B Western blotting for the expression of autophagy markers performed after co-treatment of cells with bafilomycin A1 (100 nM) for 1 h in the presence or absence of nutlin-3a for 24 h. C Autophagy flux after cell treatment with nutlin-3a (30 μM) for 24 h after transfection of the mRFP-GFP-LC3 plasmid. Live cell imaging was obtained using a confocal laser scanning microscope (left), and number of puncta per cell were quantified from representative images (right) (n ≥ 21). D Western blotting for the expression of surrogate markers of the autophagic process, p-AMPKα, and p-ACC, performed after nutlin-3a (30 μM) for 24 h. Scale bar: 10 μm
Fig. 3
Fig. 3
Nutlin-3a induces huge cytoplasmic vacuoles in KRAS MT/p53 WT NSCLC cells. Cells were treated with nutlin-3a (30 μM) for 6 (D, H) or 24 h (A, B, EH). A, B Representative live cell images captured by light (A) and holotomography microscope (B) show huge cytoplasmic vacuoles in KRAS MT/p53 WT but not KRAS WT cells. C Time-lapse video capture images (24 h) of H460 obtained by holotomography microscopy show increase in macropinosomes volume with time and membrane rupturing in the end. D Nutlin-3a induced formation of huge vacuoles were incorporated with dextran (green), but not merged with LysoTracker (red). Representative live images were obtained by confocal laser scanning microscopy (left). Number of macropinosomes were quantitated from the captured image (right) (n ≥ 8). EG Representative images obtained by confocal laser scanning microscopy. Fixed cells were stained with Rab7 (E), LAMP1 (F), or Rac1 (green), and rhodamine–phalloidin (red) (G) and were counterstained with DAPI (blue). H Western blotting of Rac1 expression. *p < 0.05, **p < 0.01, ***p < 0.001 compared with control. Scale bar: 200 μm (A), 7 μm (B, C), and 20 μm (D-G)
Fig. 4
Fig. 4
Nutlin-3a induces methuosis-like death of KRAS MT/p53 WT NSCLC cells. Cells were treated with nutlin-3a (30 μM) with or without indicated inhibitors for 24 h. A Cleavage forms of caspase-9, caspase-3, and PARP did not detected by western blotting. Etoposide (ETO) treatment (100 μM) for 24 h was used as a positive control for inducing caspase cleavage. B-I Representative light microscope images are shown. Cell proliferation was determined via cell counting assay. Cells were co-treated with Z-VAD (OMe)-FMK (50 μM) (B), ferrostatin-1 (1 μM) (C), necrostatin-1 (10 μM) (D), or EHT1864 (10 μM) (H) or pretreated with EIPA (5 μM) for 1 h (EG) or bafilomycin A1 (5 nM) for 2 h (I) before nutlin-3a treatment. Scale bar: 100 μm for b, and 200 μm for e. *p < 0.05, **p < 0.01, ***p < 0.001 compared with control
Fig. 5
Fig. 5
Downregulation of GFPT2 expression by nutlin-3a alters amounts of HBP metabolites in KRAS MT/p53 WT NSCLC cells. A, B Cells were treated with nutlin-3a (30 μM) for 24 h. Expression of GFPT2 mRNA was determined by RT-qPCR (A). Abundance of HBP metabolites analyzed by UHPLC–MS/MS (B). C Global O-GlcNAcylation of proteins and N-glycosylation with the terminal glycosyl/mannosyl binding lectin examined via western blotting. D Glycolysis was measured for 1 h by fluorescence emission. E The level of NADP + / NADPH ratio was measured as PPP flux. *p < 0.05, **p < 0.01, ***p < 0.001 compared with control
Fig. 6
Fig. 6
Nutlin-3a-induced methuosis-like cell death is associated with the HBP in KRAS MT/p53 WT NSCLC cells. Cells were supplemented with GlcNAc (40 mM) or GlcN (200 μM) for 24 h with or without nutlin-3a (30 μM). A, B Both GlcNac and GlcN rescue cell proliferation and death, which was analyzed by cell counting (A), and flow cytometry using annexin V/PI staining (B). Representative flow cytometry graph, and statistical histogram of four independent experiment are shown. C Live cell images captured by holotomography microscopy show that GlcNAc supplementation rescues the formation of huge cytoplasmic vacuoles induced by nutlin-3a. D Cells were incubated with dextran and LysoTracker for 2 h with GlcNAc or nutlin-3a. GlcNAc supplementation with nutlin-3a recovers dextran uptakes compared to only nutlin-3a treated cells (n ≥ 22). E Autophagy flux disruption recovered by supplementation of GlcNAc with nutlin-3a, which was detected after transfection of mRFP-GFP-LC3 tandem vector (n ≥ 20). Representative images were obtained by confocal laser scanning microscopy and quantitated from the captured image (D, E). Scale bar: 7 μm for (C), and 10 μm for (D-E). *p < 0.05, **p < 0.01, ***p < 0.001 compared with control
Fig. 7
Fig. 7
GFPT2 is a target of nutlin-3a-induced cell death. GFPT2 was inhibited by exogenously introduced siGFPT2 for indicated times in KRAS MT/p53 WT NSCLC cells (A-F). A, B Expression of GFPT2, O-GlcNAc (A), and the KRAS-PI3K/Akt-mTOR pathway (B) were detected by western blotting. C KRAS-GTP form was detected through the KRAS activation assay. D Cell viability was measured by MTT assay. E Apoptotic cell death number (top), and total cell death number (bottom) were analyzed via flow cytometry using annexin V/PI staining. F Expression of caspase-9, caspase-3, and PARP detected by western blotting. Etoposide (ETO) treatment (100 μM) for 24 h was used as a positive control for inducing caspase cleavage. GFPT2 was re-expressed by transfection of GFPT2-HA for 24 h into GFPT2 knockout A549 cells (G-L). G KRAS-GTP form and O-GlcNAc were verified by KRAS activation assay and western blotting. H, I Cell viability was detected by cell counting (H), and MTT assays (I). J, K Cytoplasmic vacuoles were examined under the light microscope (J), and confocal microscope after incorporation of dextran (green) (K). L Autophagic flux was detected after transfection of the mRFP-GFP-LC3 tandem vector (n ≥ 10). *p < 0.05, **p < 0.01, ***p < 0.001 compared with control
Fig. 8
Fig. 8
Anticancer effects of nutlin-3a confirmed in vivo. A Representative confocal images of CM-Dil-labeled cancer cells (red) and vasculature (green) in zebrafish larvae (left). Quantified data show cancer cell volume after nutlin-3a treatment and GlcNAc co-treatment compared with that of the control group (right). Supplement of GlcNAc-rescued cancer cell volume reduces after nutlin-3a treatment. B, C Images (B) and comparison (C) of growth rates of subcutaneous tumors formed by A549 injection; tumor growth is observed in the presence or absence of nutlin-3a. D Weight of mice after treatment with either vehicle control or nutlin-3a on the day of euthanasia. E Immunohistochemical analysis of Ki67 expression in tumor tissues. F Vacuole examination in H&E stained tumor tissues. Red arrows indicate vacuoles. G Western blot analysis of GFPT2 and p53 expression in in vivo xenograft tumors. The densitometry quantification of the western blot was determined using Image J software (Ver. 1/52n, NIH). H Proposed mechanism of nutlin-3a-induced methuosis-like cell death. Scale bar: 20 μm for (A) and 50 μm for (E, F). Data are presented as mean ± standard deviation; n = 6. *p < 0.05, **p < 0.01, ***p < 0.001 compared with control

References

    1. Chevallier M, Borgeaud M, Addeo A, Friedlaender A. Oncogenic driver mutations in non-small cell lung cancer: Past, present and future. World J Clin Oncol. 2021;12(4):217–237. doi: 10.5306/wjco.v12.i4.217. - DOI - PMC - PubMed
    1. Yang S, Xia J, Yang Z, Xu M, Li S. Lung cancer molecular mutations and abnormal glycosylation as biomarkers for early diagnosis. Cancer Treat Res Commun. 2021;27:100311. doi: 10.1016/j.ctarc.2021.100311. - DOI - PubMed
    1. Comprehensive molecular profiling of lung adenocarcinoma Nature. 2014;511(7511):543–550. doi: 10.1038/nature13385. - DOI - PMC - PubMed
    1. FDA Approves First KRAS Inhibitor: Sotorasib. Cancer Discov. 2021;11(8):Of4. 10.1158/2159-8290.CD-NB2021-0362. - PubMed
    1. Skoulidis F, Li BT, Dy GK, Price TJ, Falchook GS, Wolf J, et al. Sotorasib for Lung Cancers with KRAS p.G12C Mutation. N Engl J Med. 2021;384(25):2371–2381. doi: 10.1056/NEJMoa2103695. - DOI - PMC - PubMed

MeSH terms

Substances