. 2020 May 1:409:213211.
doi: 10.1016/j.ccr.2020.213211. Epub 2020 Feb 6.

Dithione, the antipodal redox partner of ene-1,2-dithiol ligands and their metal complexes

Affiliations

Dithione, the antipodal redox partner of ene-1,2-dithiol ligands and their metal complexes

Partha Basu et al. Coord Chem Rev. .

Abstract

Defining the oxidation state of the central atom in a coordination compound is fundamental in understanding the electronic structure and provides a starting point for elucidating molecular properties. The presence of non-innocent ligand(s) can obscure the oxidation state of the central atom as the ligand contribution to the electronic structure is difficult to ascertain. Redox-active ligands, such as dithiolene ligands, are well known non-innocent ligands that can exist in both a fully reduced (Dt2-) and fully oxidized (Dt0) states. Complexes containing the fully oxidized dithione state of the ligand are uncommon and only a few have been completely characterized. Dithione ligands are of interest due to their electron-deficient nature and ability to act as an electron acceptor for more electron-rich moieties, such as other dithiolene ligands or metal centers. This article focuses the syntheses, structures, and metal coordination, particularly coordination compounds, of dithione ligands. Various examples of mono, bis, and tris dithione complexes are discussed.

Keywords: Coordination compound; Diels-Alder reaction; Dithiolene; Dithione; Donor-acceptor system; Electron-deficient ligand.


Conflict of interest statement

Declaration of Competing Interest The authors declare that they have no known competing financial interests or personal relationships that could have appeared to influence the work reported in this paper.

Figures

Fig. 1.
Fig. 1.
Representation of dithiolene ligands showing different oxidation states.
Fig. 2.
Fig. 2.
Synthesis of pyrazine based dithione ligands.
Fig. 3.
Fig. 3.
Photosynthesis of α-dithiones.
Fig. 4.
Fig. 4.
Absorption spectra of equimolar solutions of 3 and 2 in solvent mixtures of CH2C12-C6H14 at room temperature. Volume % C6H14 in CH2Cl2: A, 0; B, 52; C, 72; D, 84; E, 92. Reprinted with permission from ref. [45]. Copyright 1973. American Chemical Society.
Fig. 5.
Fig. 5.
13C NMR resonance of C=S in select dithione [55] and thioketone molecules [56].
Fig. 6.
Fig. 6.
Thioamide enolate resonances of dithiooxamide.
Fig. 7.
Fig. 7.
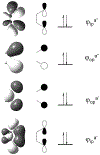
The four highest occupied MOs of the ethene-1,2-dithiolate (edt2−) ligand as obtained from computational studies utilizing B3LYP/6–311 + G** level of theory.
Fig. 8.
Fig. 8.
Frontier orbitals of iPr2Dt0 obtained from DFT calculatoins at B3LYP/6-311G+(d,p) level of theory.
Fig. 9.
Fig. 9.
Orbital energy diagram of the π electrons of iPr2Dt0 and its semi-1,2-dithione and ene-1,2-dithiolate(2−) forms calculated as described in Fig. 8. Energies are relative and select bond lengths (Å) are shown in the bottom right. Select atoms used to determine dihedral angles are labeled in the upper left.
Fig. 10.
Fig. 10.
Comparison of the redox active orbitals for iPr2Dt0 and its semi-1,2-dithione and ene-1,2-dithiolate(2−) forms (isovalue = 0.02). The spin-density plot for iPr2Dt1− as determined by Mulliken population analysis (isovalue = 0.0035).
Fig. 11.
Fig. 11.
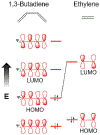
Frontier (π-orbitals) of 1,3-butadiene (left) and dienophile (right). Adapted from ref. [68]. Copyright 1973. Academic Press.
Fig. 12.
Fig. 12.
MO diagram of the [MII(Dt2−)(Dt1−)]1−(M = Ni, Pd and [AuIII(Dt2−)(Dt1−)] complexes having a spin doublet ground state. Reprinted with permission from ref. [78]. Copyright 2007. Wiley-VCH.
Fig. 13.
Fig. 13.
Two geometric isomers of an acyclic dithione ligand.
Fig. 14.
Fig. 14.
Coordination modes of a dithiooxamide ligand.
Fig. 15.
Fig. 15.
Electronic absorption spectra at 293 K in chloroform of ReBr(CO)3(Cycdto) (−), ReBr(CO)3(Bz1 2dto) (– – –), and ReBr(CO)3(Et4dto) (…). Reprinted with permission from ref. [42]. Copyright 1989. American Chemical Society.
Fig. 16.
Fig. 16.
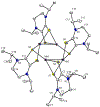
ORTEP of Mo(CO)4(Me2Dt0) (30%) with hydrogens omitted for clarity. Reprinted with permission from ref. [122]. Copyright 2006. American Chemical Society.
Fig. 17.
Fig. 17.
Selected MOs and energy diagram of Mo(CO)4(Me2Dt0). Reprinted with permission from ref. [122]. Copyright 2006. American Chemical Society.
Fig. 18.
Fig. 18.
Reactivity of dithione-halogen complexes with metals.
Fig. 19.
Fig. 19.
(Left) Thermal ellipsoid (40%) plot of MoO(SPh)2 (iPr2Dt0). Hydrogen atoms are omitted for clarity. The absorbance spectrum recorded in CH3CN is shown on the right. Reprinted with permission from ref. [132]. Copyright 2016. American Chemical Society.
Fig. 20.
Fig. 20.
Left, the dithiolene fold angle, showing the stabilizing interaction of symmetric metal in-plane d-orbitals and sulfur p-orbital. Right, a histogram of the oxomolybdenum dithiolene fold angles determined by X-ray crystallography. The most common dithiolene fold angle is 12.5°, and the largest is ~37°. Note that the 70° dithione fold angle in MoO(SPh)2(iPr2Dt0) represents an extreme deviation from the observed fold angles for reduced dithiolene ligands. Reprinted with permission ref. [122]. Copyright 2016. American Chemical Society.
Fig. 21.
Fig. 21.
Molecular structures of Zn(Cl)2(iPr2Dt0) (7), Zn(Cl)2(Me2Dt0) (8), Zn(mnt) (iPr2Dt0) (9), Zn(mnt)(Me2Dt0) (10) shown with 30% probability thermal ellipsoids. Hydrogens are removed for clarity. Reprinted with permission from ref. [141]. Copyright 2016. Elsevier.
Fig. 22.
Fig. 22.
Electronic absorption spectra of Zn(II) dithione complexes in acetonitrile 7 (orange) 8 (brown) 9 (green) 10 (yellow). Low energy ligand-to-ligand charge transfer bands are shown in the inset. Reprinted with permission from ref. [141]. Copyright 2016. Elsevier.
Fig. 23.
Fig. 23.
Frontier orbital diagram of Zn(mnt)(iPr2Dt0) displayed with calculated energies. Reprinted with permission from ref. [141]. Copyright 2016. Elsevier.
Fig. 24.
Fig. 24.
The electronic spectra of [M(Me2Dt0)2][BF4]2 in MeCN solution. Reprinted with permission from ref. [10]. Copyright 2002. American Chemical Society.
Fig. 25.
Fig. 25.
Cyclic voltammogram of [Ni(iPr2Dt0)2][BF4]2. Scan rate, 100 mVs–1; temperature, 25 °C; in acetonitrile, carbon disk working electrode. Ag+/Ag reference electrode, and a Pt-wire auxiliary electrode, supporting electrolyte, Et4NBF4. Potentials referenced internally with respect to Fc+/Fc couple. Reprinted with permission form ref. [152]. Copyright 2015. American Chemical Society.
Fig. 26.
Fig. 26.
Molecular structure of [Ni(iPr2Dt0)2][BF4]2 shown with 30% thermal ellipsoids, and hydrogen atoms and the anions are omitted for clarity. Reprinted with permission form ref. [152]. Copyright 2015. American Chemical Society.
Fig. 27.
Fig. 27.
UV–visible spectra of [Ni(iPr2Dt0)2][BF4]2 produced using spectroelectrochemistry (reduced in CD3CN). Reprinted with permission form ref. [152]. Copyright 2015. American Chemical Society.
Fig. 28.
Fig. 28.
Diabatic (Ga and Gb) and adiabatic (G1 and G2) potential energy surfaces are calculated to determine their coupling (Hab) for an intervalence electron transfer of [Ni(iPr2Dt0)2][BF4]2. Reprinted with permission form ref. [152]. Copyright 2015. American Chemical Society.
Fig. 29.
Fig. 29.
Predicted frontier molecular orbitals of [Ni(iPr2Dt0)2]2+. Reprinted with permission form ref. [152]. Copyright 2015. American Chemical Society.
Fig. 30.
Fig. 30.
The contributing resonance structures for the R2Dt0 N2C2C2 π-delocalization: dithione(right), dizwitterionic dithiol (left).
Fig. 31.
Fig. 31.
Gaussian resolved electronic absorption spectrum of [MoOCl(iPr2Dt0)2[PF6] in MeCN. Inset: Electron density difference map (EDDM) that shows in detail the nature of the low-energy MLCT transition (band 1) in 1 (red: electron-density loss in transition; green: electron-density gain in transition). Reprinted with permission from ref. [131]. Copyright 2011. Wiley-VCH.
Fig. 32.
Fig. 32.
Thermal ellipsoid (30%) plot of [(iPr2Dt0Mo]4BF4], counter anions are omitted for clarity. Adapted from ref. [130]. Copyright 2009. Royal Society of Chemistry.
Fig. 33.
Fig. 33.
Bond lengths of dianionic, anionic radical, and neutral catechol and dithiolene ligands. Adapted from ref. [68]. Copyright 1994. Elsevier.
Fig. 34.
Fig. 34.
Possible resonance hybrid of the [M(S2C2R2)2]0,1−,2− series of complexes. Reprinted with permission form ref. [149]. Copyright 2015. American Chemical Society.
Chart 1.
Chart 1.
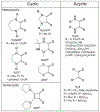
Categorization of Dithione ligands.
Scheme 1.
Scheme 1.
Synthesis of the first anionic radical dithiolene (5) and its redox chemistry.
Scheme 2.
Scheme 2.
Synthesis of radical boron dithiolene compounds.
Scheme 3.
Scheme 3.
Electron transfer series in nickel dithione complex.

References

    1. Kaim W, Schwederski B, Coord. Chem. Rev 254 (2010) 1580–1588.
    1. Kaim W, Eur. J. Inorg. Chem 2012 (2012) 343–348.
    1. Kaim W, Inorg. Chem 50 (2011) 9752–9765. - PubMed
    1. Joergensen CK, Coord. Chem. Rev 1 (1966) 164–178.
    1. Chirik PJ, Inorg. Chem 50 (2011) 9737–9740. - PubMed

LinkOut - more resources