

Conceptualised psycho-medical footprint for health status outcomes and the potential impacts for early detection and prevention of chronic diseases in the context of 3P medicine
- PMID: 38094584
- PMCID: PMC10713508
- DOI: 10.1007/s13167-023-00344-2
Conceptualised psycho-medical footprint for health status outcomes and the potential impacts for early detection and prevention of chronic diseases in the context of 3P medicine
Abstract
Background: The Suboptimal Health Status Questionnaire-25 (SHSQ-25) is a distinctive medical psychometric diagnostic tool designed for the early detection of chronic diseases. However, the synaptic connections between the 25 symptomatic items and their relevance in supporting the monitoring of suboptimal health outcomes, which are precursors for chronic diseases, have not been thoroughly evaluated within the framework of predictive, preventive, and personalised medicine (PPPM/3PM). This baseline study explores the internal structure of the SHSQ-25 and demonstrates its discriminatory power to predict optimal and suboptimal health status (SHS) and develop photogenic representations of their distinct relationship patterns.
Methods: The cross-sectional study involved healthy Ghanaian participants (n = 217; aged 30-80 years; ~ 61% female), who responded to the SHSQ-25. The median SHS score was used to categorise the population into optimal and SHS. Graphical LASSO model and multi-dimensional scaling configuration methods were employed to describe the network structures for the two populations.
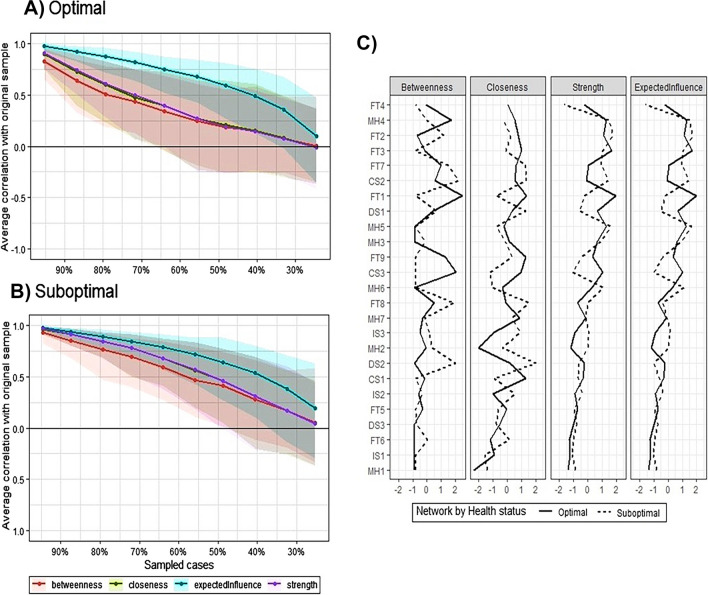
Results: We observed differences in the structural, node placement and node distance of the synaptic networks for the optimal and suboptimal populations. A statistically significant variance in connectivity levels was noted between the optimal (58 non-zero edges) and suboptimal (43 non-zero edges) networks (p = 0.024). Fatigue emerged as a prominently central subclinical condition within the suboptimal population, whilst the cardiovascular system domain had the greatest relevance for the optimal population. The contrast in connectivity levels and the divergent prominence of specific subclinical conditions across domain networks shed light on potential health distinctions.
Conclusions: We have demonstrated the feasibility of creating dynamic visualizers of the evolutionary trends in the relationships between the domains of SHSQ-25 relative to health status outcomes. This will provide in-depth comprehension of the conceptual model to inform personalised strategies to circumvent SHS. Additionally, the findings have implications for both health care and disease prevention because at-risk individuals can be predicted and prioritised for monitoring, and targeted intervention can begin before their symptoms reach an irreversible stage.
Supplementary information: The online version contains supplementary material available at 10.1007/s13167-023-00344-2.
Keywords: Ghana; LASSO model; Network analysis; Predictive preventive personalised medicine (3PM); Suboptimal Health Status Questionnaire-25 (SHSQ-25); Synaptic structures.
© The Author(s) 2023.
Conflict of interest statement
Conflict of interestThe authors declare no competing interests.
Figures


References
-
- International Diabetes Federation, IDF Diabetes Atlas. 2015. http://www.diabetesatlas.org/resources/2015-atlas.html. Accessed 04 June 2023.
LinkOut - more resources
Full Text Sources
