. 2023;28(8):693-703.
doi: 10.5863/1551-6776-28.8.693. Epub 2023 Dec 12.

Pharmacokinetics and Proposed Dosing of Levetiracetam in Children With Obesity

Affiliations

Pharmacokinetics and Proposed Dosing of Levetiracetam in Children With Obesity

Kanecia O Zimmerman et al. J Pediatr Pharmacol Ther. 2023.

Abstract

Objective: Characterize levetiracetam pharmacokinetics (PK) in children with obesity to inform dosing.

Methods: Children 2 to <21 years old receiving standard of care oral levetiracetam across two opportunistic studies provided blood samples. Levetiracetam plasma PK data were analyzed with a nonlinear mixed-effects modeling approach. Indirect measures for body size and covariates were tested for model inclusion. Individual empirical Bayesian estimates using the final model parameters were compared by obesity status. Monte Carlo simulation using total body weight was performed in children with normal estimated glomerular filtration rate to identify dosing for children with obesity that resulted in comparable exposures to normal weight adults and children after receiving label dosing.

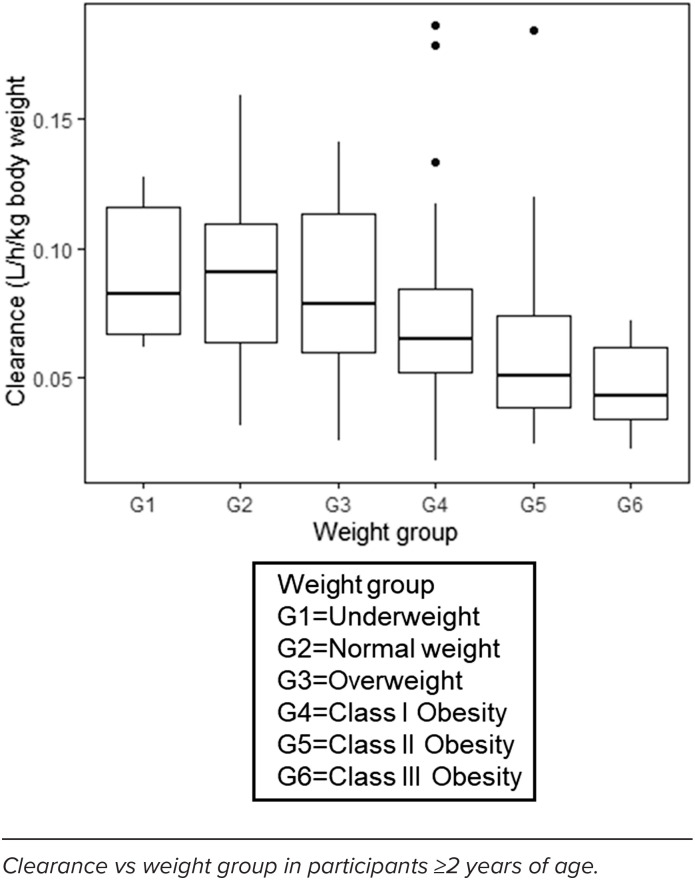
Results: The population PK model was developed from 341 plasma concentrations from 169 children. A 1-compartment model best fit the data with fat-free mass as a significant covariate. Compared with children with normal weight, children with obesity had significantly lower body weight-normalized clearance (median [range], 4.77 [1.49-10.44] and 3.71 [0.86-13.55] L/h/70 kg, respectively). After label dosing with the oral formulation in children with obesity 4 to <16 years old, maximum and minimum steady-state concentrations were higher (25% and 41%, respectively [oral solution] and 27% and 19%, respectively [tablet]) compared with children with normal weight. Comparable exposures between children with and without obesity were achieved with weight-tiered dosing regimens of <75 kg or ≥75 kg.

Conclusions: Weight-tiered dosing for levetiracetam oral solution and tablets for children with obesity 4 to <16 years old results in more comparable exposures to children of normal weight.

Keywords: Keppra; children; levetiracetam; obesity; pharmacokinetics.


Figures

Figure 1.
Figure 1.
Prediction-corrected visual predictive check from the final PK model for levetiracetam. Prediction-corrected visual predictive check from the final PK model for levetiracetam within 20 hours after: (A) dose; and (B) all timepoints using semi-logarithmic scaling. Subplots C and D employ linear-linear scaling and correspond to the same time intervals, respectively. The shaded region denotes the 90% prediction interval based on 1000 simulations.
Figure 2.
Figure 2.
Clearance vs weight group.
Figure 3.
Figure 3.
Steady-state Cmax,ss and Cmin,ss after dosing level by obesity status and by levetiracetam oral solution dose regimens. Steady-state Cmax,ss after: (A) low dose; and (B) high dose, and steady-state Cmin,ss after: (C) low dose; and (D) high dose by obesity status and by levetiracetam oral solution dose regimens in children 4 to <16 years. The horizontal dashed and solid lines in panel A depict the minimum (10.0 mcg/mL), mean (17.0 mcg/mL), and maximum (25.0 mcg/mL) Cmax,ss in adults after the label dose of 1000 mg/day Q12h. The horizontal dashed and solid lines in panel B depict the minimum (36.1 mcg/mL), mean (45.1 mcg/mL), and maximum (63.0 mcg/mL) Cmax,ss in adults after the label dose of 3000 mg/day Q12h. The horizontal dashed and solid lines in panel C depict the minimum (3.1 mcg/mL), mean (6.0 mcg/mL), and maximum (10.0 mcg/mL) Cmin,ss in adults after the label dose of 1000 mg/day Q12h. The horizontal dashed and solid lines in panel D depict the minimum (7.0 mcg/mL), mean (16.0 mcg/mL), and maximum (34.0 mcg/mL) Cmin,ss in adults after the label dose of 3000 mg/day Q12h. The horizontal red lines in panels B and D depict the safety threshold for adults after levetiracetam dose. The dark line in the box represents the median, and the length of the box represents the IQR from the simulated exposures. The whisker extends 1.5× the IQR.
Figure 4.
Figure 4.
Steady-state Cmax,ss and Cmin,ss after dosing level by obesity status and levetiracetam tablet dose regimens. Steady-state Cmax,ss after: (A) low dose; and (B) high dose, and steady-state Cmin,ss after: (C) low dose; and (D) high dose by obesity status and levetiracetam tablet dose regimens in children 4 to <16 years. The horizontal dashed and solid lines in panel A depict the minimum (10.0 mcg/mL), mean (17.0 mcg/mL), and maximum (25.0 mcg/mL) Cmax,ss in adults after the label dose of 1000 mg/day Q12h. The horizontal dashed and solid lines in panel B depict the minimum (36.1 mcg/mL), mean (45.1 mcg/mL), and maximum (63.0 mcg/mL) Cmax,ss in adults after the label dose of 3000 mg/day Q12h. The horizontal dashed and solid lines in panel C depict the minimum (3.1 mcg/mL), mean (6.0 mcg/mL), and maximum (10.0 mcg/mL) Cmin,ss in adults after the label dose of 1000 mg/day Q12h. The horizontal dashed and solid lines in panel D depict the minimum (7.0 mcg/mL), mean (16.0 mcg/mL), and maximum (34.0 mcg/mL) Cmin,ss in adults after the label dose of 3000 mg/day Q12h. The horizontal red lines in panels B and D depict the safety threshold for adults after levetiracetam dose. The dark line in the box represents the median, and the length of the box represents the IQR from the simulated exposures. The whisker extends 1.5× the IQR.

References

    1. Keppra (levetiracetam) [package insert] Smyrna, GA: UCB; Oct, 2019.
    1. Centers for Disease Control and Prevention (CDC) Defining childhood weight status. Updated December . 2021;3 Accessed April 21, 2022. https://www.cdc.gov/obesity/childhood/defining.html.
    1. Fryar CD CM, Afful J. Prevalence of overweight, obesity, and severe obesity among children and adolescents aged 2–19 years: United States, 1963–1965 through 2017–2018. National Center for Health Statistics (NCHS) Health E-Stats. Published 2020. Updated January 29, 2021. Accessed April 21, 2022. https://www.cdc.gov/nchs/data/hestat/obesity-child-17-18/obesity-child.h....
    1. Mulla H, Johnson TN. Dosing dilemmas in obese children. Arch Dis Child Educ Pract Ed . 2010;95(4):112–117. - PubMed
    1. Kendrick JG, Carr RR, Ensom MHH. Pharmacokinetics and drug dosing in obese children. J Pediatr Pharmacol Ther . 2010;15(2):94–109. - PMC - PubMed

LinkOut - more resources