. 2023 Sep 6;8(10):1263-1282.
doi: 10.1016/j.jacbts.2023.06.006. eCollection 2023 Oct.

Targeting N-Myristoylation Through NMT2 Prevents Cardiac Hypertrophy and Heart Failure

Affiliations

Targeting N-Myristoylation Through NMT2 Prevents Cardiac Hypertrophy and Heart Failure

Yusuke Tomita et al. JACC Basic Transl Sci. .

Abstract

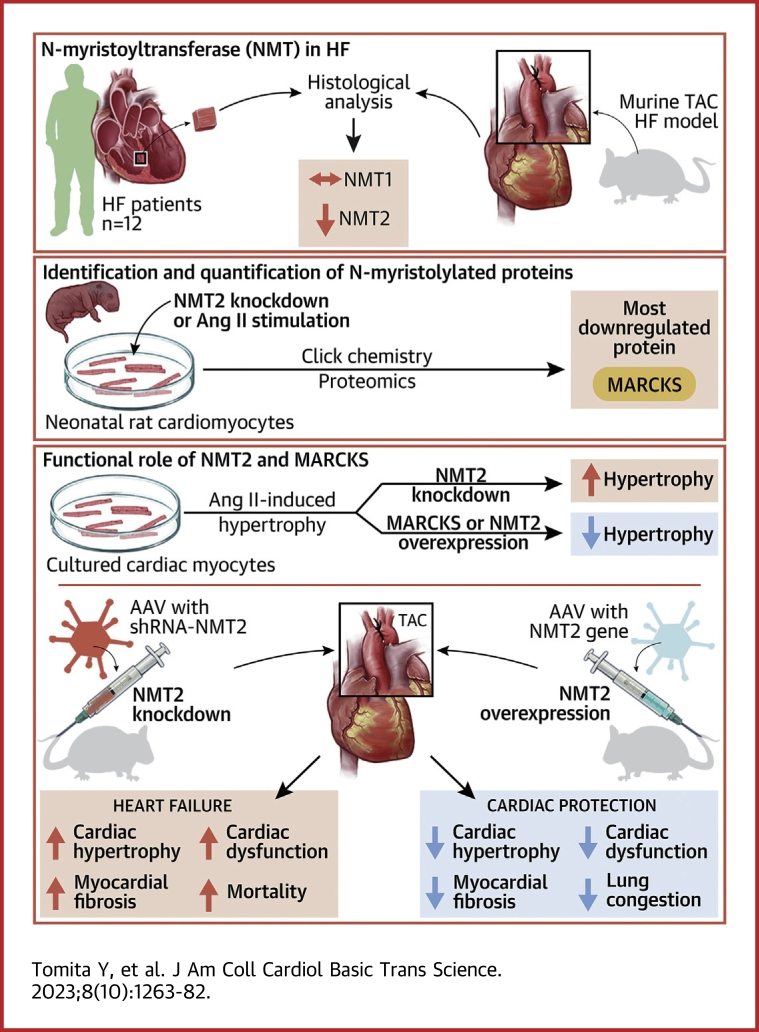
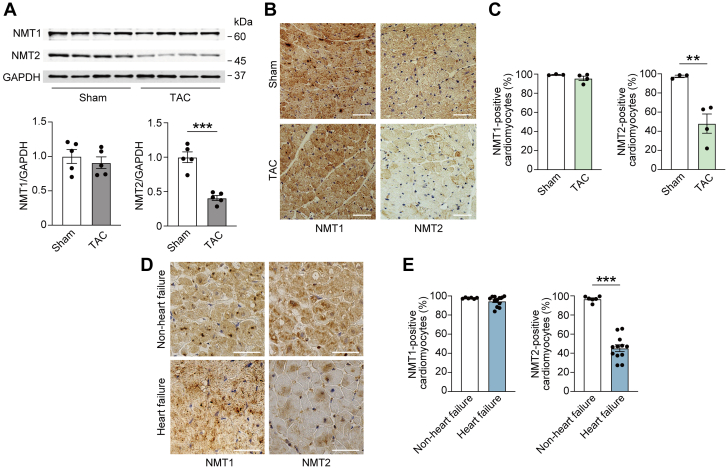
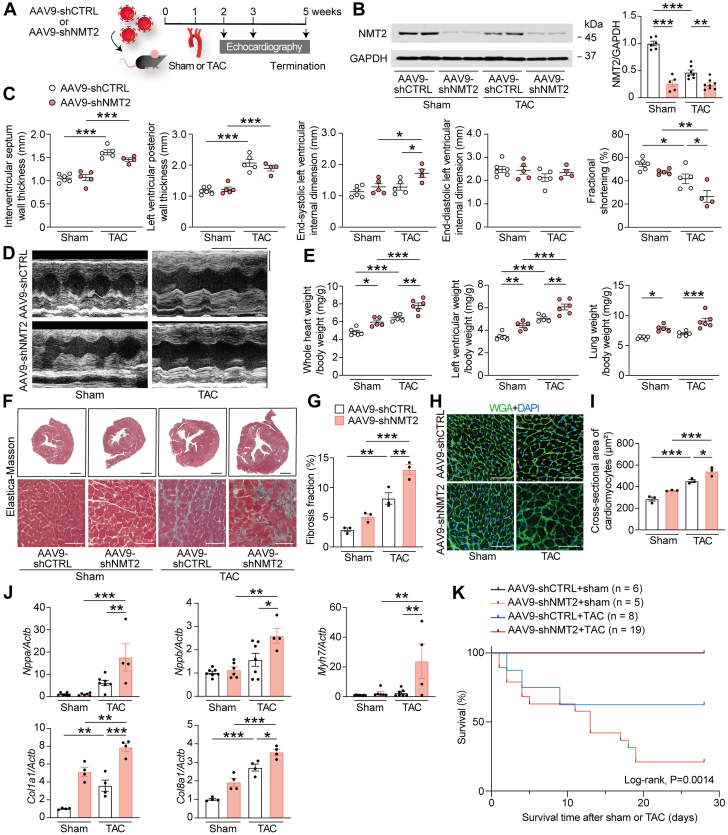
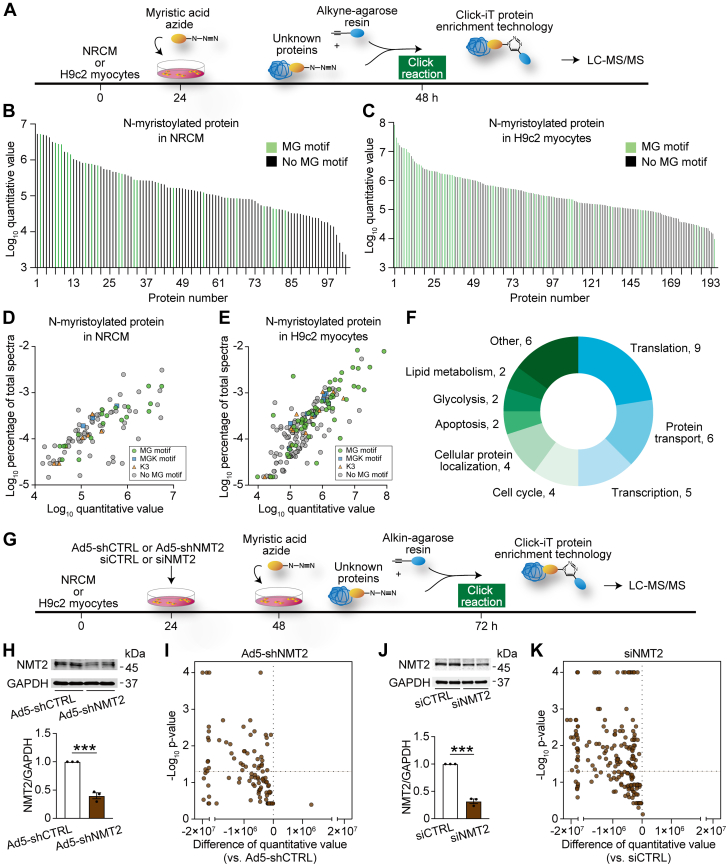
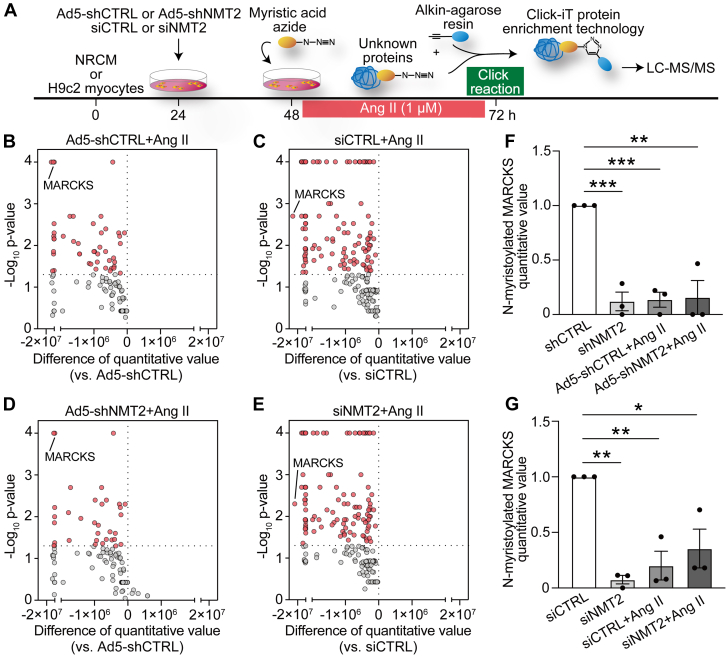
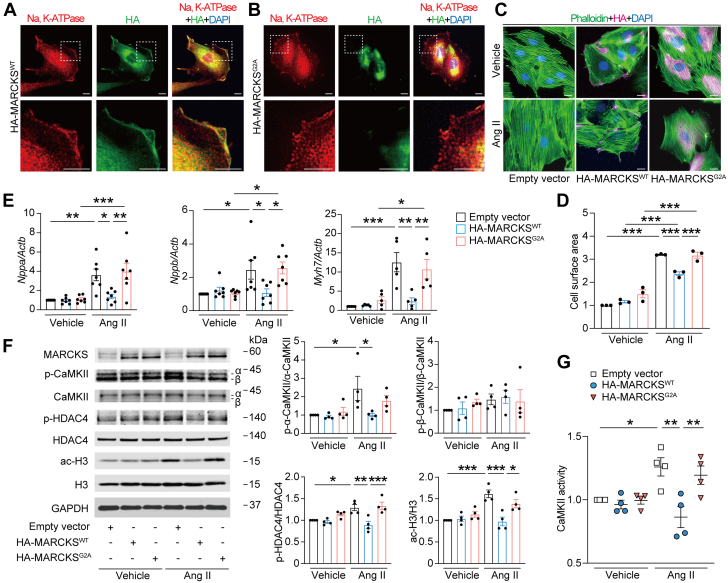
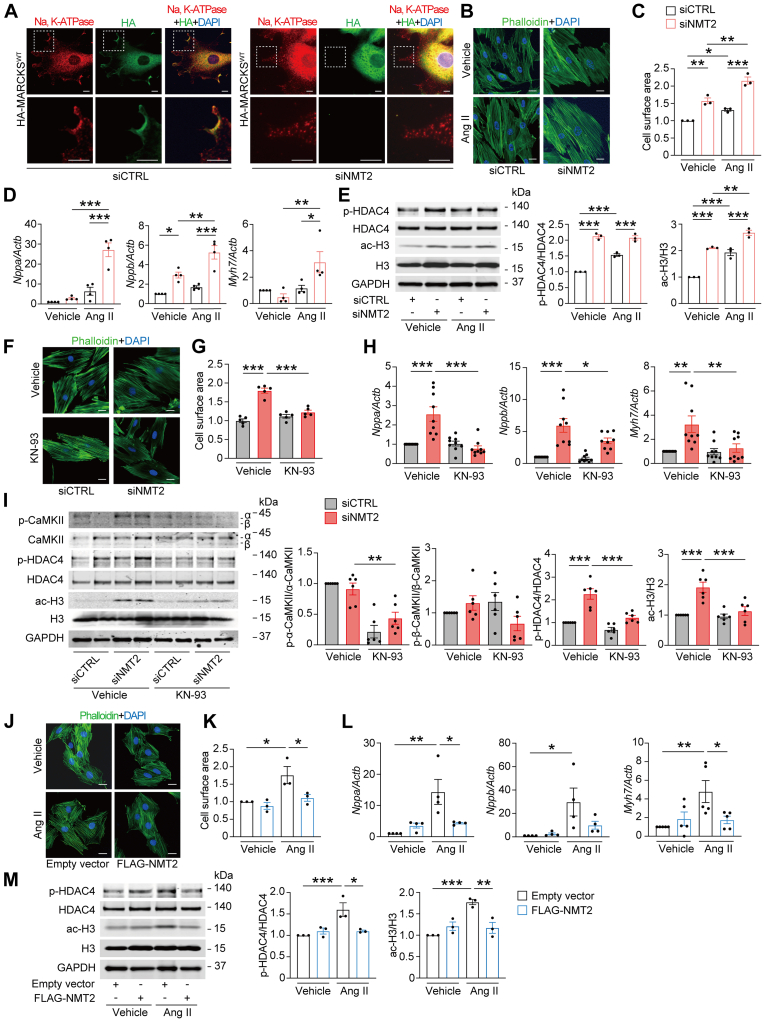
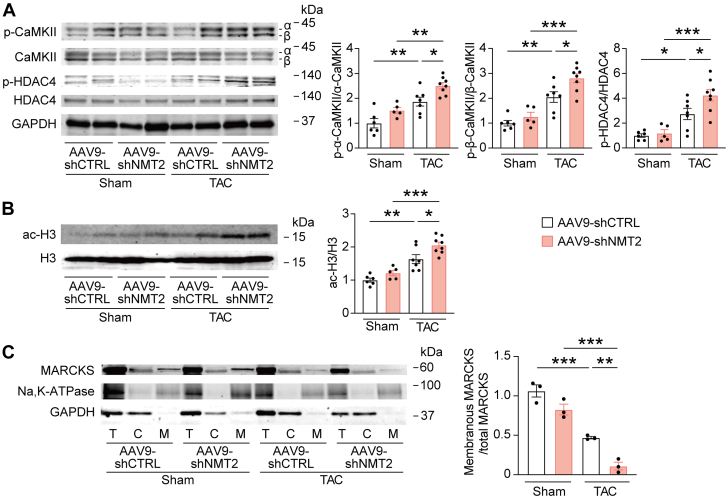
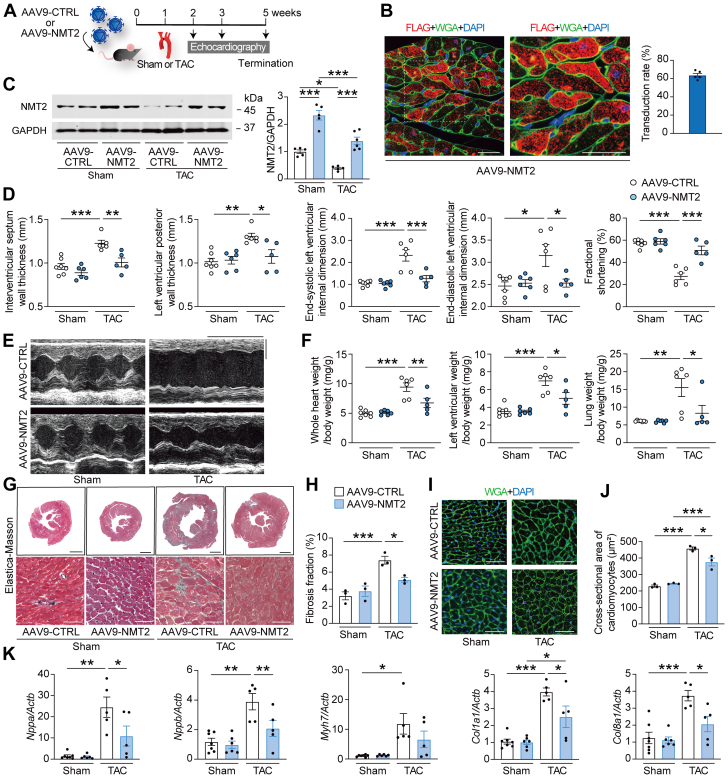
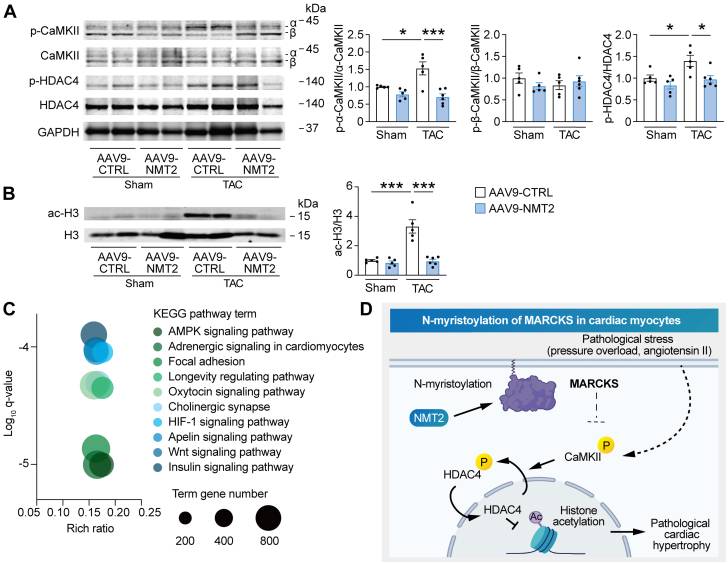
Protein diversity can increase via N-myristoylation, adding myristic acid to an N-terminal glycine residue. In a murine model of pressure overload, knockdown of cardiac N-myristoyltransferase 2 (NMT2) by adeno-associated virus 9 exacerbated cardiac dysfunction, remodeling, and failure. Click chemistry-based quantitative chemical proteomics identified substrate proteins of N-myristoylation in cardiac myocytes. N-myristoylation of MARCKS regulated angiotensin II-induced cardiac pathological hypertrophy by preventing activations of Ca2+/calmodulin-dependent protein kinase II and histone deacetylase 4 and histone acetylation. Gene transfer of NMT2 to the heart reduced cardiac dysfunction and failure, suggesting targeting N-myristoylation through NMT2 could be a potential therapeutic approach for preventing cardiac remodeling and heart failure.

Keywords: N-myristoylation; cardiac remodeling; gene therapy; heart failure; post-translational modifications.


Conflict of interest statement

This work was supported by the Japan Society for the Promotion of Science KAKENHI grants 22K08161 (Dr Tomita), 20K22907 (Dr Anzai), and 19K17572 (Dr Misaka). All other authors have reported that they have no relationships relevant to the contents of this paper to disclose.

Figures

None
Graphical abstract
Figure 1
Figure 1
Changes in Cardiac NMT2 Expression in Heart Failure of Mice and Humans (A) Immunoblot analysis of N-myristoyltransferase 1 (NMT1) and N-myristoyltransferase 2 (NMT2) in the murine heart. Wild-type mice were subjected to either sham procedure or transverse aortic constriction (TAC) surgery using a 28-gauge blunt needle and analyzed 4 weeks after the operation. Glyceraldehyde-3-phosphate dehydrogenase (GAPDH) served as the loading control. The densitometric analysis is shown in the graphs (n = 5 in each). (B) Immunohistochemistry for NMT1 (brown) and NMT2 (brown) in paraffin-embedded sections from mouse hearts. Scale bars = 20 μm. (C) Quantitative analysis of the ratios of NMT1- or NMT2-positive cardiomyocytes determined by immunohistochemistry (n = 3 and 4, respectively). (D) Immunohistochemical analysis of NMT1 (brown) and NMT2 (brown) in paraffin-embedded heart section from non–heart failure control subjects and heart failure patients with idiopathic dilated cardiomyopathy. Scale bars = 20 μm. (E) Quantitative analysis of the ratios of NMT1- or NMT2-positive cardiomyocytes by immunohistochemistry (n = 6 and 12, respectively). All data are presented as mean ± SEM. ∗∗P < 0.01 and ∗∗∗P < 0.001 by the unpaired Student’s t-test (2-sided).
Figure 2
Figure 2
NMT2 Knockdown Is Maladaptive in a Mouse Model of Pathological Cardiac Hypertrophy and Failure (A) A schematic diagram of the experimental design. The mice at the age of 6 weeks were injected with 1.0 × 1011 genome-containing units of adeno-associated virus 9 (AAV9) encoding short hairpin RNA (shRNA) target to NMT2 (AAV9-shNTM2) or LacZ as a control (AAV9-shCTRL). One week later, TAC surgery using a 27-gauge blunt needle or sham procedure was performed. (B) Immunoblot analysis for NMT2 in the heart. The protein extracts from the left ventricles in mice receiving either AAV9-shCTRL or AAV9-shNMT2 at 4 weeks after sham or TAC operation were immunoblotted with the indicated antibodies. GAPDH was used as the loading control. The densitometric analysis is shown in the graphs (n = 5-8 in each group). (C) Echocardiographic assessment. Sham-operated AAV9-shCTRL–injected mice (n = 6), sham-operated AAV9-shNMT2–injected mice (n = 5), TAC-operated AAV9-shCTRL–injected mice (n = 5), and TAC-operated AAV9-shNMT2–injected mice (n = 4). (D) Representative images of M-mode echocardiograms. Scale bars = 0.2 seconds and 2 mm, respectively. (E) Physiological parameters. (F) Elastica-Masson–stained sections of the left ventricles. Scale bar = 1 mm (top) and 20 μm (bottom). (G) Quantitative analysis for fibrosis fraction in Elastica-Masson–stained sections (n = 3 in each). (H) Wheat germ agglutinin (WGA)-stained sections from the left ventricles. The plasma membrane and nucleus are stained with WGA (green) and 4′,6-diamidino-2-phenylindole (DAPI) (blue), respectively. Scale bar = 20 μm. (I) Quantification of the cross-sectional area of cardiomyocytes in WGA-stained sections (n = 3 in each). (J) Messenger RNA expressions of Nppa, Nppb, Myh7, Col1a1, and Col8a1. Actb was used for normalization. The average value for sham-operated AAV9-shCTRL–injected mice was set equal to 1 (n = 4-6). (K) Kaplan-Meier survival curve in AAV9-shCTRL– or AAV9-shNMT2–injected mice after sham or TAC surgery. The numbers of mice and P value by the log-rank test are presented. All data are presented as mean ± SEM. ∗P < 0.05, ∗∗P < 0.01, and ∗∗∗P < 0.001 by 1-way analysis of variance with Tukey’s post hoc analysis. Abbreviations as in Figure 1.
Figure 3
Figure 3
Global Profiling of Substrate Proteins of N-Myristoylation in Cardiac Myocytes by Click Chemistry–Based Quantitative Proteomics (A) A schematic diagram for the workflow of proteomic strategy using click chemistry. Neonatal rat cardiomyocytes (NRCMs) and H9c2 myocytes were incorporated with myristic acid azide for the labeling. N-myristoylated proteins were selectively captured by Click-iT protein enrichment technology using a click reaction with alkyne-agarose resin and analyzed by liquid chromatography–tandem mass spectrometry (LC-MS/MS). According to quantitative proteomics, 103 and 195 N-myristoylated–enriched proteins are identified in (B) NRCM and (C) H9c2 myocytes, respectively. The log quantitative value is plotted for each N-myristoylated substrate. The light green bars show proteins with the MG motif at the N-terminal, and the black bars show those with no MG motif. Data are presented as mean values from 5 and 3 independent experiments performed in triplicate, respectively. (D and E) Scatterplots for log quantitative value and log percentage of total spectra for N-myristoylated proteins according to the containing motif in (D) NRCM and (E) H9c2 myocytes. (F) Biological functions of 40 N-myristoylated proteins commonly detected in NRCM and H9c2 myocytes according to gene ontology annotation. (G) Chemical proteomic workflow with genetic inhibition of NMT2. NRCM were infected with Ad5-shNMT2 or LacZ (Ad5-shCTRL) at a multiplicity of infection of 100. H9c2 myocytes were transfected with small interfering RNA specific to NMT2 (siNMT2) or nontargeting control small interfering RNA (siCTRL). (H) Western blot analysis for NMT2 in NRCM infected with Ad5-shNMT2 for 48 hours (n = 3 in each). GAPDH was used as a loading control. The densitometric analysis is shown in the graph. (I) Volcano plots for N-myristoylated proteins in NRCM infected with Ad5-shNMT2 compared with those with Ad5-shCTRL from independent 3 experiments performed in triplicate. (J) Western blot analysis of NMT2 in H9c2 myocytes (n = 3 in each). (K) Volcano plots showing quantitative value and log P value for N-myristoylated proteins in H9c2 myocytes transfected with siNMT2 in comparison to siCTRL from independent 3 experiments performed in triplicate. ∗∗∗P < 0.001 by the unpaired Student’s t-test (2-sided). Abbreviations as in Figures 1 and 2.
Figure 4
Figure 4
Alteration in N-Myristoylated Levels in Response to Ang II in Cardiac Myocytes (A) The workflow for chemical proteomics. NMT2 expressions were inhibited in NRCM by Ad5-shNMT2 or in H9c2 myocytes by siNMT2, and then cells were stimulated with angiotensin II (Ang II, 1 μmol/L) for 24 hours before collection for click chemistry–based LC-MS/MS proteomics. (B to E) Volcano plots of the difference of quantitative value for N-myristoylated protein levels and log P value followed with the presence and absence of Ang II in Ad5-shCTRL– or Ad5-shNMT2–infected NRCM and in siCTRL- or siNMT2-transfected H9c2 myocytes from 3 independent experiments performed in triplicate. (F and G) Quantification of N-myristoylated MARCKS in (F) NRCM and (G) H9c2 myocytes. Data are presented as mean ± SEM (n = 3 in each). ∗P < 0.05, ∗∗P < 0.01, and ∗∗∗P < 0.001 by 1-way analysis of variance with Tukey’s post hoc analysis. Abbreviations as in Figures 1, 2, and 3.
Figure 5
Figure 5
Functional Role of N-Myristoylation of MARCKS in Cardiac Myocytes (A and B) Immunofluorescence images for subcellular localization of MARCKS. H9c2 myocytes were transfected with hemagglutinin (HA)-tagged wild-type MARCKS (MARCKSWT) or HA-tagged mutant MARCKS with replacement of N-terminal glycine to alanine (MARCKSG2A) for 48 hours. Cells were stained with anti-Na, potassium–adenosine triphosphatase (K-ATPase) (red), and anti-HA (green) antibodies with DAPI (blue). Images in boxed areas at higher magnification are shown in lower panels. Scale bars = 5 μm. (C) Immunofluorescence images for assessment of myocyte hypertrophy. Transfected H9c2 myocytes with empty vector, MARCKSWT, or MARCKSG2A were stimulated with vehicle or Ang II (1 μmol/L) for 24 hours and stained with phalloidin (green), anti-HA (magenta) antibody, and DAPI (blue). Scale bar = 5 μm. (D) Quantitative analysis of the cell surface area determined by phalloidin staining. Data are expressed as a relative ratio to empty vector with vehicle from 3 independent experiments. (E) Messenger RNA expression levels in Nppa, Nppb, and Myh7. The data were normalized to Actb levels (n = 5-7 in each). (F) Immunoblot analysis for Ca2+/calmodulin-dependent protein kinase II (CaMKII) phosphorylation, histone deacetylase 4 (HDAC4) phosphorylation, and histone H3 acetylation in H9c2 myocytes. The ratios of phosphorylated α-CaMKII (p-α-CaMKII) to total α-CaMKII, phosphorylated β-CaMKII (p-β-CaMKII) to total β-CaMKII, phosphorylated HDAC4 (p-HDAC4) to total HDAC4, and acetylated H3 (ac-H3) to total H3 are quantified and presented in the graphs (n = 4 in each). (G) CaMKII activity. Forty-eight hours after transfection followed by Ang II, cell lysates were collected, and activities of CaMKII were determined and expressed as a relative ratio over the control group of empty vector with vehicle (n = 4 in each). All data are presented as mean ± SEM. ∗P < 0.05, ∗∗P < 0.01, and ∗∗∗P < 0.001 by 1-way analysis of variance with Tukey’s post hoc analysis.
Figure 6
Figure 6
Role of NMT2 in Ang II–Induced Pathological Hypertrophy (A) Representative immunofluorescence images for localization of MARCKS in H9c2 myocytes. Twenty-four hours after transfection with siCTRL or siNMT2, HA-MARCKSWT was transfected and stained for anti-Na, K-ATPase (red), and anti-HA (green) antibodies with DAPI (blue). Images in boxed areas at higher magnification are shown in lower panels. Scale bars = 5 μm. (B) Immunofluorescence images for the assessment of myocyte hypertrophy altered by the inhibition of NMT2. Transfected H9c2 myocytes with siCTRL or siNMT2 were stimulated with vehicle or Ang II (1 μmol/L) for 24 hours and stained with phalloidin (green) and DAPI (blue). Scale bars = 5 μm. (C) Quantitative analysis of the cell surface area determined by phalloidin staining. More than 100 cells were counted. Data are expressed as a relative ratio over siCTRL with vehicle from 3 independent experiments. (D) Messenger RNA expression levels in Nppa, Nppb, and Myh7. The data were normalized to Actb levels (n = 4 in each). (E) Western blot analysis on HDAC4 phosphorylation and histone H3 acetylation. Quantitative analyses of the ratios of phosphorylated HDAC4 (p-HDAC4) to total HDAC4 and acetylated H3 (ac-H3) to total H3 are shown in the graphs (n = 3 in each). (F) Involvement of CaMKII-related signaling in Ang II–induced hypertrophic response in NMT2-knockdown H9c2 myocytes. siRNA-transfected cells were incubated with CaMKII inhibitor (KN-93, 5 μmol/L) or vehicle for 1 hour before Ang II (1 μmol/L) stimulation. Twenty-four hours after Ang II, cell surface area was assessed by phalloidin (green) and DAPI (blue) staining. Scale bar = 5 μm. (G) Quantitative analysis of the cell surface area determined by phalloidin staining. Data are expressed as a relative ratio over siCTRL with vehicle from 5 independent experiments. (H) mRNA expression levels in Nppa, Nppb, and Myh7. The data were normalized to Actb levels (n = 9 in each). (I) Immunoblot analysis for phosphorylation of CaMKII and HDAC4 and acetylation of histone H3 (n = 6 in each). Data are expressed as a relative ratio over vehicle-treated siCTRL group. (J) Assessment of hypertrophic responses with overexpression of NMT2 by immunofluorescence. Transfected H9c2 myocytes with empty vector or FLAG-NMT2 were stimulated with vehicle or Ang II (1 μmol/L) for 24 hours and stained with phalloidin (green) and DAPI (blue). Scale bar = 5 μm. (K) Quantitative analysis of the cell surface area determined by phalloidin staining. Data are expressed as a relative ratio over empty vector with vehicle from 3 independent experiments. (L) Messenger RNA expression levels in Nppa, Nppb, and Myh7. The data were normalized to Actb levels (n = 4-5 in each). (M) Western blot analysis on HDAC4 phosphorylation and histone H3 acetylation (n = 3 in each). All data are presented as mean ± SEM. ∗P < 0.05, ∗∗P < 0.01, and ∗∗∗P < 0.001 by 1-way analysis of variance with Tukey’s post hoc analysis. Abbreviations as in Figures 1, 2, 3, 4, and 5.
Figure 7
Figure 7
MARCKS N-Myristoylation–Related Signaling During Pressure Overload–Induced Heart Failure in Mice With AAV9-Mediated NMT2 Knockdown Immunoblot analysis for CaMKII phosphorylation, (A) HDAC4 phosphorylation and (B) histone H3 acetylation. The protein extracts from the left ventricles in mice receiving either AAV9-shCTRL or AAV9-shNMT2 at 4 weeks post-sham or -TAC operation were immunoblotted with the indicated antibodies. The ratios of p-α-CaMKII to total α-CaMKII, p-β-CaMKII to total β-CaMKII, p-HDAC4 to total HDAC4, and ac-H3 to total H3 are quantified and presented in the graphs (n = 5-8). GAPDH was used as the loading control. (C) Fractionated immunoblots for intracellular distribution of MARCKS in the hearts following AAV9-mediated NMT2 knockdown. The fractions are represented as membranous (M) and cytosolic (C). T represents a total protein. The levels of plasma membranous MARCKS were normalized to the total levels of MARCKS (n = 3 in each). Na, K-ATPase, and GAPDH were used as controls to ensure the quality of plasma membrane and cytoplasm fractionation, respectively. All data are presented as mean ± SEM. ∗P < 0.05, ∗∗P < 0.01, and ∗∗∗P < 0.001 by 1-way analysis of variance with Tukey’s post hoc analysis. Abbreviations as in Figures 1, 2, and 5.
Figure 8
Figure 8
NMT2 Gene Transfer Specific to the Heart Prevents Cardiac Pathological Hypertrophy and Remodeling in a Murine Model of Heart Failure (A) Experimental design. AAV9 encoding mouse NMT2 with a FLAG-tag (AAV9-NMT2) with 1.0 × 1011 genome-containing units were injected in mice at the age of 6 weeks. AAV9 encoding mouse LacZ was used as a control (AAV9-CTRL). One week later, TAC surgery using a 28-gauge blunt needle or sham procedure was performed. (B) Representative images of immunohistochemistry for FLAG (red) and wheat germ agglutinin (WGA) (green) with DAPI (blue) from left ventricular tissue sections 5 weeks after AAV9-NMT2 injections. Boxed areas are highlighted in the right panel. Scale bars = 20 μm. The transduction rate of AAV9-NMT2 in the left ventricles is presented in the graph according to the ratio of cardiomyocytes with FLAG-positives (n = 5). (C) Immunoblot analysis for NMT2 in the heart. (D) Echocardiographic parameters. Sham-operated AAV9-CTRL–injected mice (n = 7), sham-operated AAV9-NMT2–injected mice (n = 6), TAC-operated AAV9-CTRL–injected mice (n = 6), and TAC-operated AAV9-NMT2–injected mice (n = 5). (E) Representative images of M-mode echocardiograms. Scale bars = 0.2 seconds and 2 mm, respectively. (F) Physiological parameters. (G) Elastica-Masson–stained sections of the left ventricles. Scale bar = 1 mm (top) and 20 μm (bottom). (H) Quantitative analysis of fibrosis fraction in Elastica-Masson–stained sections (n = 3 in each). (I) Representative images of WGA (green)- and DAPI (blue)-stained sections. Scale bar = 20 μm. (J) Quantitative analysis for the cross-sectional area of cardiomyocytes from WGA-stained sections. More than 100 cardiomyocytes were analyzed (n = 3 in each). (K) Messenger RNA expression of Nppa, Nppb, Myh7, Col1a1, and Col8a1 from the left ventricles by reverse transcription–quantitative polymerase chain reaction. Actb was used as the loading control. The average value for sham-operated AAV9-CTRL–injected mice was set equal to 1 (n = 5-7). All data are presented as mean ± SEM. ∗P < 0.05, ∗∗P < 0.01, and ∗∗∗P < 0.001 by 1-way analysis of variance with Tukey’s post hoc analysis. Abbreviations as in Figures 1 and 2.
Figure 9
Figure 9
Protective Effects of NMT2 in the Heart Are Mediated by CaMKII-Related Histone H3 Acetylation Signaling Immunoblot analysis for CaMKII phosphorylation, (A) HDAC4 phosphorylation, and (B) histone H3 acetylation in cardiac NMT2-overexpressing mice after TAC (n = 5-8). (C) KEGG analyses of RNA sequencing from the left ventricle. Log q-values, rich ratio, and top 10 KEGG enrichment pathways of TAC-operated mice receiving AAV9-NMT2 in comparison to TAC-operated AAV9-CTRL–injected mice are shown in a bubble plot. The size of the circle depicts the number of genes annotated to each KEGG pathway. (D) The proposed model of a cardioprotective role of N-myristoylation through NMT2 in cardiac myocytes. All data are presented as mean ± SEM. ∗P < 0.05 and ∗∗∗P < 0.001 by 1-way analysis of variance with Tukey’s post hoc analysis. Abbreviations as in Figures 1, 5, and 8.

References

    1. Burchfield J.S., Xie M., Hill J.A. Pathological ventricular remodeling: mechanisms: part 1 of 2. Circulation. 2013;128(4):388–400. - PMC - PubMed
    1. Nakamura M., Sadoshima J. Mechanisms of physiological and pathological cardiac hypertrophy. Nat Rev Cardiol. 2018;15(7):387–407. - PubMed
    1. Fert-Bober J., Murray C.I., Parker S.J., Van Eyk J.E. Precision profiling of the cardiovascular post-translationally modified proteome: where there is a will, there is a way. Circ Res. 2018;122(9):1221–1237. - PMC - PubMed
    1. Reimand J., Wagih O., Bader G.D. Evolutionary constraint and disease associations of post-translational modification sites in human genomes. PLoS Genet. 2015;11(1) - PMC - PubMed
    1. Lundby A., Andersen M.N., Steffensen A.B., et al. In vivo phosphoproteomics analysis reveals the cardiac targets of beta-adrenergic receptor signaling. Sci Signal. 2013;6(278):rs11. - PubMed

LinkOut - more resources