. 2023 Dec 26;42(12):113413.
doi: 10.1016/j.celrep.2023.113413. Epub 2023 Dec 12.

Synonymous codon usage regulates translation initiation

Affiliations

Synonymous codon usage regulates translation initiation

Chloe L Barrington et al. Cell Rep. .

Abstract

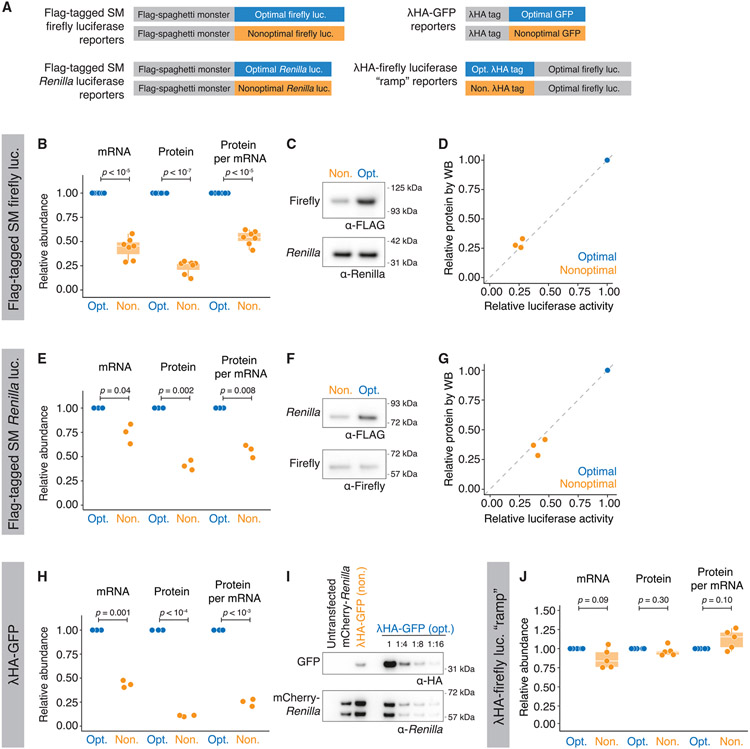
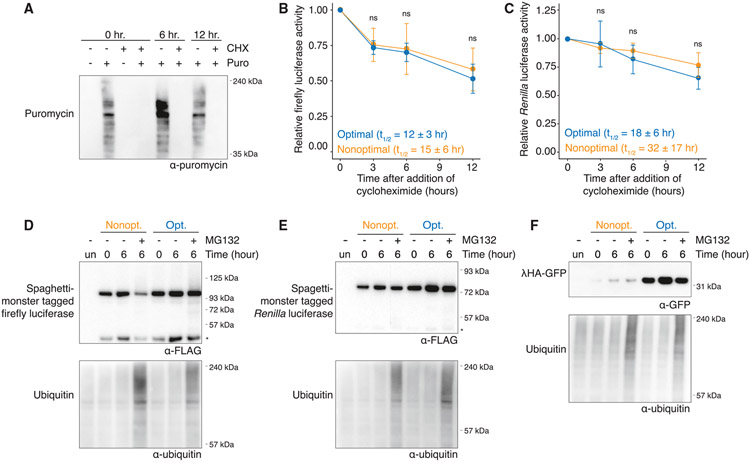
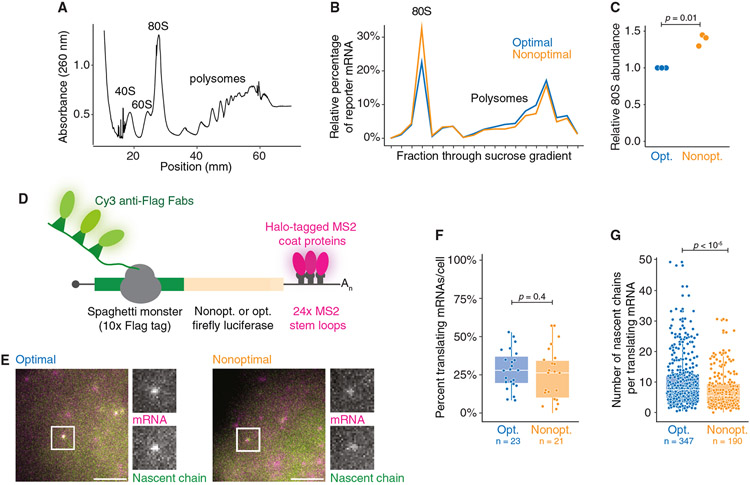
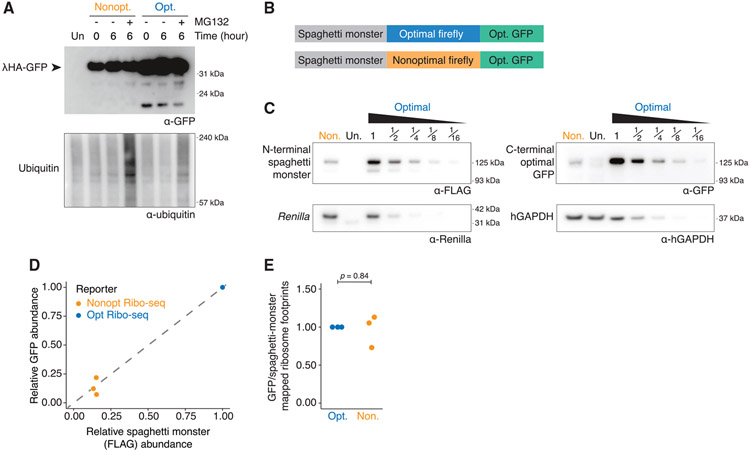
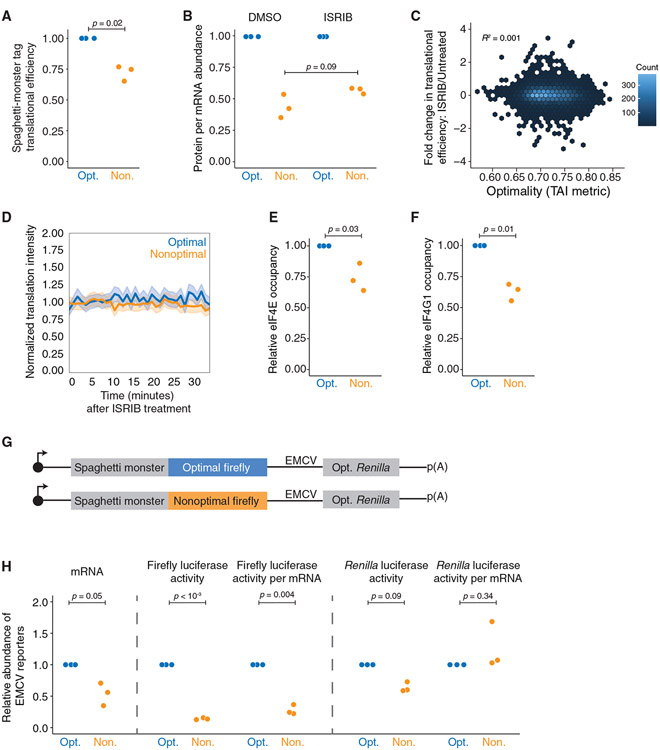
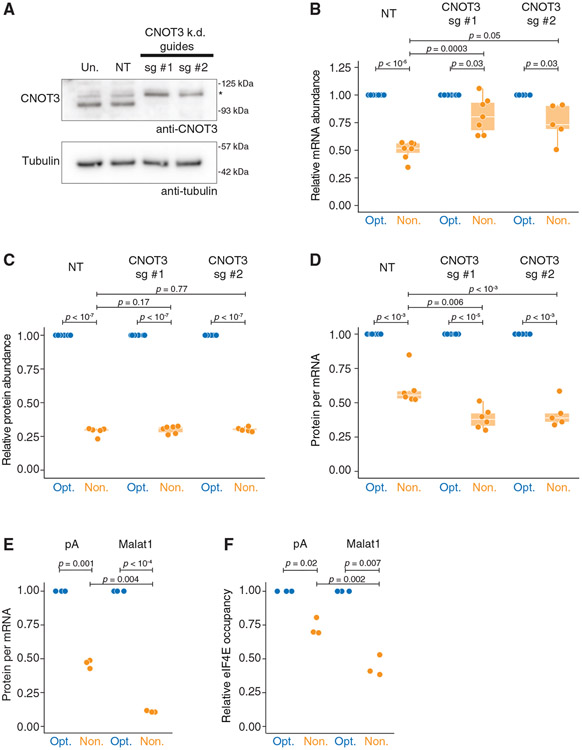
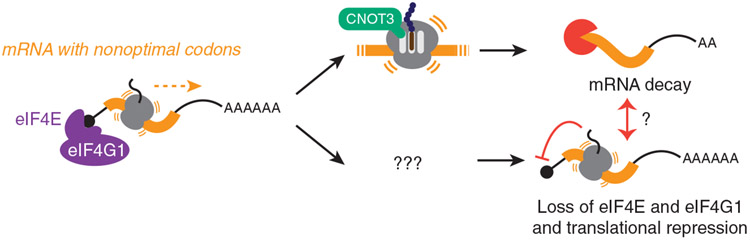
Nonoptimal synonymous codons repress gene expression, but the underlying mechanisms are poorly understood. We and others have previously shown that nonoptimal codons slow translation elongation speeds and thereby trigger messenger RNA (mRNA) degradation. Nevertheless, transcript levels are often insufficient to explain protein levels, suggesting additional mechanisms by which codon usage regulates gene expression. Using reporters in human and Drosophila cells, we find that transcript levels account for less than half of the variation in protein abundance due to codon usage. This discrepancy is explained by translational differences whereby nonoptimal codons repress translation initiation. Nonoptimal transcripts are also less bound by the translation initiation factors eIF4E and eIF4G1, providing a mechanistic explanation for their reduced initiation rates. Importantly, translational repression can occur without mRNA decay and deadenylation, and it does not depend on the known nonoptimality sensor, CNOT3. Our results reveal a potent mechanism of regulation by codon usage where nonoptimal codons repress further rounds of translation.

Keywords: CNOT3; CP: Molecular biology; codon optimality; deadenylation; eIF4E; gene regulation; mRNA decay; ribosome; translation initiation; translational repression.


Conflict of interest statement

Declaration of interests O.S.R. is a member of the Molecular Cell advisory board and the Cell Reports advisory board.

Figures

Figure 1.
Figure 1.. Codon optimality affects protein levels beyond what can be explained by changes at the mRNA level
(A) Schematic of optimality reporters used in this figure and throughout the article. (B) SM-tagged firefly luciferase optimality reporters show differences in protein activity, even after controlling for mRNA abundance. HEK293T cells were transfected with plasmids expressing each reporter along with optimized Renilla luciferase. Shown are box-and-whisker plots for the relative fold change for mRNA abundance (RT-qPCR), protein activity (dual-luciferase assay), and normalized protein-per-mRNA abundance; n = 7. (C) Nonoptimal firefly luciferase reporters have reduced protein levels. Western blotting was performed by probing for the SM tag and Renilla luciferase. (D) Western blotting and luciferase assays show a comparable reduction in firefly luciferase levels due to nonoptimality. A scatterplot compares the fold change in the nonoptimal reporter firefly luciferase abundance as determined by luciferase activity or western blotting (p = 0.3; n = 3). (E–G) As in (B)–(D) except for SM-tagged Renilla luciferase (n = 3). (G) As in (D) except for Renilla luciferase (p = 0.2; n = 3). (H) As in (B) except for γHA-tagged GFP. Protein levels were quantified by western blotting, with mCherry-Renilla as transfection control (n = 3). (I) Nonoptimal GFP shows reduced protein levels. Shown is a representative western blot to quantify the reduction in γHA-GFP protein levels due to nonoptimal codons. Lysates were serially diluted for quantification, and fold change was calculated relative to Renilla luciferase. (J) Translation of nonoptimal γHA firefly luciferase “ramp” reporter does not trigger mRNA decay nor reduce protein activity. HEK293T cells were transfected and analyzed as in (B) (n = 3)
Figure 2.
Figure 2.. Poor codon optimality does not affect protein stability
(A) Cycloheximide (CHX) treatment reduces translation. HEK293T cells were treated with CHX or DMSO for 0, 6, and 12 h, and then puromycin was added 10 min before harvesting. Its incorporation was determined by western blotting. (B) Codon optimality does not affect the stability of firefly luciferase protein. Cells were transfected with the SM-tagged firefly luciferase reporters and harvested at various time points after CHX addition. The amount of firefly luciferase was determined by luciferase assay and normalized to time = 0 h. Mean values ± SD are shown; p = 0.35, n = 3. (C) As in (B) except for SM-tagged Renilla luciferase reporters; p = 0.18, n = 3. (D) Codon optimality does not affect the proteasome-mediated degradation of firefly luciferase. After cells were transfected with SM-tagged firefly luciferase reporters, they were treated with MG132 (10 μM) and harvested at various time points before western blotting. An asterisk (*) refers to a cleavage product within the SM tag. (E) As in (D) except for SM-tagged Renilla luciferase reporters. An asterisk (*) refers to a cleavage product within the SM tag. (F) As in (D) except for γHA-GFP reporters.
Figure 3.
Figure 3.. Nonoptimal codons reduce ribosome association
(A) Representative polysome fractionation. U2OS cells were transfected with both the nonoptimal and optimal SM-tagged firefly luciferase reporters before sucrose fractionation. Shown is an absorbance curve from a representative gradient. (B) Nonoptimal codon usage affects ribosome association. Fractions from each gradient were pooled based on the number of ribosomes, and the amount of each reporter was quantified with RT-qPCR. Plotted is the percentage of each reporter per fraction for a representative biological replicate. (C) Nonoptimal codon usage increases association with the 80S fraction. Plotted is the abundance of the nonoptimal firefly reporter mRNA in the 80S fraction relative to the optimal; n = 3. (D) Schematic of the nascent chain tracking system. (E) mRNA and protein signals colocalize. Fluorescent images of representative cells expressing optimal (left) and nonoptimal (right) firefly luciferase reporters. The white boxes highlight a single punctum with grayscale insets, showing both mRNA (MS2-coat proteins) and nascent chain (anti-FLAG Fab) signals. Scale bar, 5 μm. (F) Codon usage does not affect the percentage of translating mRNAs. Shown is a box-and-whisker plot for the percent of reporter mRNAs translating per cell. Each point refers to a single cell. p value was determined by Mann-Whitney U test. Mean values ±SD are shown. N = 23 and 21 for optimal and nonoptimal reporters, respectively. (G) Nonoptimal codons reduce the number of ribosomes bound to each translating mRNA. Plotted is a box-and-whisker plot for the number of nascent chains associated with each reporter mRNA. Each point refers to a single reporter molecule. p value was determined by Mann-Whitney U test. Mean values ± SD are shown. N = 347 and 190 for optimal and nonoptimal reporters, respectively.
Figure 4.
Figure 4.. Nonoptimal codons do not lead to incomplete translation or RQC
(A) Nonoptimal codons do not lead to truncated protein products. HEK239T cells were transfected with lHA-GFP optimality reporters and treated for 6 h with MG132 (10 μM) or DMSO before western blotting and probing for each reporter (α-GFP) and ubiquitin. Four times more nonoptimal γHA-GFP lysate was loaded, and the blot was overexposed. (B) Schematic of the dual-tagged reporters used for the Ribo-seq experiment. (C) Nonoptimal codons repress protein expression for the dual-tagged firefly luciferase reporters. HEK293T cells were transfected with the dual-tagged reporters alongside Renilla luciferase, and western blotting determined protein abundance (N-terminal SM tag [α-FLAG]), the C-terminal tag (α-GFP), Renilla luciferase, and hGAPDH. Lysates containing the optimized Ribo-seq reporter were serially diluted, and twice as much nonoptimal Ribo-seq reporter lysate was loaded. (D) The decrease in FLAG and GFP signals from the nonoptimal dual-tagged Ribo-seq optimality reporter, compared to the optimal, is consistent. Scatterplot is a quantification of n = 3, one of which is shown in (C); p = 0.86. (E) Nonoptimal codons do not lead to ribosome drop-off. Shown is the ratio of ribosome-protected fragments mapping to the C-terminal GFP tag relative to the N-terminal SM tag for both. The first 25 codons of the SM tag and the last 25 codons of the GFP tag were excluded from this analysis (n = 3).
Figure 5.
Figure 5.. Nonoptimal codons inhibit translation initiation through reduced eIF4E and eIF4G1 binding
(A) Nonoptimal codons reduce ribosome association upstream. Shown is the normalized translational efficiency for the N-terminal SM tag, which is upstream of the optimal or nonoptimal firefly luciferase ORF, in the dual-tagged reporters (n = 3). (B) ISRIB does not rescue the translational efficiency of the nonoptimal reporter. HEK293T cells were transfected with plasmids expressing each reporter alongside optimized Renilla luciferase. Shown are normalized protein-per-mRNA abundance, mRNA abundance (RT-qPCR), and protein activity (dual-luciferase assay); n = 3. (C) ISRIB does not rescue the translational efficiency throughout the human transcriptome in an optimality-dependent manner. Meta-analysis was performed from published Ribo-seq data. Shown is the change in translational efficiency of the HEK293T transcriptome when unstressed cells were treated with ISRIB, plotted against their tAI optimality score (Rep “A”). (D) ISRIB does not rescue the number of ribosomes translating nonoptimal SM-tagged luciferase reporter transcripts. Plotted is the average change in translational intensity on individual reporter transcripts, tracked over time in U2OS cells, following DMSO or ISRIB treatment. For the nonoptimal reporter, 17 cells were imaged (338 total translation spots). For the optimal reporter, 13 cells were imaged (242 total translation spots). Mean values ± SD are shown. (E) Nonoptimal codons reduce eIF4E binding. HEK293T cells were transfected with either optimal or nonoptimal SM-tagged firefly luciferase reporters, along with Renilla luciferase, and then eIF4E RNA immunoprecipitations (RIPs) were performed (n = 3). (F) Nonoptimal codons reduce eIF4G1 binding. As in (E) except for eIF4G1 RIPs (n = 3). (G) Schematic of reporter constructs with Renilla luciferase being expressed by an EMCV IRES. (H) eIF4E is required to reduce translation initiation on nonoptimal transcripts. HEK293T cells were transfected with plasmids expressing each reporter, along with γHA-GFP as a transfection control. mRNA abundance was quantified by RT-qPCR, with values normalized to GFP. Protein activity was quantified by dual-luciferase activity. Shown are the fold changes in the nonoptimal reporter relative to the optimal: (1) (left) mRNA abundance, (2) (middle) firefly luciferase activity, and firefly luciferase activity relative to mRNA abundance, and (3) (right) Renilla luciferase activity, and Renilla luciferase activity relative to mRNA abundance; n = 3.
Figure 6.
Figure 6.. Translation repression does not require mRNA decay or deadenylation
(A) CRISPR guides can effectively knock down CNOT3. HEK293T lysates were collected 4 days following blasticidin selection and probed for CNOT3 (105 kDa expected; *, nonspecific band) and tubulin. (B) Upon CNOT3 knockdown, nonoptimal mRNA levels are rescued relative to optimal. Following 4 days of blasticidin selection, cells were transfected with SM-firefly luciferase reporters and optimized Renilla luciferase. RT-qPCR quantified mRNA abundance. Box-and-whisker plots show relative fold change in transcript (guide #1: n = 7; guide #2: n = 5). (C) Upon CNOT3 knockdown, nonoptimal protein activity is unchanged. Like in (B) but measured relative protein levels by dual-luciferase assay (guide #1: n = 7; guide #2: n = 5). (D) Upon CNOT3 knockdown, there is more translational repression of the nonoptimal reporter. Values plotted are extrapolated from (B) and (C), calculating protein activity relative to transcript abundance. (E) Neither deadenylation nor a poly(A) tail is required for translational repression. HEK293T cells were transfected with plasmids expressing optimality reporters, which, after processing, ended in a poly(A) tail or Malat1 triple helix. Shown is a dot plot depicting normalized protein-per-mRNA abundance (dual-luciferase assay and RT-qPCR; n = 3). (F) Without a poly(A) tail, nonoptimal codons further reduce eIF4E binding. HEK293T cells were transfected with plasmids as in (E), and eIF4E RIPs were performed; n = 3.
Figure 7.
Figure 7.. Model: Nonoptimal codons repress gene expression by two post-transcriptional mechanisms
Nonoptimal codons slow translation elongation and can lead to a ribosome state with empty A and E sites. CNOT3 can sense this state and thus recruits the CCR4-NOT deadenylase complex to trigger mRNA destabilization. Slow elongation also reduces eIF4E and eIF4G1 binding, thereby repressing translation initiation. It is unclear what ribosome state is sensed—and how this information is transmitted—to suppress translation. Nevertheless, neither mRNA deadenylation nor decay is required for translational repression, and in fact, they seem to limit the extent to which translation is repressed.

References

    1. Grimson A, Farh KK-H, Johnston WK, Garrett-Engele P, Lim LP, and Bartel DP (2007). MicroRNA targeting specificity in mammals: determinants beyond seed pairing. Mol. Cell 27, 91–105. 10.1016/j.molcel.2007.06.017. - DOI - PMC - PubMed
    1. Hinnebusch AG, Ivanov IP, and Sonenberg N (2016). Translational control by 5′-untranslated regions of eukaryotic mRNAs. Science 352, 1413–1416. 10.1126/science.aad9868. - DOI - PMC - PubMed
    1. Rissland OS, Subtelny AO, Wang M, Lugowski A, Nicholson B, Laver JD, Sidhu SS, Smibert CA, Lipshitz HD, and Bartel DP (2017). The influence of microRNAs and poly(A) tail length on endogenous mRNA-protein complexes. Genome Biol 18, 211. 10.1186/s13059-017-1330-z. - DOI - PMC - PubMed
    1. Leppek K, Das R, and Barna M (2018). Author Correction: Functional 5′ UTR mRNA structures in eukaryotic translation regulation and how to find them. Nat. Rev. Mol. Cell Biol 19, 673. 10.1038/s41580-018-0055-5. - DOI - PubMed
    1. Mayr C (2019). What Are 3′ UTRs Doing? Cold Spring Harb. Perspect. Biol 11. 10.1101/cshperspect.a034728. - DOI - PMC - PubMed

Publication types