. 2024 Jan;44(1):e230053.
doi: 10.1148/rg.230053.

Hemodialysis Access: US for Preprocedural Mapping and Evaluation of Maturity and Access Dysfunction

Affiliations

Hemodialysis Access: US for Preprocedural Mapping and Evaluation of Maturity and Access Dysfunction

Kedar G Sharbidre et al. Radiographics. 2024 Jan.

Abstract

Patients with kidney failure require kidney replacement therapy. While renal transplantation remains the treatment of choice for kidney failure, renal replacement therapy with hemodialysis may be required owing to the limited availability and length of time patients may wait for allografts or for patients ineligible for transplant owing to advanced age or comorbidities. The ideal hemodialysis access should provide complication-free dialysis by creating a direct connection between an artery and vein with adequate blood flow that can be reliably and easily accessed percutaneously several times a week. Surgical arteriovenous fistulas and grafts are commonly created for hemodialysis access, with newer techniques that involve the use of minimally invasive endovascular approaches. The emphasis on proactive planning for the placement, protection, and preservation of the next vascular access before the current one fails has increased the use of US for preoperative mapping and monitoring of complications for potential interventions. Preoperative US of the extremity vasculature helps assess anatomic suitability before vascular access creation, increasing the rates of successful maturation. A US mapping protocol ensures reliable measurements and clear communication of anatomic variants that may alter surgical planning. Postoperative imaging helps assess fistula maturation before cannulation for dialysis and evaluates for early and late complications associated with arteriovenous access. Clinical and US findings can suggest developing stenosis that may progress to thrombosis and loss of access function, which can be treated with percutaneous vascular interventions to preserve access patency. Vascular access steal, aneurysms and pseudoaneurysms, and fluid collections are other complications amenable to US evaluation. ©RSNA, 2023 Supplemental material is available for this article. Test Your Knowledge questions for this article are available through the Online Learning Center.


Conflict of interest statement

Disclosures of conflicts of interest.—: R.K.V. Speaker honorarium from Becton, Dickinson and Company. M.L.R. Grant from Phillips Medical, honoraria for vascular panel participation from Philips Medical, and editorial board member of Radiology, Journal of Ultrasound in Medicine, and Ultrasound Quarterly. All other authors, the editor, and the reviewers have disclosed no relevant relationships.

Figures

None
Graphical abstract
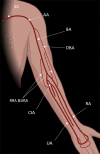
Schematic diagram shows the normal arterial anatomy of the left upper
extremity. AA = axillary artery, BA = brachial artery, CIA = common interosseous
artery, DBA = deep brachial artery, RA = radial artery, RRA = radial recurrent
artery, SA = subclavian artery, UA = ulnar artery, URA = ulnar recurrent
artery.
Figure 1.
Schematic diagram shows the normal arterial anatomy of the left upper extremity. AA = axillary artery, BA = brachial artery, CIA = common interosseous artery, DBA = deep brachial artery, RA = radial artery, RRA = radial recurrent artery, SA = subclavian artery, UA = ulnar artery, URA = ulnar recurrent artery.
Illustrations show various surgical AVF and AVG sites. (A) Radial
artery–cephalic vein AVF. (B) Brachial artery–cephalic vein
AVF. (C) Brachial artery–transposed basilic vein AVF. (D) Brachial
artery–axillary vein straight AVG. (E) Brachial
artery–axillary vein loop AVG. (F) Brachial artery–cephalic
vein forearm AVG. (G) Lower extremity femoral artery–great saphenous
vein AVG. Arrows = flow direction.
Figure 2.
Illustrations show various surgical AVF and AVG sites. (A) Radial artery–cephalic vein AVF. (B) Brachial artery–cephalic vein AVF. (C) Brachial artery–transposed basilic vein AVF. (D) Brachial artery–axillary vein straight AVG. (E) Brachial artery–axillary vein loop AVG. (F) Brachial artery–cephalic vein forearm AVG. (G) Lower extremity femoral artery–great saphenous vein AVG. Arrows = flow direction.
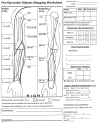
Preoperative imaging protocol worksheet used at our institution. AXA =
axillary artery, AXV = axillary vein, BAV = basilic vein, BRA = brachial artery,
BRV = brachial vein, CR = axillary artery, CV = cephalic vein, FA = forearm, IJ
= internal jugular vein, MAV = median antecubital vein, MCV = medial cephalic
vein, RA = radial artery, SCV = subclavian vein, UA = ulnar artery, WR =
wrist.
Figure 3.
Preoperative imaging protocol worksheet used at our institution. AXA = axillary artery, AXV = axillary vein, BAV = basilic vein, BRA = brachial artery, BRV = brachial vein, CR = axillary artery, CV = cephalic vein, FA = forearm, IJ = internal jugular vein, MAV = median antecubital vein, MCV = medial cephalic vein, RA = radial artery, SCV = subclavian vein, UA = ulnar artery, WR = wrist.
Technique for venous diameter and depth measurement. Transverse gray-scale
US image of the cephalic vein (CV) at the wrist (WR) shows the measurement of
inner diameter (ID) in the anteroposterior dimension (dashed blue line) and the
anterior wall depth from the skin surface (dashed orange arrow).
Figure 4.
Technique for venous diameter and depth measurement. Transverse gray-scale US image of the cephalic vein (CV) at the wrist (WR) shows the measurement of inner diameter (ID) in the anteroposterior dimension (dashed blue line) and the anterior wall depth from the skin surface (dashed orange arrow).
Assessment of arterial calcifications. Longitudinal (LO) gray-scale US
image of the radial artery shows severe atherosclerotic wall calcifications
(arrows) that pose potential difficulty for surgical suturing, possible
increased risk of emboli at surgery, decreased distensibility, and decreased
likelihood to mature due to inadequate arterial inflow. CR = cranial, ID =
internal diameter, WR = wrist.
Figure 5.
Assessment of arterial calcifications. Longitudinal (LO) gray-scale US image of the radial artery shows severe atherosclerotic wall calcifications (arrows) that pose potential difficulty for surgical suturing, possible increased risk of emboli at surgery, decreased distensibility, and decreased likelihood to mature due to inadequate arterial inflow. CR = cranial, ID = internal diameter, WR = wrist.
Vascular measurements in a patient considered for endovascular AVF.
Transverse gray-scale US image of the forearm 2 cm caudal (CAUD) to the ACF
shows measurements of the inner lumen diameter of the radial artery (RA) and
radial veins (RVV) and the distance between the artery and veins (white lines)
of less than 2 mm.
Figure 6.
Vascular measurements in a patient considered for endovascular AVF. Transverse gray-scale US image of the forearm 2 cm caudal (CAUD) to the ACF shows measurements of the inner lumen diameter of the radial artery (RA) and radial veins (RVV) and the distance between the artery and veins (white lines) of less than 2 mm.
Technique used for blood flow volume measurement. Longitudinal US image at
a straight segment of the vessel identifies an area without turbulent flow
(color Doppler spectrum not shown). The Doppler gate is increased in size to
encompass the entire vessel diameter and is corrected to an angle of 60 degrees
or less, parallel to the posterior vessel wall. Only the antegrade flow is
measured.
Figure 7.
Technique used for blood flow volume measurement. Longitudinal US image at a straight segment of the vessel identifies an area without turbulent flow (color Doppler spectrum not shown). The Doppler gate is increased in size to encompass the entire vessel diameter and is corrected to an angle of 60 degrees or less, parallel to the posterior vessel wall. Only the antegrade flow is measured.
Modified Allen test using Doppler US. (A) US transducer is positioned on
the thenar eminence to measure the superficial palmar artery flow direction
during radial artery compression. Flow reversal during compression indicates a
complete palmar arch, as depicted on this US image. (B) Doppler US image in a
patient with an incomplete palmar arch shows there is no flow reversal in the
obliquely oriented radial artery that occurs during compression since there is
no collateral flow from the ulnar artery through the superficial palmar arch.
White arrow in A and B indicates when compression is applied.
Figure 8.
Modified Allen test using Doppler US. (A) US transducer is positioned on the thenar eminence to measure the superficial palmar artery flow direction during radial artery compression. Flow reversal during compression indicates a complete palmar arch, as depicted on this US image. (B) Doppler US image in a patient with an incomplete palmar arch shows there is no flow reversal in the obliquely oriented radial artery that occurs during compression since there is no collateral flow from the ulnar artery through the superficial palmar arch. White arrow in A and B indicates when compression is applied.
Diagram shows complete (A) and incomplete (B) palmar arches. DPA = deep
palmar arch, RA = radial artery, SPA = superficial palmar arch, UA = ulnar
artery.
Figure 9.
Diagram shows complete (A) and incomplete (B) palmar arches. DPA = deep palmar arch, RA = radial artery, SPA = superficial palmar arch, UA = ulnar artery.
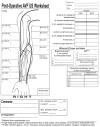
Worksheet used for communicating findings from postoperative AVF US
examinations at our institution. ANAS = anastomosis, BA = brachial artery,
CV = cephalic vein, FA = forearm, UA = ulnar artery.
Figure 10.
Worksheet used for communicating findings from postoperative AVF US examinations at our institution. ANAS = anastomosis, BA = brachial artery, CV = cephalic vein, FA = forearm, UA = ulnar artery.
Normal gray-scale appearance of an AVG and vascular stent. (A)
Longitudinal gray-scale US image of the upper extremity AVG shows a distinct
linear echogenicity (arrows) or “tram-track” appearance. (B)
Longitudinal gray-scale US image shows an endovascular stent within the
venous side of an AVF and linear serrated hyperechoic stent wall.
Figure 11.
Normal gray-scale appearance of an AVG and vascular stent. (A) Longitudinal gray-scale US image of the upper extremity AVG shows a distinct linear echogenicity (arrows) or “tram-track” appearance. (B) Longitudinal gray-scale US image shows an endovascular stent within the venous side of an AVF and linear serrated hyperechoic stent wall.
Mature AVF. (A) Transverse gray-scale US image shows the cephalic vein
diameter is greater than 6 mm and depth is less than 6 mm from the skin surface.
(B) Longitudinal US image shows the flow volume measurement is obtained within
the outflow vein 10 cm from the anastomosis and is greater than 600
mL/min.
Figure 12.
Mature AVF. (A) Transverse gray-scale US image shows the cephalic vein diameter is greater than 6 mm and depth is less than 6 mm from the skin surface. (B) Longitudinal US image shows the flow volume measurement is obtained within the outflow vein 10 cm from the anastomosis and is greater than 600 mL/min.
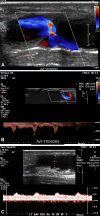
Immature AVF with large accessory veins. (A) Transverse gray-scale US
image of the forearm draining cephalic vein (CV) shows a large accessory vein
(arrow) arising 2 cm from the anastomosis (not shown). (B) Spectral US image of
the flow volume measurement shows a reduced draining vein flow volume of 382
mL/min, measured in the cephalic vein 10 cm from the anastomosis. (C) Gray-scale
US image shows typical shadowing from coils used to occlude the accessory
vein.
Figure 13.
Immature AVF with large accessory veins. (A) Transverse gray-scale US image of the forearm draining cephalic vein (CV) shows a large accessory vein (arrow) arising 2 cm from the anastomosis (not shown). (B) Spectral US image of the flow volume measurement shows a reduced draining vein flow volume of 382 mL/min, measured in the cephalic vein 10 cm from the anastomosis. (C) Gray-scale US image shows typical shadowing from coils used to occlude the accessory vein.
Diagram shows common sites of stenosis in a radiocephalic
AVF.
Figure 14.
Diagram shows common sites of stenosis in a radiocephalic AVF.
Juxta-anastomotic stenosis treated with percutaneous angioplasty in a
48-year-old man with brachial artery–basilic vein AVF. (A, B) Color
Doppler (A) and spectral Doppler (B) US images at the AVF anastomosis in an
area of focal visual narrowing show the color aliasing and elevated PSV of
286 cm/sec, compared with a brachial artery PSV of 54 cm/sec (not shown),
giving a ratio of 5.2 that is consistent with stenosis. (C) Spectral Doppler
US image shows reduced flow volume in the draining basilic vein of 52
mL/min. Interventional images are shown in Figure S5.
Figure 15.
Juxta-anastomotic stenosis treated with percutaneous angioplasty in a 48-year-old man with brachial artery–basilic vein AVF. (A, B) Color Doppler (A) and spectral Doppler (B) US images at the AVF anastomosis in an area of focal visual narrowing show the color aliasing and elevated PSV of 286 cm/sec, compared with a brachial artery PSV of 54 cm/sec (not shown), giving a ratio of 5.2 that is consistent with stenosis. (C) Spectral Doppler US image shows reduced flow volume in the draining basilic vein of 52 mL/min. Interventional images are shown in Figure S5.
AVG anastomotic stenosis in a dysfunctional AVG in a 44-year-old
woman. (A) Spectral Doppler US image of the right upper arm brachiocephalic
AVG shows a PSV 164 cm/sec in the brachial artery 2 cm cranial to the
arterial anastomosis (upstream). (B) Doppler US image shows an elevated PSV
718 cm/sec at the arterial anastomosis results in a PSV ratio of 4:4,
consistent with that of stenosis (gray-scale image not shown). (C) Doppler
US image shows that the low-flow volume at the venous end of the AVG
measures 465 cc/min.
Figure 16.
AVG anastomotic stenosis in a dysfunctional AVG in a 44-year-old woman. (A) Spectral Doppler US image of the right upper arm brachiocephalic AVG shows a PSV 164 cm/sec in the brachial artery 2 cm cranial to the arterial anastomosis (upstream). (B) Doppler US image shows an elevated PSV 718 cm/sec at the arterial anastomosis results in a PSV ratio of 4:4, consistent with that of stenosis (gray-scale image not shown). (C) Doppler US image shows that the low-flow volume at the venous end of the AVG measures 465 cc/min.
Central venous stenosis in a 55-year-old woman with an AVF of the
right upper extremity. (A, B) Spectral Doppler US images show a monophasic
slow-flow waveform in the right subclavian vein (A), while the contralateral
Internal jugular vein (B) and left subclavian vein (not shown) have normal
phasic waveforms. (C) Spectral Doppler US image shows reduced flow volume at
the venous outflow of the AVF that measures 189 mL/min. (D) Digital
subtraction venogram of the right upper extremity shows moderate to severe
stenosis of the right innominate vein (arrow). (E) Digital subtraction
venogram of the right upper extremity after balloon venoplasty shows no
residual stenosis within the right innominate vein. Posttreatment US (not
shown) showed significant improvement in draining vein flow
volume.
Figure 17.
Central venous stenosis in a 55-year-old woman with an AVF of the right upper extremity. (A, B) Spectral Doppler US images show a monophasic slow-flow waveform in the right subclavian vein (A), while the contralateral Internal jugular vein (B) and left subclavian vein (not shown) have normal phasic waveforms. (C) Spectral Doppler US image shows reduced flow volume at the venous outflow of the AVF that measures 189 mL/min. (D) Digital subtraction venogram of the right upper extremity shows moderate to severe stenosis of the right innominate vein (arrow). (E) Digital subtraction venogram of the right upper extremity after balloon venoplasty shows no residual stenosis within the right innominate vein. Posttreatment US (not shown) showed significant improvement in draining vein flow volume.
Left brachiocephalic AVF thrombosis in a 52-year-old woman with arm
pain and loss of AVF thrill. (A) Longitudinal spectral Doppler US image of
the left brachial artery proximal to the AVF shows a high-resistance
waveform with reversed diastolic flow (“knocking waveform”).
Normally, there is low-resistance flow in the artery proximal to a patent
AVF or AVG anastomosis. (B) Longitudinal spectral Doppler US image of the
left cephalic draining vein shows an avascular echogenic occlusive clot,
with loss of blood flow and spectral waveform in the cephalic
vein.
Figure 18.
Left brachiocephalic AVF thrombosis in a 52-year-old woman with arm pain and loss of AVF thrill. (A) Longitudinal spectral Doppler US image of the left brachial artery proximal to the AVF shows a high-resistance waveform with reversed diastolic flow (“knocking waveform”). Normally, there is low-resistance flow in the artery proximal to a patent AVF or AVG anastomosis. (B) Longitudinal spectral Doppler US image of the left cephalic draining vein shows an avascular echogenic occlusive clot, with loss of blood flow and spectral waveform in the cephalic vein.
Asymptomatic arterial steal phenomenon in a 54-year-old man with a
left arm brachiocephalic AVF. Doppler US images of the brachial artery
proximal to the AVF (A) show a low-resistance monophasic waveform while the
artery distal to the AVF (B) has reversal of flow, suggesting arterial
steal.
Figure 19.
Asymptomatic arterial steal phenomenon in a 54-year-old man with a left arm brachiocephalic AVF. Doppler US images of the brachial artery proximal to the AVF (A) show a low-resistance monophasic waveform while the artery distal to the AVF (B) has reversal of flow, suggesting arterial steal.
Arterial steal syndrome in a 62-year-old woman with right
radiocephalic AVF who presented with hand pain and numbness. (A) Spectral
color Doppler US image of the radial artery cranial to the AVF shows
antegrade flow. (B) Spectral Doppler US image of the radial artery caudal to
the AVF anastomosis shows retrograde flow changing to antegrade flow during
manual compression of the AVF.
Figure 20.
Arterial steal syndrome in a 62-year-old woman with right radiocephalic AVF who presented with hand pain and numbness. (A) Spectral color Doppler US image of the radial artery cranial to the AVF shows antegrade flow. (B) Spectral Doppler US image of the radial artery caudal to the AVF anastomosis shows retrograde flow changing to antegrade flow during manual compression of the AVF.
Symptomatic steal syndrome in a 64-year-old man with a left
brachiocephalic AVF and left hand pain. (A) Longitudinal spectral Doppler US
image shows flow reversal in the brachial artery distal to the anastomosis
consistent with steal syndrome. (B) Fistulogram with iodinated contrast
agent shows a dilated tortuous draining vein (white solid arrow) but no
arterial flow distal to the anastomosis (dashed black arrow at the expected
course of the radial artery). (C) Manual compression of the AVF outflow
during angiography shows antegrade flow in the brachial artery (arrow),
distal to the anastomosis. This patient was successfully treated with
surgical banding of the AVF.
Figure 21.
Symptomatic steal syndrome in a 64-year-old man with a left brachiocephalic AVF and left hand pain. (A) Longitudinal spectral Doppler US image shows flow reversal in the brachial artery distal to the anastomosis consistent with steal syndrome. (B) Fistulogram with iodinated contrast agent shows a dilated tortuous draining vein (white solid arrow) but no arterial flow distal to the anastomosis (dashed black arrow at the expected course of the radial artery). (C) Manual compression of the AVF outflow during angiography shows antegrade flow in the brachial artery (arrow), distal to the anastomosis. This patient was successfully treated with surgical banding of the AVF.
Left brachiocephalic aneurysm in a 75-year-old man. (A) Longitudinal
gray-scale US image shows aneurysmal dilatation involving all three layers
of the vessel wall at the anastomosis, with an area of nonocclusive
eccentric intramural thrombus (arrow). (B) Color Doppler US image shows flow
within the aneurysm with eccentric mural thrombus (arrow). The ratio of
aneurysm size (20 mm) to the outflow vein diameter (6 mm; measurement not
shown) is 3:3.
Figure 22.
Left brachiocephalic aneurysm in a 75-year-old man. (A) Longitudinal gray-scale US image shows aneurysmal dilatation involving all three layers of the vessel wall at the anastomosis, with an area of nonocclusive eccentric intramural thrombus (arrow). (B) Color Doppler US image shows flow within the aneurysm with eccentric mural thrombus (arrow). The ratio of aneurysm size (20 mm) to the outflow vein diameter (6 mm; measurement not shown) is 3:3.
Pseudoaneurysm of the right upper extremity graft in a 35-year-old
woman. B-flow US image shows communication of the pseudoaneurysm with the
graft (arrows).
Figure 23.
Pseudoaneurysm of the right upper extremity graft in a 35-year-old woman. B-flow US image shows communication of the pseudoaneurysm with the graft (arrows).
Pseudoaneurysm of the left upper arm AVF in a 64-year-old man. (A)
Gray-scale US image shows a large pseudoaneurysm (*) arising from the
posterior aspect of the AVF (arrow). The dashed line indicates the AVF
defect. (B) Color Doppler US image shows swirling flow (*) within the
pseudoaneurysm. (C) Spectral Doppler US waveform obtained within the
pseudoaneurysm shows a to-and-fro flow pattern (yin-yang sign) owing to
blood flow moving in and out of the pseudoaneurysm.
Figure 24.
Pseudoaneurysm of the left upper arm AVF in a 64-year-old man. (A) Gray-scale US image shows a large pseudoaneurysm (*) arising from the posterior aspect of the AVF (arrow). The dashed line indicates the AVF defect. (B) Color Doppler US image shows swirling flow (*) within the pseudoaneurysm. (C) Spectral Doppler US waveform obtained within the pseudoaneurysm shows a to-and-fro flow pattern (yin-yang sign) owing to blood flow moving in and out of the pseudoaneurysm.
AV access–associated fluid collections. (A) Gray-scale US image of
an abscess shows a complex fluid collection that contains air (arrow). In the
setting of clinical signs of infection, this is characteristic of an abscess.
(B) Color Doppler US image of the abscess shows no internal flow.
Figure 25.
AV access–associated fluid collections. (A) Gray-scale US image of an abscess shows a complex fluid collection that contains air (arrow). In the setting of clinical signs of infection, this is characteristic of an abscess. (B) Color Doppler US image of the abscess shows no internal flow.
AV access–associated fluid collections. Color Doppler US image of a
seroma near the arterial anastomosis of an AVG shows an anechoic collection with
a few thin septa. Note there is no flow within the collection.
Figure 26.
AV access–associated fluid collections. Color Doppler US image of a seroma near the arterial anastomosis of an AVG shows an anechoic collection with a few thin septa. Note there is no flow within the collection.
HD access graft–associated fluid collections. (A) Gray-scale US
image of a perigraft hematoma shows a lobular collection with internal echoes
partly surrounding the graft (arrow). (B) Color Doppler US image shows that
there is no blood flow in the collection. A hematoma can appear similar to an
abscess, but this patient had no clinical signs of infection.
Figure 27.
HD access graft–associated fluid collections. (A) Gray-scale US image of a perigraft hematoma shows a lobular collection with internal echoes partly surrounding the graft (arrow). (B) Color Doppler US image shows that there is no blood flow in the collection. A hematoma can appear similar to an abscess, but this patient had no clinical signs of infection.

References

    1. United States Renal Data System . USRDS Annual Data Report: Epidemiology of kidney disease in the United States . Bethesda, MD: : National Institutes of Health, National Institute of Diabetes and Digestive and Kidney Diseases; , 2022. .
    1. Hill NR , Fatoba ST , Oke JL , et al. . Global Prevalence of Chronic Kidney Disease: A Systematic Review and Meta-Analysis . PLoS One 2016. ; 11 ( 7 ): e0158765 . - PMC - PubMed
    1. Jager KJ , Kovesdy C , Langham R , Rosenberg M , Jha V , Zoccali C . A single number for advocacy and communication-worldwide more than 850 million individuals have kidney diseases . Nephrol Dial Transplant 2019. ; 34 ( 11 ): 1803 – 1805 . - PubMed
    1. Lok CE , Huber TS , Lee T , et al. ; National Kidney Foundation . KDOQI Clinical Practice Guideline for Vascular Access: 2019 Update . Am J Kidney Dis 2020. ; 75 ( suppl 2 ): S1 – S164 [Published correction appears in Am J Kidney Dis 2021;77(4):551.]. - PubMed
    1. Liyanage T , Ninomiya T , Jha V , et al. . Worldwide access to treatment for end-stage kidney disease: a systematic review . Lancet 2015. ; 385 ( 9981 ): 1975 – 1982 . - PubMed

LinkOut - more resources