Meta-Analysis
. 2023 Dec 14;18(12):e0295542.
doi: 10.1371/journal.pone.0295542. eCollection 2023.

Transcriptomic meta-analysis reveals ERRα-mediated oxidative phosphorylation is downregulated in Fuchs' endothelial corneal dystrophy

Affiliations
Meta-Analysis

Transcriptomic meta-analysis reveals ERRα-mediated oxidative phosphorylation is downregulated in Fuchs' endothelial corneal dystrophy

Xunzhi Zhang et al. PLoS One. .

Abstract

Background: Late-onset Fuchs' endothelial corneal dystrophy (FECD) is a degenerative disease of cornea and the leading indication for corneal transplantation. Genetically, FECD patients can be categorized as with (RE+) or without (RE-) the CTG trinucleotide repeat expansion in the transcription factor 4 gene. The molecular mechanisms underlying FECD remain unclear, though there are plausible pathogenic models proposed for RE+ FECD.

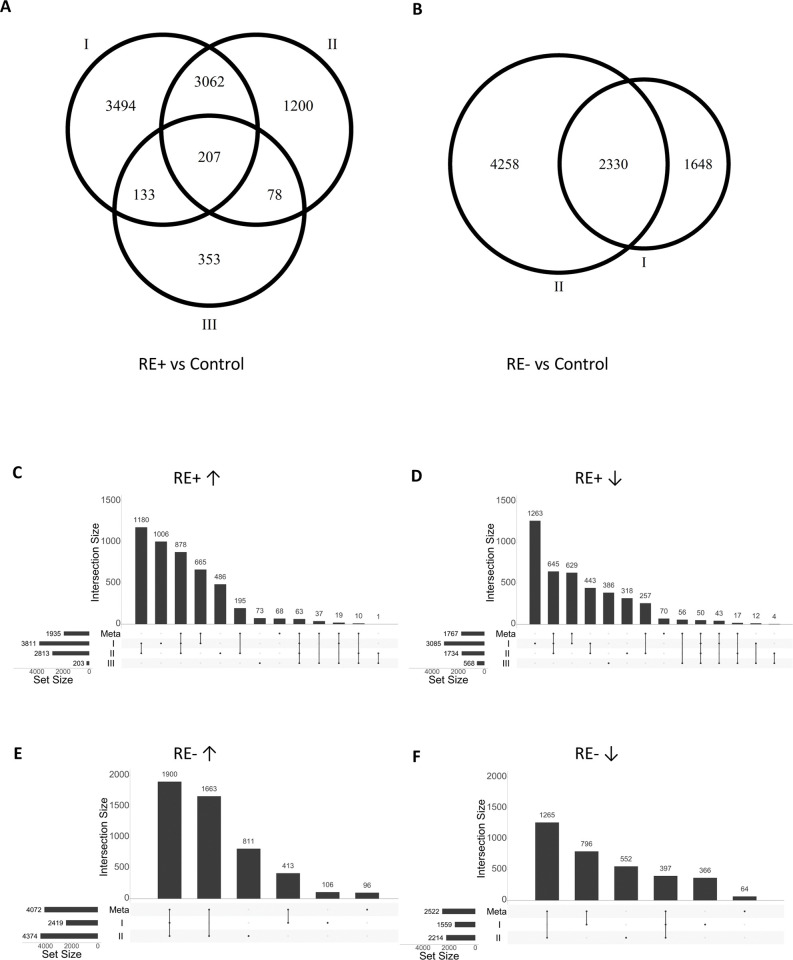
Method: In this study, we performed a meta-analysis on RNA sequencing datasets of FECD corneal endothelium including 3 RE+ datasets and 2 RE- datasets, aiming to compare the transcriptomic profiles of RE+ and RE- FECD. Gene differential expression analysis, co-expression networks analysis, and pathway analysis were conducted.

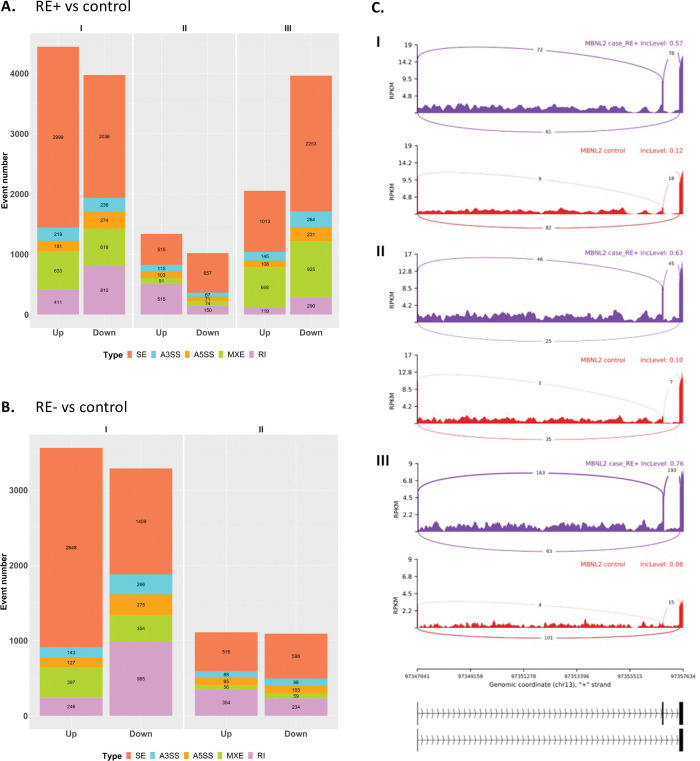
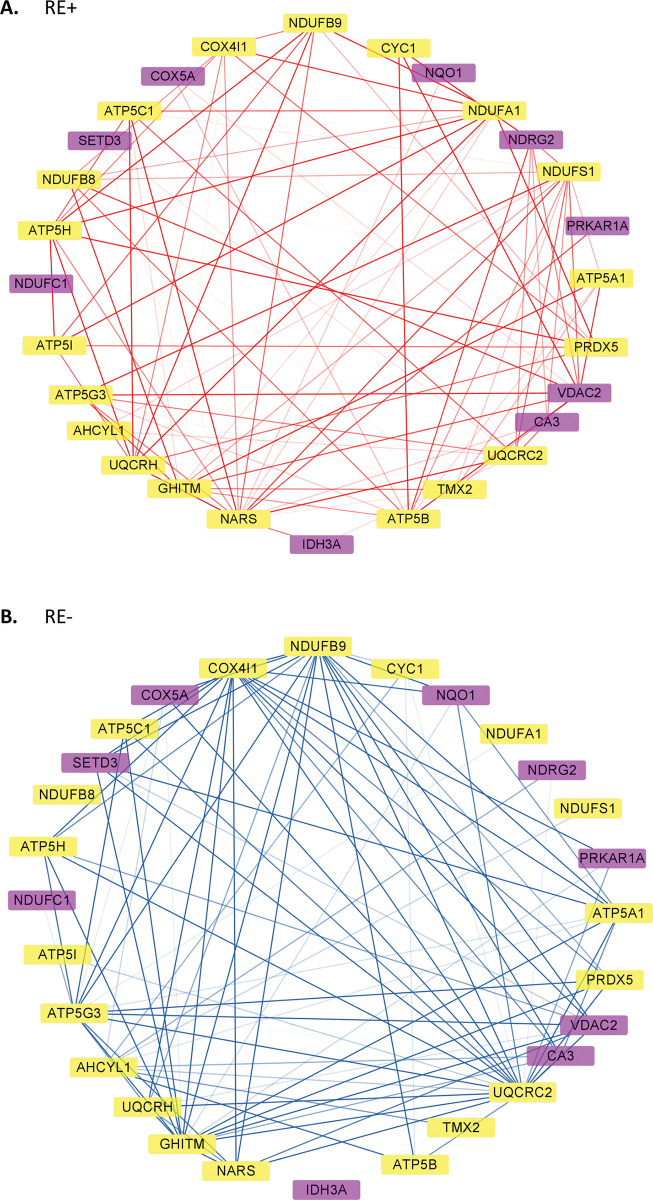
Results: There was a striking similarity between RE+ and RE- transcriptomes. There were 1,184 genes significantly upregulated and 1,018 genes significantly downregulated in both RE+ and RE- cases. Pathway analysis identified multiple biological processes significantly enriched in both-mitochondrial functions, energy-related processes, ER-nucleus signaling pathway, demethylation, and RNA splicing were negatively enriched, whereas small GTPase mediated signaling, actin-filament processes, extracellular matrix organization, stem cell differentiation, and neutrophil mediated immunity were positively enriched. The translational initiation process was downregulated in the RE+ transcriptomes. Gene co-expression analysis identified modules with relatively distinct biological processes enriched including downregulation of mitochondrial respiratory chain complex assembly. The majority of oxidative phosphorylation (OXPHOS) subunit genes, as well as their upstream regulator gene estrogen-related receptor alpha (ESRRA), encoding ERRα, were downregulated in both RE+ and RE- cases, and the expression level of ESRRA was correlated with that of OXPHOS subunit genes.

Conclusion: Meta-analysis increased the power of detecting differentially expressed genes. Integrating differential expression analysis with co-expression analysis helped understand the underlying molecular mechanisms. FECD RE+ and RE- transcriptomic profiles are much alike with the hallmark of downregulation of genes in pathways related to ERRα-mediated OXPHOS.


Conflict of interest statement

The authors have declared that no competing interests exist.

Figures

Fig 1
Fig 1. Fuchs’ endothelial corneal dystrophy (FECD) differential gene expression analysis by single studies and meta-analysis.
(A) and (B): Venn diagrams of differentially expressed genes (DEGs) between FECD patients with the TCF4 CTG18.1 expansion (RE+) versus controls and patients without the expansion (RE-) versus controls from single studies. (C)—(D): UpSet plots of DEGs in each single study and by meta-analysis. Arrows ↑ and ↓ represent up- and down- regulated genes, respectively. Datasets I, II, and III refer to GEO: GSE142538, SRA: PRJNA524323, and GEO: GSE112201, respectively. In a single study, genes with the false discovery rate (FDR) < 0.05 were considered as DEGs; in meta-analysis, genes with FDR < 0.05 and a consistent change direction among individual studies were regarded as DEGs.
Fig 2
Fig 2. Comparison of the differentially expressed genes (DEGs) in meta-analysis between the two Fuchs’ endothelial corneal dystrophy (FECD) types.
(A): Venn diagrams of DEGs of four categories of DEGs. RE+ and RE- refer to FECD patients with and without the TCF4 CTG18.1 expansion, respectively; arrows ↑ and ↓ represent up- and down-regulated genes, respectively. Genes with the false discovery rate (FDR) < 0.05 and a consistent change direction among individual studies were regarded as DEGs. (B) Venn diagrams of genes with a consistent change direction among individual studies, i.e., lifting the FDR criterion compared to (A). (C) The significantly enriched biological processes (FDR < 0.05) shared between RE+ and RE- transcriptomes by gene set enrichment analysis (GSEA). The Jaccard index of the enriched genes for each process between the two groups was shown in the parenthesis. (D) The significantly enriched biological processes (FDR < 0.05) by the shared genes between RE+ and RE- transcriptomes (those in the shaded area of B).
Fig 3
Fig 3. Differential alternative splicing events in Fuchs’ endothelial corneal dystrophy (FECD) patients.
Numbers of the 5 types of differential alternative splicing events were plotted in RE+ (A) and RE- (B) in patients compared with controls in each dataset (I, II, and III). Events with false discovery rate < 0.05 and > 5% changes in the inclusion levels were selected. “Up” and “Down” refer to upregulated and downregulated events compared to control, respectively. SE: skipped exon; A3SS: alternative 3’ splice site; A5SS: alternative 5’ splice site; MXE: mutually exclusive exons; RI: retained intron. The Sashimi plots (C) depicted an SE event in MBNL2 that was observed in all the 3 individual studies of RE+ vs control. The average inclusion level of each group (the percentages of the transcripts with the alternative exon) was labelled at the upper right corner. The y-axis indicated the average read density measured by fragments per kilobase of transcript per million (FPKM), and the average number of junction-spanning reads were labeled on the curves. Human hg38 genomic coordinates and relevant exons were drawn below.
Fig 4
Fig 4. Gene co-expression networks in Fuchs’ endothelial corneal dystrophy (FECD) patients with (RE+) and without (RE-) the TCF4 CTG18.1 expansion.
(A) and (B): Hierarchical clustering dendrograms based on genes with top 1000 median absolute deviations for RE+ and RE- transcriptomic profiles, respectively. Different color represents distinct modules. The top and bottom bars indicate modules before and after merging. (C): Correlations between RE+ and RE- modules after merging. The number of genes in each module were shown after the module name in the parenthesis. In each block, the number showed the number of intersected genes. * indicated module pairs with significant correlation (false discovery rate < 0.05). The color indicated the Jaccard index, and was left blank (value = 0) if the correlation was not significant.
Fig 5
Fig 5. Comparison of the red modules in Fuchs’ endothelial corneal dystrophy (FECD) patients with (RE+) and without (RE-) the TCF4 CTG18.1 expansion.
(A) and (B): The subnetworks of 28 shared hub genes in the red module for RE+ and RE- transcriptomic profiles, respectively. The hub genes were defined as those with top 25% intramodular connectivity. Deeper color of edges indicated higher connectivity values. Edges with top 25% weights in the subnetwork were shown. Color yellow: genes significantly downregulated in both RE+ and RE-; purple: genes significantly downregulated only in RE-. A permutation test indicated the network was moderately preserved (zsum = 2.14).
Fig 6
Fig 6. Dysregulation of mitochondrial pathways in Fuchs’ endothelial corneal dystrophy (FECD) patients with (RE+) and without (RE-) the TCF4 CTG18.1 expansion.
(A) The significantly enriched mitochondrial pathways shared between RE+ and RE- transcriptomes by gene set enrichment analysis (false discovery rate < 0.05). The Jaccard index of the enriched genes for each process between the two groups was shown in the parenthesis. The mean expression levels of genes in controls were plotted against that in RE+ (B) and RE- (C), respectively. The unit is log2(TPM+1), where TPM denotes transcripts per million. The red dots were oxidative phosphorylation OXPHOS subunit genes assayed (n = 88). Two genes—estrogen-related receptor alpha (ESRRA) and cytochrome c (CYCS)—were highlighted. The expression levels of ESRRA were correlated with the average expression levels of OXPHOS subunit genes (D) and with the expression levels of CYCS (E) in both RE+ (red) and RE- (black) patients.

References

    1. Elhalis H, Azizi B, Jurkunas UV. Fuchs endothelial corneal dystrophy. Ocul Surf. 2010;8:173–84. doi: 10.1016/s1542-0124(12)70232-x - DOI - PMC - PubMed
    1. Matthaei M, Hribek A, Clahsen T, Bachmann B, Cursiefen C, Jun AS. Fuchs Endothelial Corneal Dystrophy: Clinical, Genetic, Pathophysiologic, and Therapeutic Aspects. Annu Rev Vis Sci. 2019;5:151–75. doi: 10.1146/annurev-vision-091718-014852 - DOI - PubMed
    1. Krachmer JH, Purcell JJ Jr., Young CW, Bucher KD. Corneal endothelial dystrophy. A study of 64 families. Arch Ophthalmol. 1978;96:2036–9. doi: 10.1001/archopht.1978.03910060424004 - DOI - PubMed
    1. Aiello F, Gallo Afflitto G, Ceccarelli F, Cesareo M, Nucci C. Global Prevalence of Fuchs Endothelial Corneal Dystrophy (FECD) in Adult Population: A Systematic Review and Meta-Analysis. Journal of Ophthalmology. 2022;2022:3091695. doi: 10.1155/2022/3091695 - DOI - PMC - PubMed
    1. Gain P, Jullienne R, He ZG, Aldossary M, Acquart S, Cognasse F, et al.. Global Survey of Corneal Transplantation and Eye Banking. Jama Ophthalmol. 2016;134:167–73. doi: 10.1001/jamaophthalmol.2015.4776 - DOI - PubMed

Publication types

MeSH terms

Substances

Supplementary concepts