. 2023 Dec 15;382(6676):eadj3502.
doi: 10.1126/science.adj3502. Epub 2023 Dec 15.

Microbiome diversity protects against pathogens by nutrient blocking

Affiliations

Microbiome diversity protects against pathogens by nutrient blocking

Frances Spragge et al. Science. .

Abstract

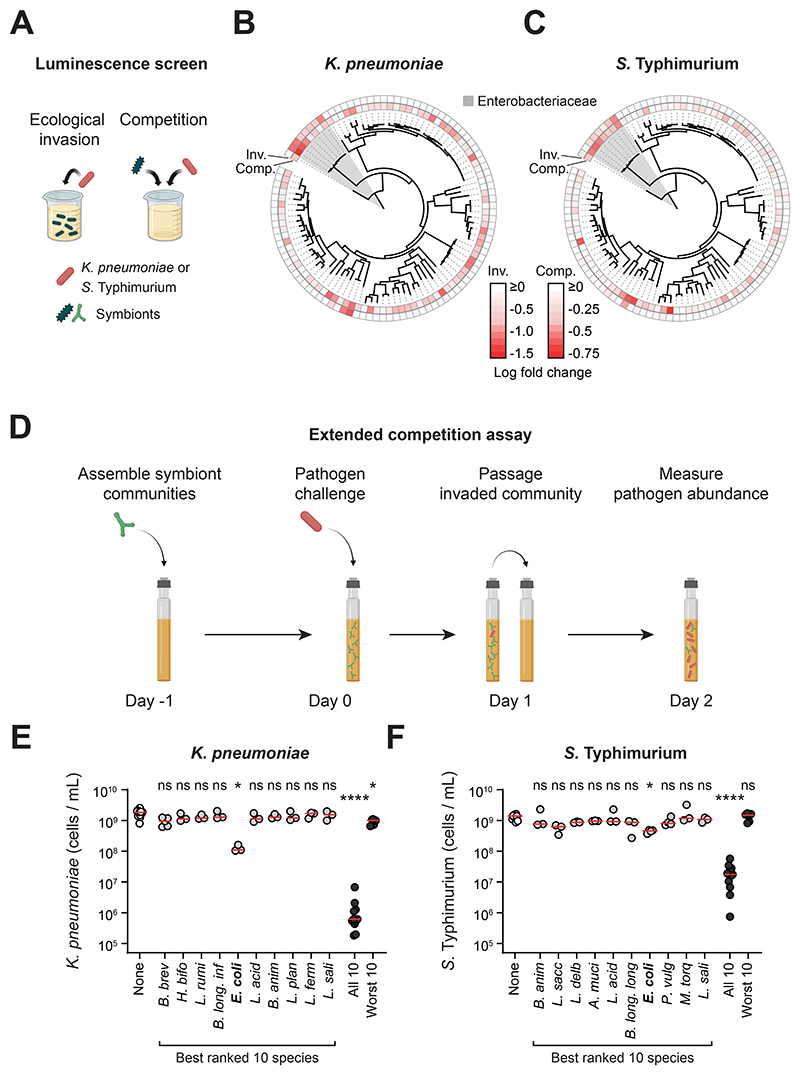
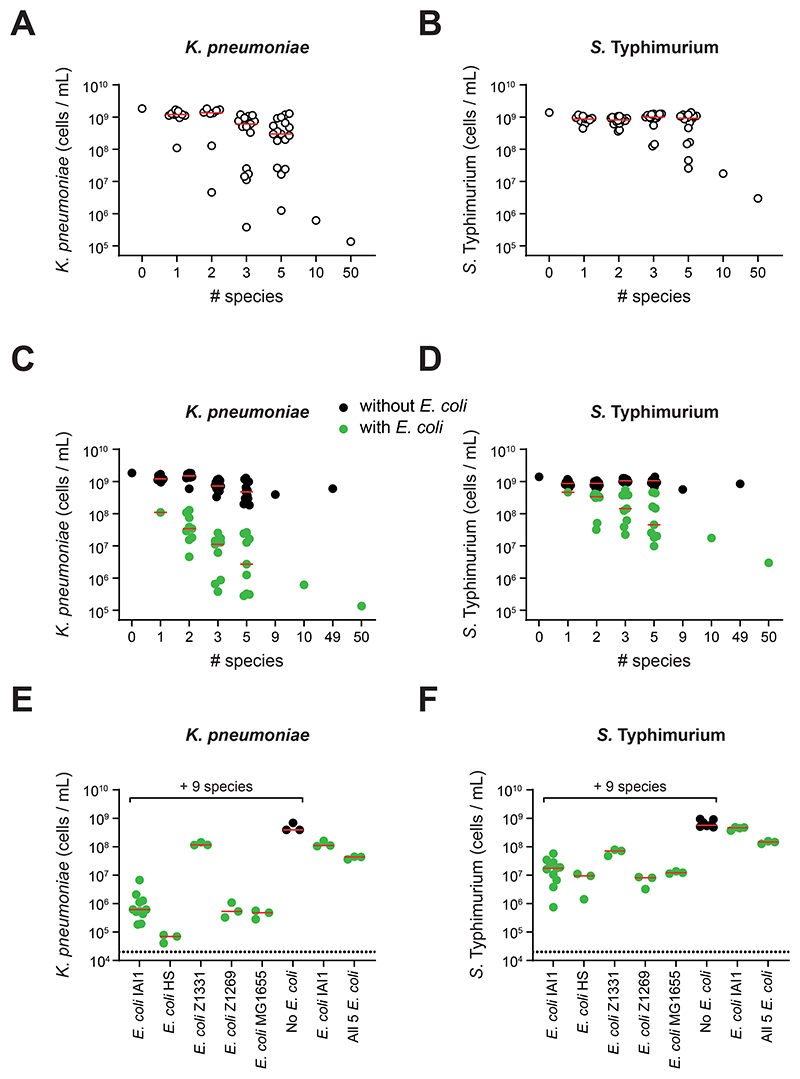
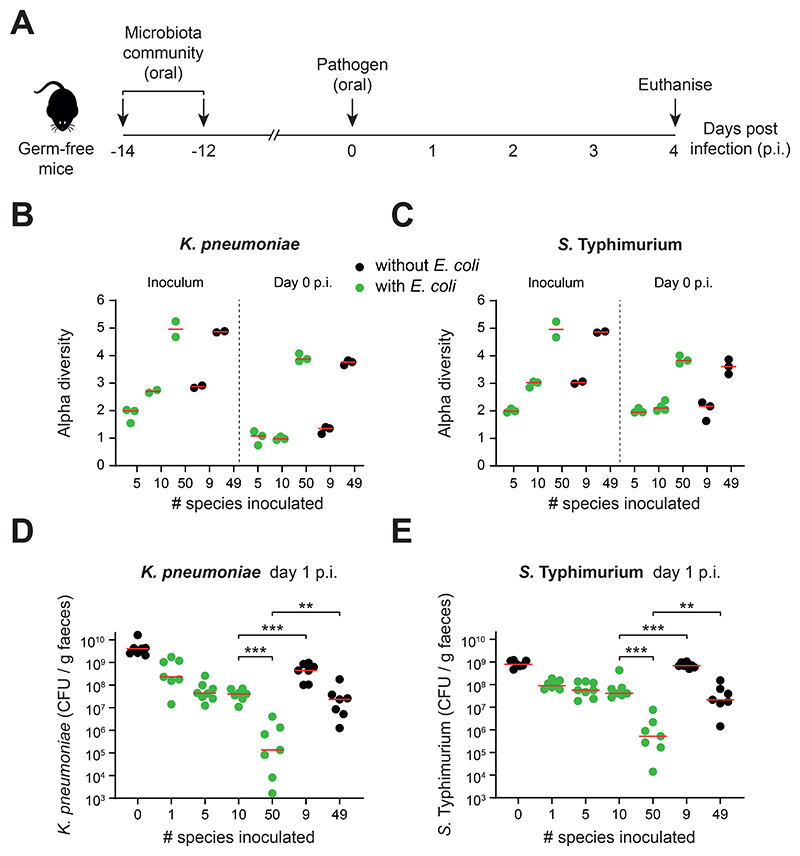
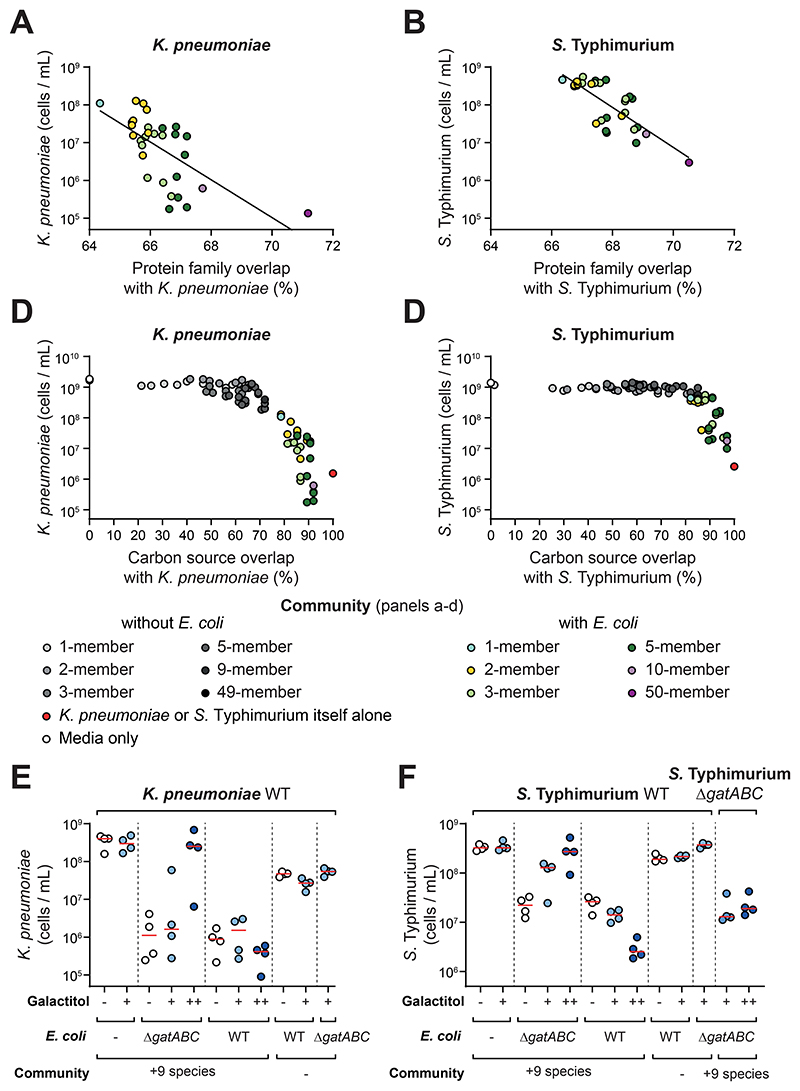
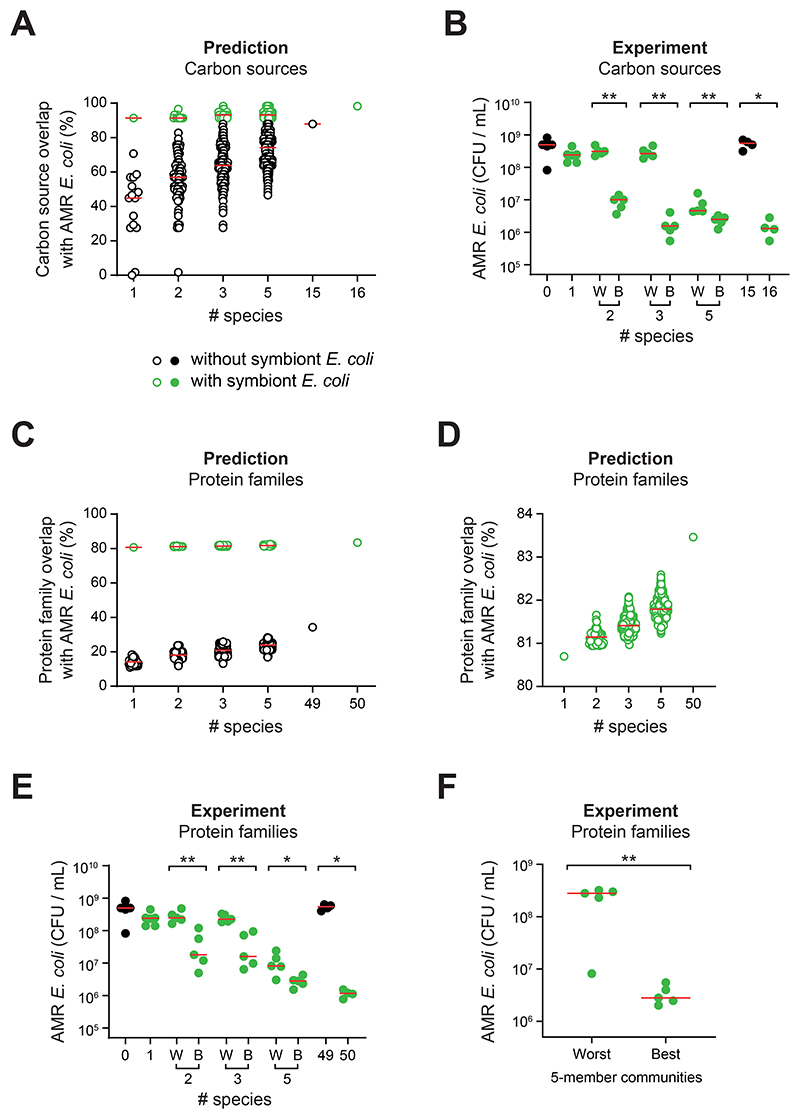
The human gut microbiome plays an important role in resisting colonization of the host by pathogens, but we lack the ability to predict which communities will be protective. We studied how human gut bacteria influence colonization of two major bacterial pathogens, both in vitro and in gnotobiotic mice. Whereas single species alone had negligible effects, colonization resistance greatly increased with community diversity. Moreover, this community-level resistance rested critically upon certain species being present. We explained these ecological patterns through the collective ability of resistant communities to consume nutrients that overlap with those used by the pathogen. Furthermore, we applied our findings to successfully predict communities that resist a novel target strain. Our work provides a reason why microbiome diversity is beneficial and suggests a route for the rational design of pathogen-resistant communities.


Conflict of interest statement

Competing interests: KRF holds equity in Postbiotics Plus Research.

Figures

Figure 1
Figure 1. Single strains do not provide robust colonization resistance, but a diverse community can, depending on its composition.
A) Overview of the luminescence co-culture assays. In the ecological invasion assay, K. pneumoniae or S. Typhimurium (red) was inoculated in co-culture with individual symbionts (different green symbols are used to represent the diversity of symbiont species screened; 19:1 ratio of symbiont to pathogen). In the competition assay, the symbionts were inoculated at an equal ratio to the pathogen to recapitulate competition between strains once the pathogen is established. In both assays, luminescence produced by the pathogen was used as a proxy for pathogen growth. Created with BioRender.com. B-C) Comparison of phylogenetic relatedness between symbionts, and the ability of each symbiont to compete with the pathogen (inv=ecological invasion assay; comp=competition assay). Data for K. pneumoniae shown in (B) and S. Typhimurium shown in (C). The family Enterobacteriaceae, which includes both K. pneumoniae and S. Typhimurium, is shaded in grey. Luminescence fold change values are presented in Fig. S1. Data presented as the median luminescence log fold change of N=3-10 independent experiments (biological replicates). Strains with the most negative (most red) values inhibited growth of the pathogen most strongly. D) Overview of the extended competition assay. Communities (or individual strains; green) of symbionts are pre-grown in anaerobic rich media before addition of the pathogen (red). The community is passaged after 24h of growth, followed by another 24h of growth before quantification with flow cytometry. Created with BioRender.com. E-F) The extended competition assay was performed for each individual species identified in the best ranked 10 species, as well as for combinations of 10 species (both the best- and worst-ranked 10 species; Fig. S1). Individual biological replicates from N=3-15 independent experiments are shown. Red lines indicate the median. A Kruskal-Wallis test with Dunn’s multiple test correction compares each group to the no-symbionts control (p>0.05=ns; p<0.05=*; p<0.0001=****). Data for K. pneumoniae shown in (E) and S. Typhimurium shown in (F). See Table S1 for species name abbreviations.
Figure 2
Figure 2. Ecological diversity and key members are needed for efficient colonization resistance in vitro.
A-D) Extended competition assay on communities made up of an increasing number of species. Each data point represents the median pathogen cells/mL value on day 2 of the extended competition for a community (n=3-15 biological replicates from independent experiments for each community; up to 17 communities for each group). Communities with size <= 10 species were randomly selected from the 10 best ranked species for each pathogen. Community identities are shown in Table S4-5. Data for K. pneumoniae shown in (A) and (C), and for S. Typhimurium shown in (B) and (D). Red lines indicate the median value of communities at a given diversity level. In C-D), data from A-B) are replotted along with additional communities that always contained E. coli but were otherwise randomly selected. Communities without E. coli are depicted in black; communities with E. coli in green. Separate red median lines shown for communities with and without E. coli. A linear regression is performed on log-log transformed data in Fig. S2a-b, which shows that the association between diversity and colonization observed is statistically significant, and that this effect is greater for communities with E. coli than those without (F tests, p≤0.0001). E-F) Extended competition assay testing E. coli strains substituted into the best ranked 10 species community. Data for K. pneumoniae shown (E) and S. Typhimurium in (F). Red lines indicate median values. Each data point represents a biological replicate each from independent experiments (N=3-11).
Figure 3
Figure 3. Ecological diversity and key members are needed for efficient colonization resistance in vivo.
A) Overview of gnotobiotic mouse experiments. Symbiont communities (or E. coli alone) were given to germ-free mice by oral gavage twice (two days apart). 12 days later, the mice were challenged with K. pneumoniae or S. Typhimurium by oral gavage. Feces were collected from mice daily before being euthanised on day 4 post infection (p.i.). B-C) Alpha diversity measured by Shannon index of symbiont communities. Metagenomic sequencing was performed on the inoculum and fecal samples at day 0 (when the pathogen is introduced) and used to calculate diversity. Data for K. pneumoniae shown in (B) and S. Typhimurium in (C). Biological replicates from a representative mouse from each cage are shown (N=2-4; at least two independent experiments). D-E) Pathogen abundances in the feces of gnotobiotic mice colonized with communities of increasing diversity (mice containing communities with E. coli shown in green; mice containing communities without E. coli shown in black; N=7-8 biological replicates of mice per group in cages of 2-3 mice; 2-3 independent experiments). Red lines indicate the medians. Two-tailed Mann-Whitney tests are used to compare the indicated groups (p<0.01=**; p<0.001=***). Data for K. pneumoniae shown in (D) and S. Typhimurium shown in (E). Metagenomic analysis of strain diversity and relative abundance is shown in Fig. S5. Pathogen abundance data from days 1-4 p.i. is shown in Fig. S6. Community compositions are shown in Table S6.
Figure 4
Figure 4. Nutrient overlap can explain the role of ecological diversity and the effect of E. coli in colonization resistance.
A-B) Protein family overlap is compared to the median pathogen abundance values for each community containing E. coli from Fig. 2C-D. Diversity is visualised by a color gradient. Data for K. pneumoniae shown in (A) and Salmonella shown in (B). A line of best fit is shown from a linear regression on log transformed data: R2 = 0.4255 for K. pneumoniae; R2 = 0.603 for S. Typhimurium; both slopes are significantly different from 0 using an F-test (p<0.0001). Data for communities without E. coli is presented in Fig. S9E-F. C-D. Overlap in carbon source utilisation plotted against the median pathogen abundance measurements from experimental communities in Fig. 2C-D. Community carbon source overlap is calculated using an additive approach from carbon source overlap of individual strains by measurement on AN Biolog Microplates (Fig. S10). Diversity is visualised by a gradient of color (for E. coli-containing communities) or greyscale (for communities without E. coli). A control with the isogenic pathogen itself (100% overlap) is plotted in red. Data for K. pneumoniae in (C) and S. Typhimurium shown in (D). E-F) A private nutrient, galactitol, that could only be used by the WT E. coli strain and the pathogens but not by the other symbionts nor an E. coli ΔgatABC mutant, was supplemented to the media and the extended competition assay performed as before. In all treatments, pathogen abundance was measured by flow cytometry after 48h of growth post-passage instead of the usual 24h. This change did not influence the control experiments without galactitol, but proved informative because we found the growth impacts of galactitol were relatively slow. Results for K. pneumoniae shown in (E) and S. Typhimurium in (F). N=3-4 biological replicates from independent experiments per treatment. Horizontal red lines show the median of the replicates. Light blue circles show results with 0.1% galactitol supplementation (+ symbol), dark blue circles show results with 1% galactitol supplementation (++ symbol). White circles (control) show results with no nutrient supplementation (- symbol). 9 species refers to the 9 additional species in the 10 best-performing species for each respective pathogen (- symbol refers to when E. coli is added alone). In (D), a ΔgatABC mutant of S. Typhimurium was used in addition to the WT pathogen to verify the dependency of colonization on a private nutrient.
Figure 5
Figure 5. Nutrient blocking predicts community colonization resistance.
A) In silico prediction of carbon source overlap with the AMR E. coli strain for all possible combinations of symbiont communities at the indicated diversity levels. Each circle represents a different community. Communities containing the symbiont E. coli IAI1 are shown in green and communities without E. coli IAI1 are shown in black (predictions as hollow circles; experimental data as solid circles). Predicted carbon source overlap calculated using an additive approach from carbon source use of individual strains measured using AN Biolog MicroPlates (Fig. S10, S13). B) Experimental test of in silico predictions in (A). The two E. coli IAI1-containing communities predicted to have the best (B) and worst (W) carbon source overlap were picked at each diversity level and competed against AMR E. coli in the extended competition assay. A two-tailed Mann-Whitney U test was performed on community pairs (p>0.05=ns; p<0.05=*; p<0.01=**) at the 2-, 3- and 5-strain diversity levels. Red horizontal bars depict the median of each community tested. N=4-5 biological replicates from independent experiments for each community. C-D) In silico prediction of protein family overlap with the AMR E. coli strain for a random subset (n=59,043) of all possible symbiont communities at diversity levels 2-, 3-, and 5-strains, as well as all individual strains and the 49- and 50-species communities. Each circle represents a different community. Communities are selected from the strains comprising the 50-member community. Communities containing E. coli IAI1 are shown in green and communities without E. coli IAI1 are shown in black. D) Only the E. coli-containing communities are plotted to better visualise variation in protein family overlap. E) Experimental test of in silico predictions based on protein cluster overlap in (C-D). The two E. coli IAI1-containing communities predicted to have the best (B) and worst (W) protein family overlap were picked at each diversity level (randomly selected, for cases where there were multiple communities with the same overlap), and competed against AMR E. coli in the extended competition assay. Red horizontal bars depict the median of each community tested. N=5 biological replicates from independent experiments for each community. A two-tailed Mann-Whitney U test was performed on community pairs (p>0.05=ns; p<0.05=*; p<0.01=**) at the 2-, 3- and 5-strain diversity levels. F) Experimental test of the predicted 5 best and 5 worst communities at the 5-strain diversity level, based on protein family overlap with AMR E. coli. Each symbol represents the median of N=5 biological replicates from independent experiments per community. Red horizontal bars depict the median of the best and the worst predicted communities. A two-tailed Mann-Whitney U test was performed (p<0.01=**). Community identities for (B, E-F) are shown in Table S7.

References

    1. Sorbara MT, Pamer EG. Interbacterial mechanisms of colonization resistance and the strategies pathogens use to overcome them. Mucosal Immunol. 2019;12:1–9. doi: 10.1038/s41385-018-0053-0. - DOI - PMC - PubMed
    1. Jacobson A, et al. A Gut Commensal-Produced Metabolite Mediates Colonization Resistance to Salmonella Infection. Cell Host Microbe. 2018;24:296–307.:e297. doi: 10.1016/j.chom.2018.07.002. - DOI - PMC - PubMed
    1. Velazquez EM, et al. Endogenous Enterobacteriaceae underlie variation in susceptibility to Salmonella infection. Nat Microbiol. 2019;4:1057–1064. doi: 10.1038/s41564-019-0407-8. - DOI - PMC - PubMed
    1. Wotzka SY, et al. Escherichia coli limits Salmonella Typhimurium infections after diet shifts and fat-mediated microbiota perturbation in mice. Nat Microbiol. 2019;4:2164–2174. doi: 10.1038/s41564-019-0568-5. - DOI - PMC - PubMed
    1. Sequeira RP, McDonald JAK, Marchesi JR, Clarke TB. Commensal Bacteroidetes protect against Klebsiella pneumoniae colonization and transmission through IL-36 signalling. Nat Microbiol. 2020;5:304–313. doi: 10.1038/s41564-019-0640-1. - DOI - PMC - PubMed

MeSH terms

LinkOut - more resources