. 2024 Mar 14;143(11):953-966.
doi: 10.1182/blood.2023022851.

Identification and surveillance of rare relapse-initiating stem cells during complete remission after transplantation

Affiliations

Identification and surveillance of rare relapse-initiating stem cells during complete remission after transplantation

Marios Dimitriou et al. Blood. .

Erratum in

Abstract

Relapse after complete remission (CR) remains the main cause of mortality after allogeneic stem cell transplantation for hematological malignancies and, therefore, improved biomarkers for early prediction of relapse remains a critical goal toward development and assessment of preemptive relapse treatment. Because the significance of cancer stem cells as a source of relapses remains unclear, we investigated whether mutational screening for persistence of rare cancer stem cells would enhance measurable residual disease (MRD) and early relapse prediction after transplantation. In a retrospective study of patients who relapsed and patients who achieved continuous-CR with myelodysplastic syndromes and related myeloid malignancies, combined flow cytometric cell sorting and mutational screening for persistence of rare relapse-initiating stem cells was performed in the bone marrow at multiple CR time points after transplantation. In 25 CR samples from 15 patients that later relapsed, only 9 samples were MRD-positive in mononuclear cells (MNCs) whereas flowcytometric-sorted hematopoietic stem and progenitor cells (HSPCs) were MRD-positive in all samples, and always with a higher variant allele frequency than in MNCs (mean, 97-fold). MRD-positivity in HSPCs preceded MNCs in multiple sequential samples, in some cases preceding relapse by >2 years. In contrast, in 13 patients in long-term continuous-CR, HSPCs remained MRD-negative. Enhanced MRD sensitivity was also observed in total CD34+ cells, but HSPCs were always more clonally involved (mean, 8-fold). In conclusion, identification of relapse-initiating cancer stem cells and mutational MRD screening for their persistence consistently enhances MRD sensitivity and earlier prediction of relapse after allogeneic stem cell transplantation.


Conflict of interest statement

Conflict-of-interest disclosure: The authors declare no competing financial interests.

Figures

None
Graphical abstract
Figure 1.
Figure 1.
Recurrent genetic lesions in patients who received allo-HSCT. (A) Mutational map of recurrent oncogenic mutations and truncating changes used for clonal tracking as well as chromosomal abnormalities (see “Methods” and supplemental Tables 1 and 10) identified before transplantation and/or at relapse in patients with MDS and related malignancies undergoing allo-HSCT. Hatched boxes indicate new genetic lesions identified at relapse and “X” indicates patients with biallelic TP53 mutations before transplantation based on either >60% VAF or loss of chromosome 17 at diagnosis (see supplemental Table 1 and source data file 1). “Months after Allo-HSCT” reflects the time of clinical relapse for relapse group and last observation time point for continuous-CR group. (B) ddPCR data in BM MNCs for the mutation within each patient with the highest VAF (%) at indicated days before allo-HSCT (last available BM sample before conditioning for allo-HSCT) in patients who relapsed (n = 14; all patients with available BM MNCs) 4 to 33 months after allo-HSCT compared with patients who remained in continuous CR (n = 10; all patients with available BM MNCs) for ≥66 months after allo-HSCT. (C) Violin plot of VAF for mutations shown in panel B in BM MNCs for all patients in continuous-CR and patients who relapsed before allo-HSCT. Dashed lines indicate the median and dotted lines indicate the quartiles. No statistical difference (P = .98, the Mann Whitney U test) was found between relapsed and continuous-CR groups. Pre–allo-HSCT samples correspond to pre–allo-HSCT samples in raw data source data file 1. CMML, chronic myelomonocytic leukemia; Del(5q), MDS with isolated del(5q); MDS-EB, MDS with excess blasts; MPN-u, myeloproliferative neoplasm unclassifiable; MDS-MLD, MDS with multilineage dysplasia; MDS-RS-MLD, MDS with multilineage dysplasia and ring sideroblasts; WHO, World Health Organization 2016 classification.
Figure 2.
Figure 2.
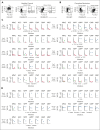
Clonal involvement of stem and progenitor cell compartments in patients with MDS in CR after allo-HSCT. (A-B) Representative FACS profiles of BM cells from an aged-matched healthy control (A) and from a patient during CR who had later relapsed (B; patient 8). Numbers in left panels indicate mean (± SEM) percentages of BM MNCs; in the second and third columns, percentages of total CD34+ cells for 12 age-matched normal controls (A) and 15 patients who relapsed (B). Also indicated are the quadrants from which investigated HSPC populations were sorted for mutational MRD analysis (for individual FACS profiles at diagnosis, CR, and relapse for all patients who experienced relapse, see supplemental Figure 3). (C-D) ddPCR screening for patient-specific mutations identified in BM MNCs before transplantation and still present at relapse was used to assess clonal involvement in remission BM MNCs and purified HSPCs. For each patient the number of months (mth) before relapse are shown, and in parenthesis months after transplantation. (C) Ten patients in whom MRD-positivity of HSPCs preceded MRD-positivity of BM MNCs and (D) 5 additional patients in whom MRD-positivity of distinct HSPCs was higher than MRD-positivity of BM MNC. For all patients (C-D), with the exception of patient 7, the earliest time point after allo-HSCT at which MNCs and/or HSPCs were found to be confidently MRD-positive, is shown. For patient 1, in whom the dominating diagnostic and relapse clones were mutually exclusive (see supplemental Figure 2), data are shown for the earliest time point after allo-HSCT when both the dominant diagnostic (D) and dominant relapse (R) mutation was detected in HSPCs. Error bars represent the 95% confidence interval of VAFs calculated according to Poisson distribution, as further specified in “Methods.” Blue color indicates highly confident clonal involvement, red indicates negative, and green indicates inconclusive data based on the LOD established in normal BM samples for each ddPCR probe (supplemental Table 6) as well as the number of cells analyzed as described in supplemental Methods. ∗Analysis negative for clonal involvement (red) but based on analysis of <50 purified cells. Hashtag (#): mutation of “unknown” significance as specified in supplemental Methods. Raw data including cell numbers analyzed can be found in source data file 1. HSC, hematopoietic stem cell (LINCD34+CD38low/−CD90+CD45RA); MPP, multipotent progenitor (LINCD34+CD38low/−CD90CD45RA); LMPP, lymphoid-primed MPP (LINCD34+CD38low/−CD90CD45RA+); CMP, common myeloid progenitor (LINCD34+CD38+CD90CD123+CD45RA); GMP, granulocyte-monocyte progenitor (LINCD34+CD38+CD90CD123+CD45RA+); and MEP, megakaryocyte-erythroid progenitor (LINCD34+CD38+CD90CD123CD45RA).
Figure 3.
Figure 3.
Early prediction of relapse through assessment of clonal involvement of distinct stem and progenitor cells. (A) Number of months by which mutational MRD-positivity in BM MNCs and HSPCs preceded diagnosis of relapse. Individual values (circles) for all patients in relapse and mean (± SEM) are shown. The paired MNC and HSPC sample for each patient are connected by gray dashed lines. P value; the Wilcoxon paired test. (B) Fold changes in %VAF in HSPCs relative to BM MNCs in patients who later relapsed, for all remission BM samples in which MNCs and/or HSPCs were MRD-positive (15 patients, 25 remission time points indicated by blue circles). VAF of mutations with the highest VAF within the highest clonally involved HSPC population was compared with the VAF of MNCs in the same BM remission sample. For mutations in which MNC VAFs were below the LOD, the LOD value was used instead of the actual VAF. The paired MNC and HSPC samples for each patient are connected by gray dashed lines. Mean (± SEM) values are also shown. P value; a binomial test. (C) Kinetic assessment of MRD in purified HSPCs after allo-HSCT, as assessed by ddPCR analysis for patient-specific mutations in patients in whom MRD positivity of HSPCs preceded MRD positivity of BM MNCs for at least 2 consecutive remission time points. Arrowheads indicate time of diagnosis of clinical relapse from the time of transplantation (0), and the length of the arrows indicates months from detection of molecular MRD to time of clinical diagnosis of relapse. MNC MRD+; at least 1 mutation confidently detected in BM MNCs by ddPCR; MNC MRD, no mutation confidently detected in BM MNCs by ddPCR; HSPC MRD+, at least 1 mutation confidently detected in ≥1 stem and progenitor cell populations by ddPCR; HSPC MRD, no mutation confidently detected by ddPCR in any investigated stem and progenitor cell populations (see “Methods” and supplemental Methods). (D) ddPCR-based VAFs for patient-specific mutations in BM MNCs and purified HSPCs in consecutive remission samples for patients who later relapsed. Error bars represent the 95% confidence interval of VAFs calculated according to Poisson distribution as further specified in “Methods.” Blue color indicates highly confident clonal involvement, red indicates negative, and green inconclusive, as described in supplemental Methods. Only HSPC populations with highly confident clonal involvement for at least 1 time point are shown. Raw data can be found in source data file 1.
Figure 4.
Figure 4.
Lack of evidence for clonal involvement of HSPCs in patients in long-term continuous-CR after HSCT. (A) Kinetic assessment of MRD by ddPCR for patient-specific mutations identified at diagnosis, in BM MNCs and HSPCs in patients in continuous-CR (≥66 months); diamond-shaped symbol indicates time point of last clinical assessment without evidence of relapse after allo-HSCT, from time of transplantation (0). For complete ddPCR data for each patient and time point see supplemental Figure 6. MNC MRD+, at least 1 mutation confidently detected in BM MNCs by ddPCR; MNC MRD; no mutation confidently detected in BM MNCs by ddPCR; HSPC MRD+, at least 1 mutation confidently detected in ≥1 stem and progenitor cell populations by ddPCR; HSPC MRD, no mutation confidently detected by ddPCR in any investigated stem and progenitor cell populations (see “Methods”). (B) ddPCR-based VAF analysis of CR samples from 4 patients who relapsed for patient-specific SNPs (left; see supplemental Methods for selection of SNPs) as compared with mutational VAF (right) in BM MNCs, HSCs, and the most clonally involved HSPC population (in patient 5, HSCs were most clonally involved). (C) Patient-specific SNP analysis in all HSPC populations from CR samples from 6 patients in continuous-CR, at the earliest and latest available time point after allo-HSCT at which remission BM was analyzed, and for which mutational MRD was negative in all cell populations and cases. Error bars represent the 95% confidence interval of VAFs calculated according to Poisson distribution as further specified in “Methods.” Blue and red indicate confidently positive and negative data, respectively, and green inconclusive, as defined in the supplemental Methods. Raw data can be found in source data file 1 (mutational HSPC ddPCR) and source data file 3 (SNP ddPCR).
Figure 5.
Figure 5.
FCM–based leukemic stem cell and aberrant antigen expression analysis. (A) FCM profiles of CD34+-gated BM cells showing expression of CD38 (CD38-APC) vs a combination of cell surface antigens (CD7, CD11b, CD22, CD56, CD366, and CD371; LSC-PE) reported as aberrantly expressed on CD34+CD38low/− LSCs. LSC-PE expression was, as indicated, investigated in a gate set strictly on CD38 cells (lower CD38 gate based on erythrocytes that are CD38), as well as on the 10% lowest CD38-expressing CD34+ cells for samples in which <10% of CD34+ cells were CD38. Representative data from 2 healthy donors (left: young, aged <40 years; right: old, aged >70 years), 2 patients with high-risk MDS/AML, and pre– and post–allo-HSCT samples from 4 patients (also analyzed by ddPCR; see Figure 4A) achieving continuous-CR after allo-HSCT. Percentages shown in FCM plots for the 2 patients with high-risk MDS/AML (left, patient 32; right, patient 33), and the continous-CR pre–allo-HSCT samples indicate the VAF for the most clonal recurrent mutation. For all continuous-CR posttransplantation samples the mutational VAF was below detection level. Percentages for the representative healthy control BM samples show CD34+CD38LSC-PE+ cells out of total cells. (B) Mean (± SEM) percentage CD34+CD38 LSC-PE+ cells (left, red) and CD34+CD38low/−LSC-PE+ cells (right, green) of total CD45+ BM cells. (C) Mean (± SEM) percentage LSC-PE+ cells in CD34+CD38 (left, red) and CD34+CD38low/− (right, green) gates, of total CD34+CD38/CD34+CD38low/− BM cells. Equal symbols for the patients who achieved continuous-CR indicate sequential samples taken before and after allo-HSCT for the same patient. “0” indicates a sample showing no LSC+ events within the set gates. For 2 patients with high-risk MDS/AML, >10% of the CD34+ cells were CD38− and were therefore not analyzed based on a separate CD38low/− gate (red symbols in right B and C panels). (D) The same BM samples analyzed in panels A to C were also analyzed for other aberrant antigen expression patterns reported in myeloid malignancies. Each dot represents an individual BM sample. Results are presented as mean (± SEM) percentages of total CD45+ BM cells coexpressing indicated (populations 1-8) combinations of antigens. Equal symbols for the patients in continuous-CR indicate sequential samples taken before and after allo-HSCT for the same patient. Blast counts for the patients with high-risk MDS/AML (patients 30-33) were 62.5%, 10%, 43.5%, and 11%, respectively (supplemental Table 1).
Figure 6.
Figure 6.
Mutational MRD screening of BM CD34+ cells. (A-D) ddPCR-based screening for clonal involvement of patient-specific mutations (for which HSPC VAF was >1%) in CD34-enriched cells from remission BM. (A) Five patients in whom BM MNCs were MRD-negative but purified HSPCs MRD-positive and (B) 5 patients in whom BM MNCs were MRD-positive but at lower level than in HSPCs. Blue and red indicate confidently positive and negative data, respectively, and green inconclusive as defined in the supplemental Methods. The dashed lines in CD34+ graphs (A-B) represent the predicted VAF (of the mutation with highest VAF) in CD34+ cells based on calculations from FCM and VAF data from HSPCs as described in supplemental Table 8. (C) VAF (%) for mutation with the highest VAF at indicated time points for all patients in panels A-B. The paired BM MNC, CD34+ cells and HSPC for each patient (blue circles) are connected by gray dashed lines. Mean (± SEM) values are also shown. P values were calculated using the Wilcoxon paired test. (D) Fold changes in VAF in BM CD34+ cells and HSPCs relative to MNCs (for all patients in panels A-B), in each patient using the mutation with the highest VAF. For mutations with VAFs below the LOD, the LOD value was used instead of the actual VAF. The VAFs for paired BM MNC, CD34+ cells and HSPCs for each patient (blue circles) are connected by gray dashed lines. Mean (± SEM) values are also shown. P values were calculated using a binomial test. Raw data can be found in source data file 1 (mutational HSPC ddPCR) and source data file 4 (mutational ddPCR in CD34+ fraction).

Comment in

References

    1. Adès L, Itzykson R, Fenaux P. Myelodysplastic syndromes. Lancet. 2014;383(9936):2239–2252. - PubMed
    1. Tanaka TN, Bejar R. MDS overlap disorders and diagnostic boundaries. Blood. 2019;133(10):1086–1095. - PubMed
    1. de Witte T, Bowen D, Robin M, et al. Allogeneic hematopoietic stem cell transplantation for MDS and CMML: recommendations from an international expert panel. Blood. 2017;129(13):1753–1762. - PMC - PubMed
    1. Shaffer BC, Ahn KW, Hu ZH, et al. Scoring system prognostic of outcome in patients undergoing allogeneic hematopoietic cell transplantation for myelodysplastic syndrome. J Clin Oncol. 2016;34(16):1864–1871. - PMC - PubMed
    1. Lindsley RC, Saber W, Mar BG, et al. Prognostic mutations in myelodysplastic syndrome after stem-cell transplantation. N Engl J Med. 2017;376(6):536–547. - PMC - PubMed

Publication types

MeSH terms