Comparative Study
. 2024 Feb;626(7998):385-391.
doi: 10.1038/s41586-023-06951-3. Epub 2023 Dec 14.

Mucosal boosting enhances vaccine protection against SARS-CoV-2 in macaques

Affiliations
Comparative Study

Mucosal boosting enhances vaccine protection against SARS-CoV-2 in macaques

Katherine McMahan et al. Nature. 2024 Feb.

Abstract

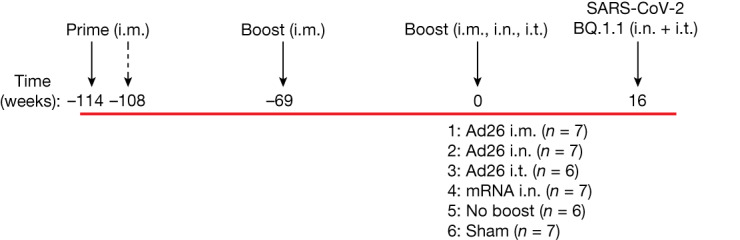
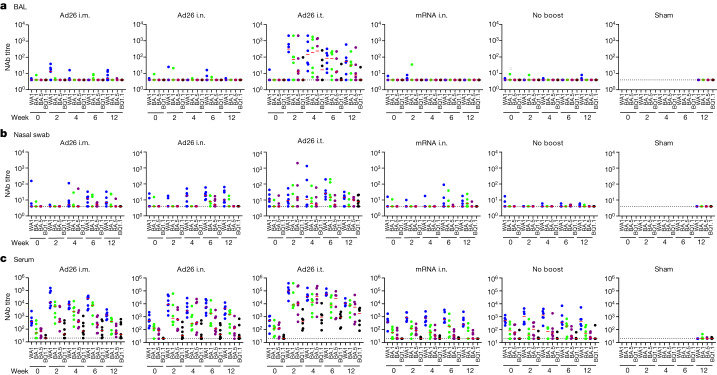
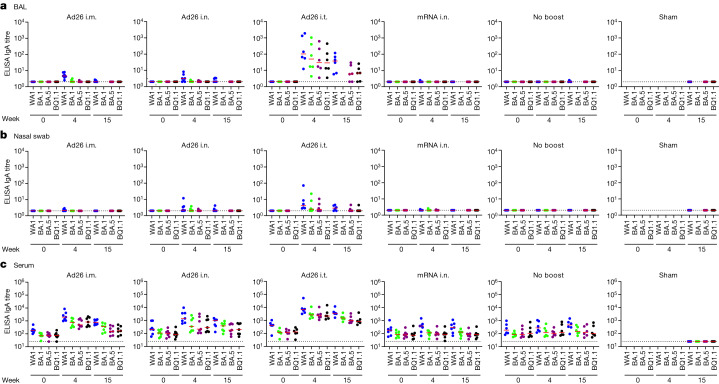
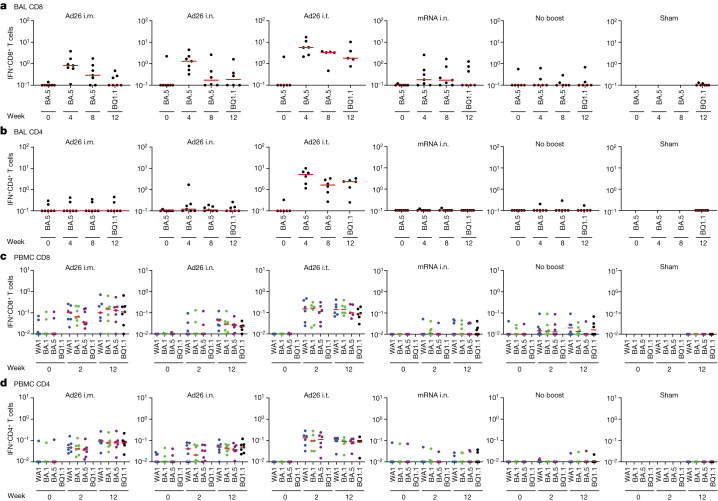
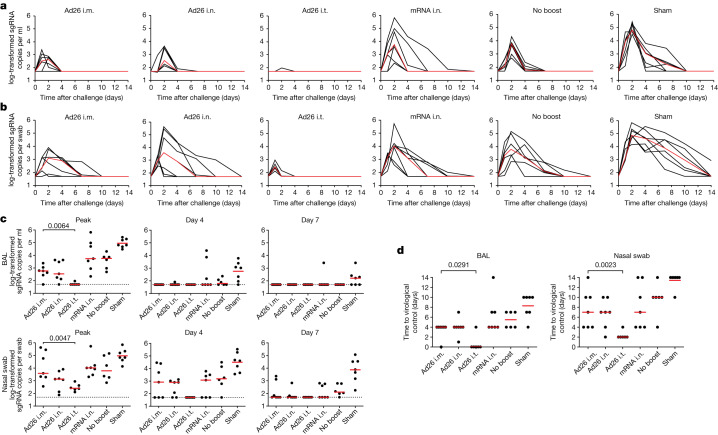
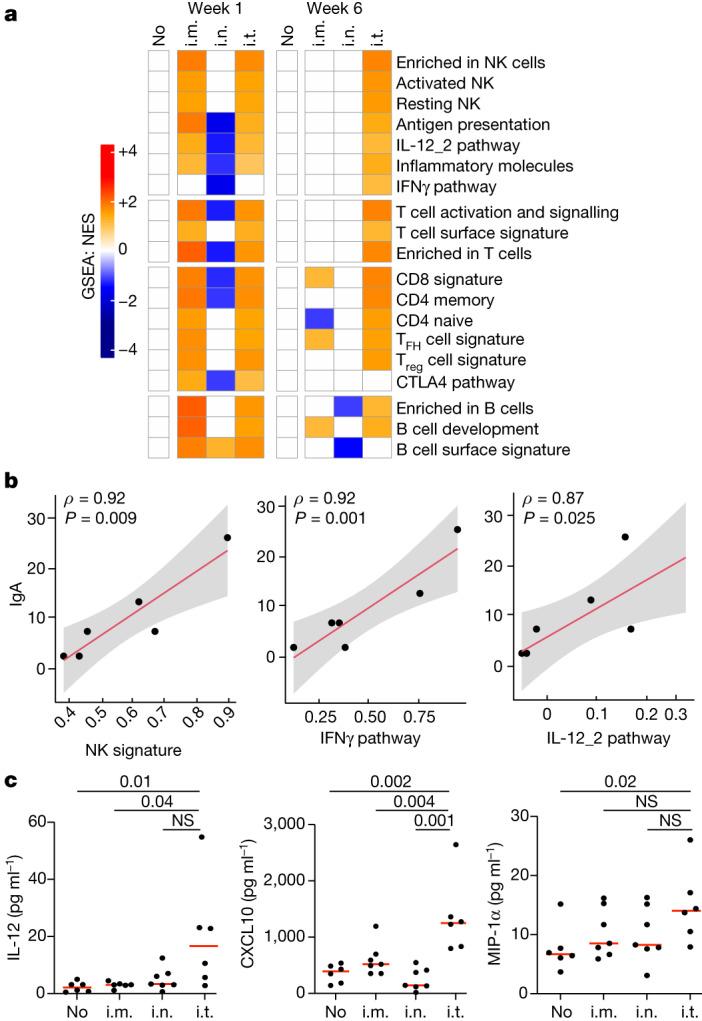
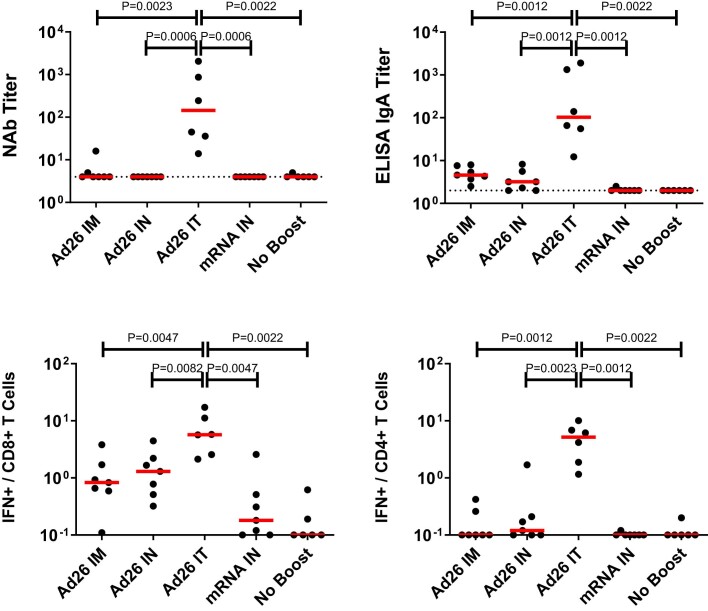
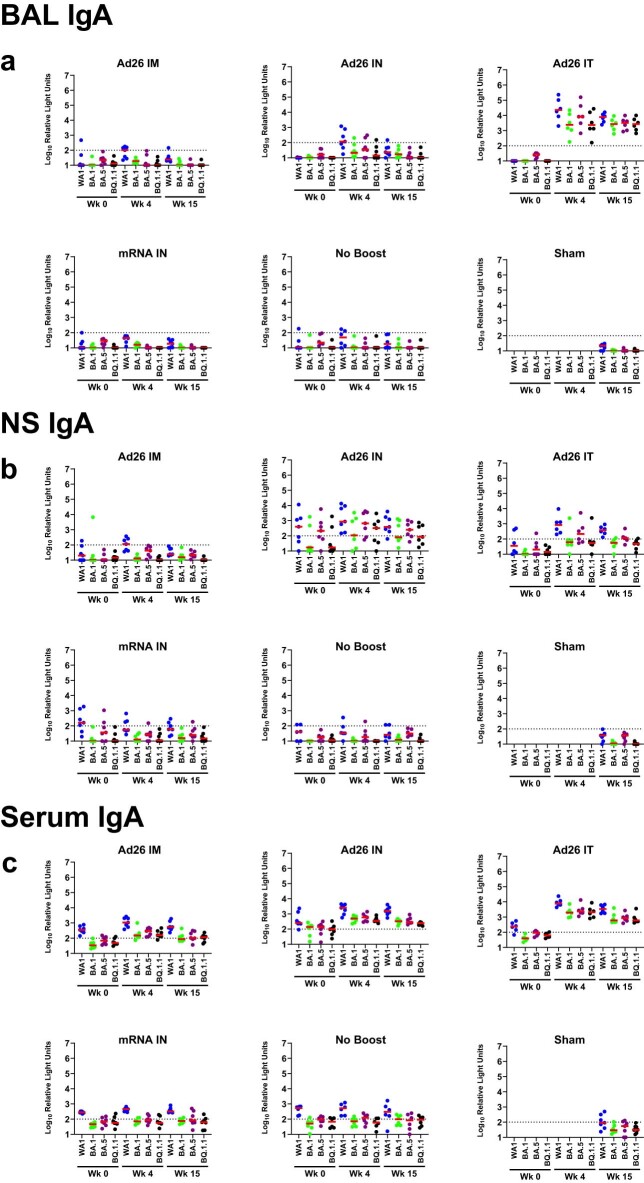
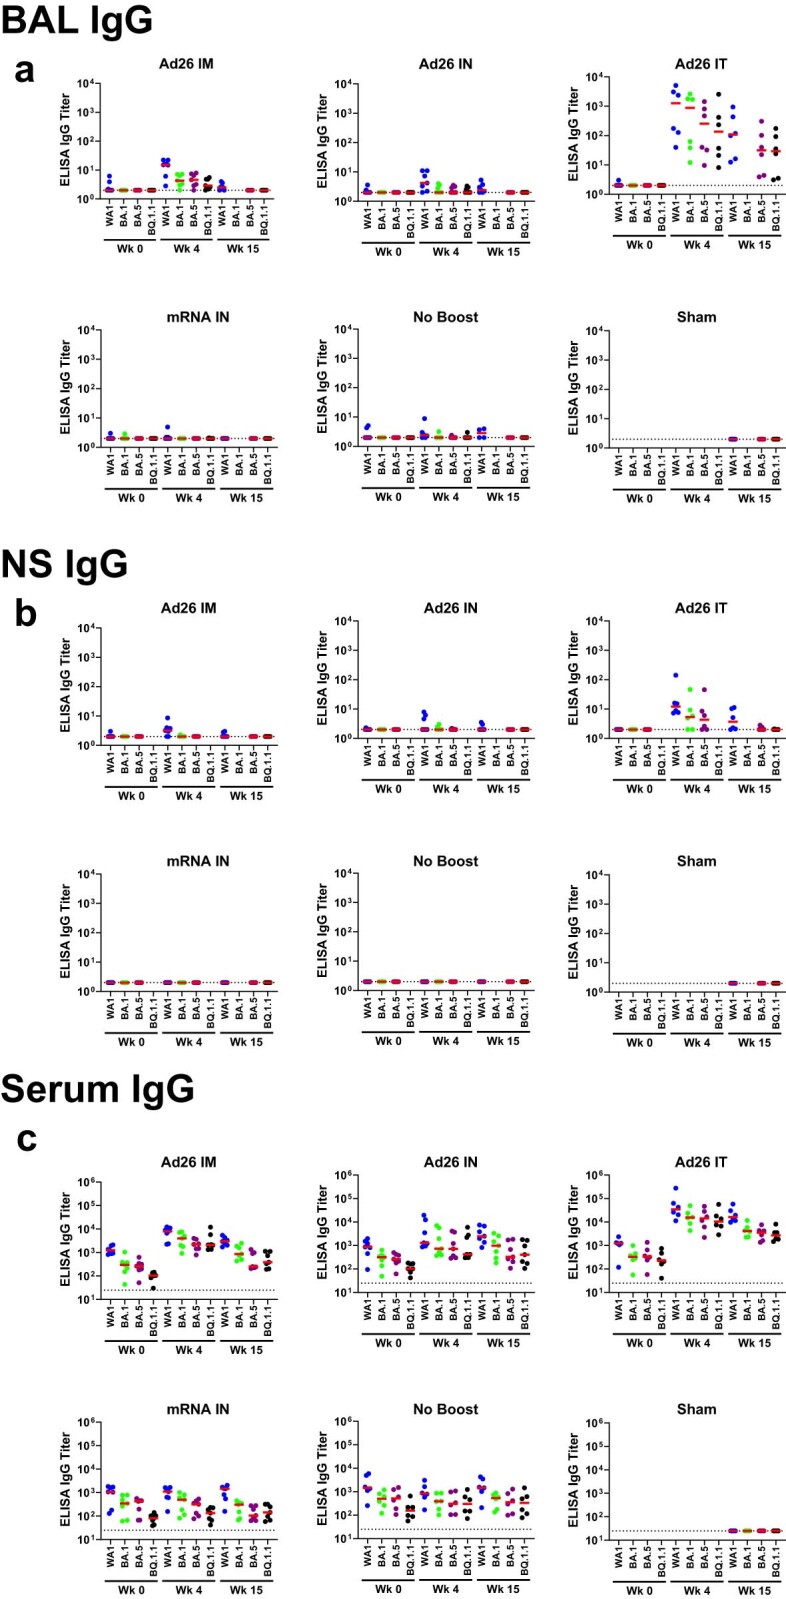
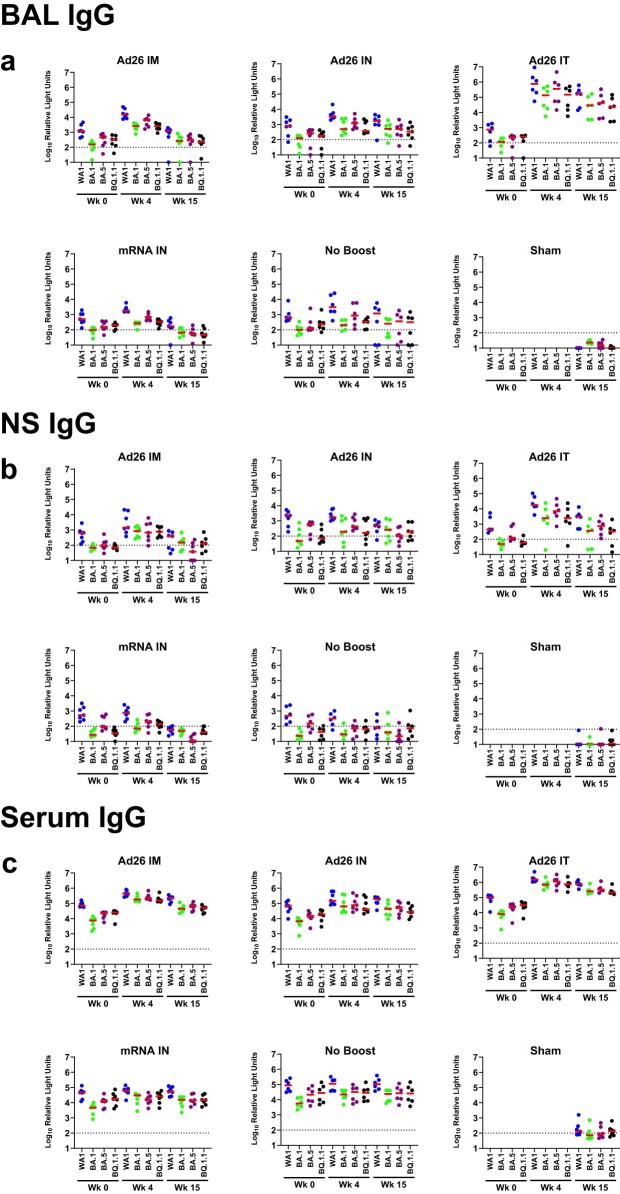
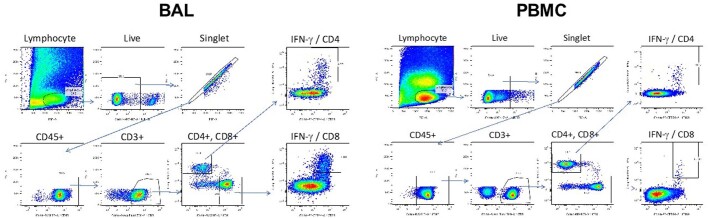
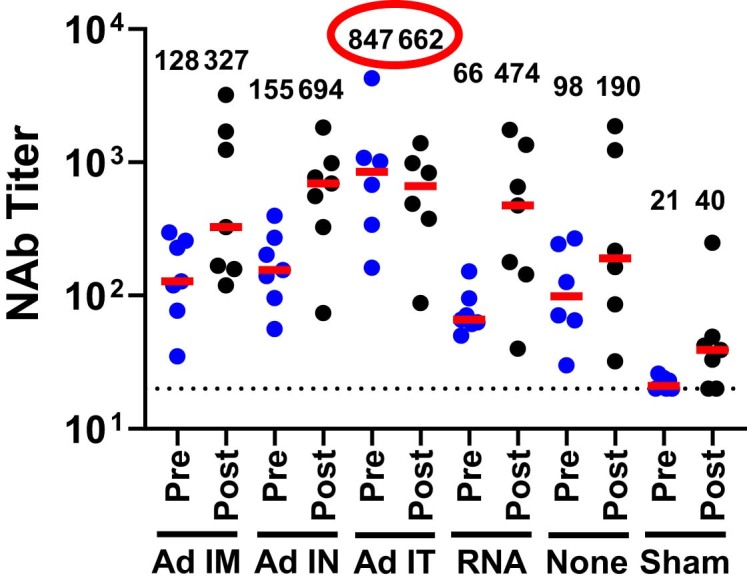
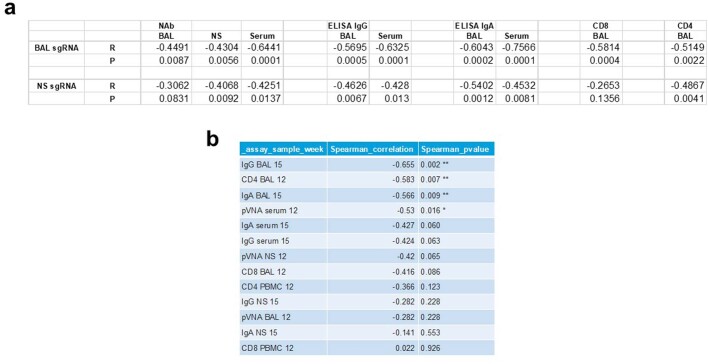
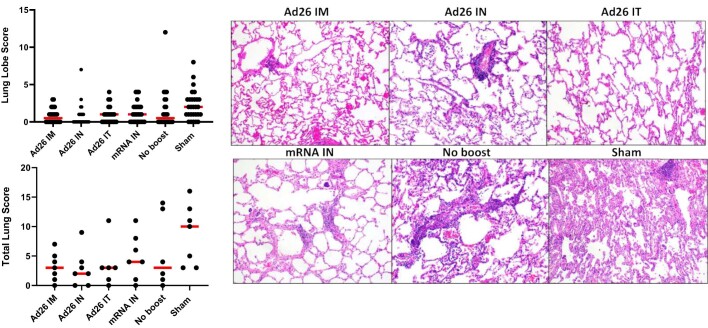
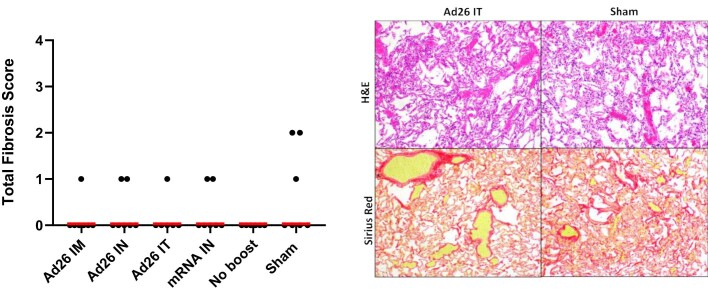
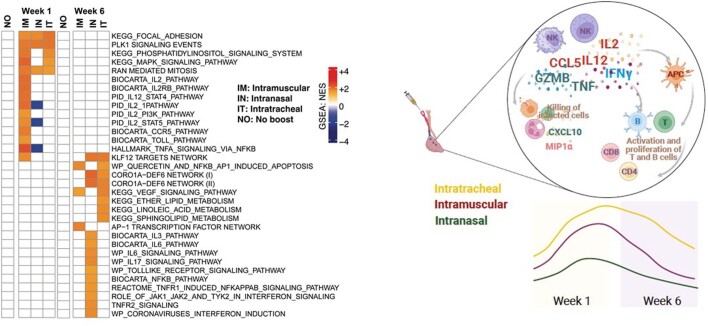
A limitation of current SARS-CoV-2 vaccines is that they provide minimal protection against infection with current Omicron subvariants1,2, although they still provide protection against severe disease. Enhanced mucosal immunity may be required to block infection and onward transmission. Intranasal administration of current vaccines has proven inconsistent3-7, suggesting that alternative immunization strategies may be required. Here we show that intratracheal boosting with a bivalent Ad26-based SARS-CoV-2 vaccine results in substantial induction of mucosal humoral and cellular immunity and near-complete protection against SARS-CoV-2 BQ.1.1 challenge. A total of 40 previously immunized rhesus macaques were boosted with a bivalent Ad26 vaccine by the intramuscular, intranasal and intratracheal routes, or with a bivalent mRNA vaccine by the intranasal route. Ad26 boosting by the intratracheal route led to a substantial expansion of mucosal neutralizing antibodies, IgG and IgA binding antibodies, and CD8+ and CD4+ T cell responses, which exceeded those induced by Ad26 boosting by the intramuscular and intranasal routes. Intratracheal Ad26 boosting also led to robust upregulation of cytokine, natural killer, and T and B cell pathways in the lungs. After challenge with a high dose of SARS-CoV-2 BQ.1.1, intratracheal Ad26 boosting provided near-complete protection, whereas the other boosting strategies proved less effective. Protective efficacy correlated best with mucosal humoral and cellular immune responses. These data demonstrate that these immunization strategies induce robust mucosal immunity, suggesting the feasibility of developing vaccines that block respiratory viral infections.


Conflict of interest statement

D.H.B., F.W. and R.C.Z. are listed as co-inventors on provisional SARS-CoV-2 vaccine patents (63/121,482; 63/133,969; 63/135,182). F.W., J.T., J.S., L.S., L.M.M.C. and R.C.Z. are employees and may hold equity in Janssen. The other authors declare no competing interests.

Figures

Fig. 1
Fig. 1. Study outline.
A total of 40 rhesus macaques previously received one or two i.m. primes with Ad26.COV2.S at weeks −114 and −108 and one boost i.m. with either Ad26.COV2.S or Ad26.COV2.S.351 (Beta) at week −69. At week 0, macaques were boosted with the bivalent Ad26.COV2.S + Ad26.COV2.S.529 (Omicron BA1) vaccine by the i.m., i.n. or i.t. routes or the bivalent mRNA vaccine (Pfizer-BioNTech) by the i.n. route. Another group received no boost at week 0, and a naive sham control group was included. At study week 16, all of the macaques were challenged with SARS-CoV-2 BQ.1.1 through the i.n. and i.t. routes.
Fig. 2
Fig. 2. Mucosal and peripheral SARS-CoV-2 NAb responses.
ac, NAb titres were assessed before and after boosting using a luciferase-based pseudovirus neutralization assay in BAL (a), nasal swabs (b) and serum (c). Responses were measured against SARS-CoV-2 WA1/2020 (blue), BA.1 (green), BA.5 (purple) and BQ.1.1 (black). The missing symbols indicate the absence of data. The dotted lines represent the limits of quantification. The median (red bars) values are shown. n = 40 biologically independent macaques. Wk, week. Source Data
Fig. 3
Fig. 3. Mucosal and peripheral IgA spike-specific binding antibody responses.
ac, IgA spike-specific binding antibody responses were assessed before and after boosting using ELISA in BAL (a), nasal swabs (b) and serum (c). Responses were measured against SARS-CoV-2 WA1/2020 (blue), BA.1 (green), BA.5 (purple) and BQ.1.1 (black) spike proteins. The missing symbols indicate the absence of data. The dotted lines represent the limits of quantification. Median (red bars) values are shown. n = 40 biologically independent macaques. Source Data
Fig. 4
Fig. 4. Mucosal and peripheral T cell responses.
ad, Pooled peptide spike-specific IFNγ CD8+ (a,c) and CD4+ (b,d) T cell responses as the percentage of total CD8+ and CD4+ T cells, respectively, were assessed before and after boosting by intracellular cytokine staining assays in BAL cells (a and b) and PBMCs (c and d). Responses were measured against SARS-CoV-2 BA.5 or BQ.1.1 spike peptides due to limited numbers of BAL cells (a,b) or WA1/2020 (blue), BA.1 (green), BA.5 (purple) and BQ.1.1 (black) spike peptides (c,d). The missing symbols indicate the absence of data. Median (red bars) values are shown. n = 40 biologically independent macaques. Source Data
Fig. 5
Fig. 5. Viral loads after SARS-CoV-2 BQ.1.1 challenge.
a,b, log-transformed sgRNA copies per ml in BAL (a) and log-transformed sgRNA copies per swab in nasal swabs (b) after SARS-CoV-2 BQ.1.1 challenge. Median (red lines) values are shown. c, log-transformed sgRNA copies per ml in BAL and nasal swabs at peak, day 4 and day 7 after SARS-CoV-2 BQ.1.1 challenge. d, The number of days to undetectable viral loads in the BAL and nasal swabs. The dotted lines represent the limits of quantification. Median (red bars) values are shown. The primary objective of the study was to compare the protective efficacy of Ad26 i.t. versus Ad26 i.m. boosting against SARS-CoV-2 challenge; these groups were therefore compared using two-sided Mann–Whitney U-tests and P values are shown. n = 40 biologically independent macaques. Source Data
Fig. 6
Fig. 6. Transcriptomics and cytokine analyses in the BAL.
a, Gene set enrichment analysis (GSEA) normalized enrichment scores (NES) of pathways for different groups at week 1 and week 6 after immunization relative to the no-boost (no) group. The colour scale represents the NES, ranging from downregulated pathways (blue) to no change (white) to upregulated pathways (orange). The colour intensity reflects the strength of the enrichment score, with darker colours indicating stronger upregulation (red) or downregulation (blue). Pathways were selected using a GSEA nominal P value of 0.05. P values were corrected for multiple testing using a false-discovery rate cut-off of 0.05. n = 40 biologically independent macaques. TFH, T follicular helper cells; Treg, regulatory T cells. b, Sample-level scores (sample-level enrichment analysis (SLEA)) for NK, IFNγ and IL-12_2 pathways at week 6 after i.t. boosting correlated with the IgA titres at week 12. Correlation analyses were performed using two-tailed Spearman correlation tests and simple linear regression. Lines of best fit (red line) and 95% confidence intervals (grey shading) are shown. n = 6 biologically independent macaques. c, IL-12, M1P-1a and CXCL10 levels in the BAL at week 6 were compared between groups using two-sided Mann–Whitney U-tests; P values are shown. n = 28 biologically independent macaques. NS, not significant. Source Data
Extended Data Fig. 1
Extended Data Fig. 1. Comparison of week 4 immune responses in BAL.
Comparison of NAb, IgA, CD8+ T cell responses, and CD4+ T cell responses in BAL across groups at week 4 (Figs. 2–4). NAb and IgA responses to WA1/2020 and CD8+ and CD4+ T cell responses to BA.5 are shown. These immunogenicity comparisons were secondary objectives of the study; groups were compared by two-sided Mann-Whitney tests and unadjusted P values are shown. n = 40 biologically independent animals.
Extended Data Fig. 2
Extended Data Fig. 2. Mucosal and peripheral IgA spike-specific binding antibody responses by ECLA.
IgA spike-specific binding antibody responses were assessed before and after boosting by meso-scale discovery (MSD) electrochemoluminscent assay in (a) bronchoalveolar lavage (BAL), (b) nasal swabs (NS), and (c) serum. Responses were measured against SARS-CoV-2 WA1/2020 (blue), BA.1 (green), BA.5 (purple), and BQ.1.1 (black) spike proteins. Missing symbols indicate absence of data. Dotted lines represent limits of quantitation. Medians (red bars) are shown. Relative light units are shown. n = 40 biologically independent animals.
Extended Data Fig. 3
Extended Data Fig. 3. Mucosal and peripheral IgG spike-specific binding antibody responses by ELISA.
IgG spike-specific binding antibody responses were assessed before and after boosting by ELISA in (a) bronchoalveolar lavage (BAL), (b) nasal swabs (NS), and (c) serum. Responses were measured against SARS-CoV-2 WA1/2020 (blue), BA.1 (green), BA.5 (purple), and BQ.1.1 (black) spike proteins. Missing symbols indicate absence of data. Dotted lines represent limits of quantitation. Medians (red bars) are shown. n = 40 biologically independent animals.
Extended Data Fig. 4
Extended Data Fig. 4. Mucosal and peripheral IgG spike-specific binding antibody responses by ECLA.
IgG spike-specific binding antibody responses were assessed before and after boosting by meso-scale discovery (MSD) electrochemoluminscent assay in (a) bronchoalveolar lavage (BAL), (b) nasal swabs (NS), and (c) serum. Responses were measured against SARS-CoV-2 WA1/2020 (blue), BA.1 (green), BA.5 (purple), and BQ.1.1 (black) spike proteins. Missing symbols indicate absence of data. Dotted lines represent limits of quantitation. Medians (red bars) are shown. Relative light units are shown. n = 40 biologically independent animals.
Extended Data Fig. 5
Extended Data Fig. 5. Sample flow cytometry gating.
Intracellular cytokine staining gating analysis for CD4+ and CD8+ T cells in BAL cells (left) and PBMCs (right).
Extended Data Fig. 6
Extended Data Fig. 6. Anamnestic SARS-CoV-2 neutralizing antibody responses following SARS-CoV-2 BQ.1.1 challenge.
Neutralizing antibody (NAb) titres to SARS-CoV-2 BQ.1.1 were assessed immediately before (Pre) and 2 weeks after (Post) challenge by a luciferase-based pseudovirus neutralization assay in serum. Dotted lines represent limits of quantitation. Medians (red bars) are shown with values numerically depicted. Note that all groups except the Ad26 IT group show increased BQ.1.1 NAb titres following challenge. n = 40 biologically independent animals.
Extended Data Fig. 7
Extended Data Fig. 7. Immune correlates of protection.
a, Correlation of pre-challenge, BQ.1.1-specific mucosal and peripheral NAb, ELISA IgG, ELISA IgA, and CD8+ and CD4+ T cell responses with peak log sgRNA levels in BAL and NS following SARS-CoV-2 BQ.1.1 challenge. Two-sided Spearman rank-correlation tests were performed, and R and P values are shown. b, Multivariable analysis of stepwise regression of peak sgRNA with immunologic parameters with multiple comparison adjustments.
Extended Data Fig. 8
Extended Data Fig. 8. Histopathology.
Individual lung lobe pathology scores (upper graph) and cumulative lung pathology scores (lower graph) for each macaque. Medians (red bars) are shown. Representative images are shown from lungs from each group 14 days following challenge. Sham vaccinated animals showed type II pneumocyte hyperplasia and expansion of the interstitium with inflammatory cells. Images are 10X magnification. n = 40 biologically independent animals.
Extended Data Fig. 9
Extended Data Fig. 9. Fibrosis scores.
Fibrosis sub-score from total lung score for individual macaques. Medians (red bars) are shown. Representative images are shown from lungs from an Ad26 IT and sham animal are shown with H&E and Sirius Red staining. Fibrosis was rare in all groups but slightly more evident in certain sham animals than vaccinated animals. Images are 10X magnification. n = 40 biologically independent animals.
Extended Data Fig. 10
Extended Data Fig. 10. Additional transcriptomics analyses in the BAL.
The heatmap (left) illustrates the normalized enrichment scores (NES) of pathways for different groups at weeks 1 and 6 following immunization relative to the no boost group. The colour scale represents the NES, ranging from downregulated pathways (blue) to no change (white) to upregulated pathways (orange). The colour intensity reflects the strength of the enrichment score, with darker colours indicating stronger upregulation or downregulation. Pathways were selected using a GSEA nominal P-value of 0.05. P-values were corrected for multiple testing using the false discovery rate FDR cutoff of 0.05. n = 40 biologically independent animals were included in this analysis. The summary cartoon (right) shows that IT boosting led to robust and sustained activation of cytokine, NK, T and B cell pathways in the lung for at least 6 weeks. The diagram was created using BioRender.

References

    1. Lin, D. Y. et al. Durability of bivalent boosters against Omicron subvariants. N. Engl. J. Med.10.1056/NEJMc2302462 (2023). - PMC - PubMed
    1. Boucau J, et al. Duration of shedding of culturable virus in SARS-CoV-2 Omicron (BA.1) infection. N. Engl. J. Med. 2022;387:275–277. doi: 10.1056/NEJMc2202092. - DOI - PMC - PubMed
    1. Madhavan M, et al. Tolerability and immunogenicity of an intranasally-administered adenovirus-vectored COVID-19 vaccine: An open-label partially-randomised ascending dose phase I trial. EBioMedicine. 2022;85:104298. doi: 10.1016/j.ebiom.2022.104298. - DOI - PMC - PubMed
    1. Cokaric Brdovcak M, et al. ChAdOx1-S adenoviral vector vaccine applied intranasally elicits superior mucosal immunity compared to the intramuscular route of vaccination. Eur. J. Immunol. 2022;52:936–945. doi: 10.1002/eji.202249823. - DOI - PMC - PubMed
    1. Feng L, et al. An adenovirus-vectored COVID-19 vaccine confers protection from SARS-COV-2 challenge in rhesus macaques. Nat. Commun. 2020;11:4207. doi: 10.1038/s41467-020-18077-5. - DOI - PMC - PubMed

Publication types

MeSH terms

Supplementary concepts