. 2024 Jan;300(1):105557.
doi: 10.1016/j.jbc.2023.105557. Epub 2023 Dec 12.

Formin tails act as a switch, inhibiting or enhancing processive actin elongation

Affiliations

Formin tails act as a switch, inhibiting or enhancing processive actin elongation

Kathryn V Bremer et al. J Biol Chem. 2024 Jan.

Abstract

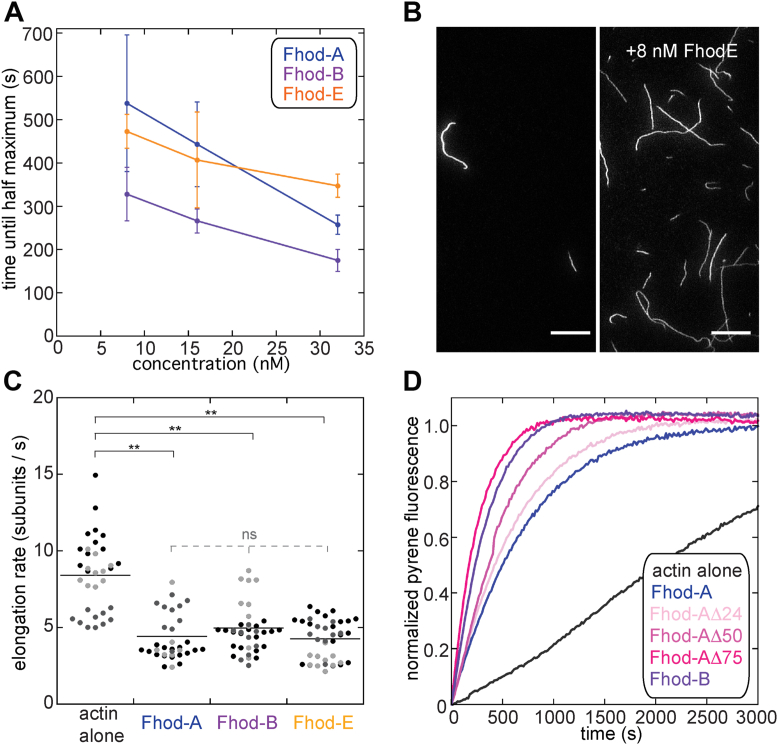
Formins are large, multidomain proteins that nucleate new actin filaments and accelerate elongation through a processive interaction with the barbed ends of filaments. Their actin assembly activity is generally attributed to their eponymous formin homology (FH) 1 and 2 domains; however, evidence is mounting that regions outside of the FH1FH2 stretch also tune actin assembly. Here, we explore the underlying contributions of the tail domain, which spans the sequence between the FH2 domain and the C terminus of formins. Tails vary in length from ∼0 to >200 residues and contain a number of recognizable motifs. The most common and well-studied motif is the ∼15-residue-long diaphanous autoregulatory domain. This domain mediates all or nothing regulation of actin assembly through an intramolecular interaction with the diaphanous inhibitory domain in the N-terminal half of the protein. Multiple reports demonstrate that the tail can enhance both nucleation and processivity. In this study, we provide a high-resolution view of the alternative splicing encompassing the tail in the formin homology domain (Fhod) family of formins during development. While four distinct tails are predicted, we found significant levels of only two of these. We characterized the biochemical effects of the different tails. Surprisingly, the two highly expressed Fhod-tails inhibit processive elongation and diminish nucleation, while a third supports activity. These findings demonstrate a new mechanism of modulating actin assembly by formins and support a model in which splice variants are specialized to build distinct actin structures during development.

Keywords: Drosophila; Fhod; actin; cytoskeleton; formin; long-read sequencing; mRNA.


Conflict of interest statement

Conflict of interest The authors declare that they have no conflicts of interest with the contents of this article.

Figures

Figure 1
Figure 1
Fhod variants with distinct tails are differentially expressed during development. A, alternative splicing of fhos leads to nine putative protein variants. B, four distinct tails are possible (A, B, D, and E). They have the same Formin homology-1 (FH1) and FH2 domains. FH1 green; FH2 yellow; within the tail, colors represent exons. The tails vary in length and theoretical pI as shown. C, Oxford Nanopore sequencing—samples of reads mapped to the fhos gene for the larval stage and day 5. Data from all five stages are shown in Supporting information (Fig. S1). D, ratio of reads of Fhod-A (blue) relative to reads of Fhod-E (yellow) for each developmental stage. Plot generated using SuperPlotsOfData (30). Small circles represent reads from independent samples. The large circles are means (n = 3 in all cases). Fhod-A is present at all stages while Fhod-E is not detected in larva and pupa but read numbers increase with age post eclosion. DID, diaphanous inhibitory domain.
Figure 2
Figure 2
Fhod-B is a processive elongator. A, direct observation of barbed-end elongation by total internal reflection fluorescence microscopy with 0.5-nM seeds (1% biotinylated, labeled with Alexa Fluor 647-phalloidin; green), 1 μM G-actin (20% Oregon green labeled; white), 5 μM Chic (Drosophila profilin), ± 0.5 nM indicated Fhod construct. Yellow arrows denote the barbed-ends of bright, slow-growing filaments (no Fhod bound). Magenta arrows denote the barbed-ends of dim, fast-growing filaments (Fhod bound). The scale bar represents 10 μm. B, quantification of elongation from (A). Fine gray traces denote bright, slow-growing filaments. Fine purple traces denote dim, fast-growing filaments. Thick gray and purple traces denote means of the bright and dim growing populations, respectively. Elongation rates at the top of each plot are the mean ± standard deviation from ≥2 flow chambers for each condition (n = 16, actin alone; n = 9, Fhod-A; n = 10 [dim] and n = 6 [bright], Fhod-B; n = 27, Fhod-E). Fhod-B bright versus dim were compared with a two-tailed Student’s t test. C, comparison of elongation rates for Fhod isoforms. Lines indicate the means. Dim filaments elongating in the presence of Fhod-B were significantly faster than all three other conditions. ∗∗p < 0.01, ∗p < 0.05, p values were determined with a one-way ANOVA and Tukey HSD post hoc tests. If no value is indicated, p > 0.05. D, measurement of Fhod-B processivity shown as an empirical cumulative distribution function plot. Data points are from three experimental replicates (n = 66 filaments). The dashed line indicates the median of the combined samples (24 μm). The mean ± standard deviation of the three independent samples is 24.1 ± 0.6 μm.
Figure 3
Figure 3
Residues at the end of the Fhod-A tail inhibit processivity.A, wavelength scans of circular dichroism indicate that Fhod tails are disordered. B, alignment of two Drosophila and two human Fhod tails. Truncation points for subsequent experiments are indicated. Asterisks denote phosphorylated residues (24). C, direct observation of barbed-end elongation by total internal reflection fluorescence microscopy. Conditions are the same as in Figure 2. Images were acquired 10 min after the start of polymerization. The scale bar represents 10 μm. D, quantification of elongation rates; ≥2 flow chambers for each condition. Bright filaments are represented by gray dots and dim filaments are colored. Lines indicate the means. ∗∗p < 0.01, ∗p < 0.05, nsp > 0.05, p values were determined with a one-way ANOVA and Tukey HSD post hoc tests. Bright filaments were excluded from analysis between constructs if dim filaments were observed. Difference between the three truncation constructs were not significant. E, measurement of processivity shown as an empirical cumulative distribution function plot. Data points are from three experimental replicates (the number of filaments analyzed for each construct is given in the figure). The dashed lines indicate the medians (19.4–20.6 μm). The mean ± standard deviation of the three independent samples for each construct is 22.5 ± 0.3 μm (Fhod-AΔ24), 20.8 ± 0.7 μm (Fhod-AΔ50), 19.9 ± 0.6 μm (Fhod-AΔ75), and 24.1 ± 0.6 μm (Fhod-AΔ99 = FhodB).
Figure 4
Figure 4
Fhod tails decrease nucleation.A, average time until half maximum polymerization measured from assembly reactions with 2 μM (10% pyrene-labeled) actin and 8 to 32 nM of indicated Fhod constructs. (n = 3 for all conditions; bars represent standard deviations.) B, actin, 2 μM, was polymerized in the presence or absence of 8 nM Fhod-E for 5 min, stabilized with Alexa Fluor 488-phalloidin, and imaged by total internal reflection fluorescence microscopy. The scale bars represent 10 μm. C, comparison of elongation rates for Fhod isoforms without profilin, 0.5 μM G-actin (20% Oregon green). Shades of gray represent independent replicates (n = 3 for each condition). Lines indicate the means. ∗∗p < 0.01, nsp > 0.05, p values were determined with a one-way ANOVA and Tukey HSD post hoc tests. All three constructs were slower than actin alone. Differences between Fhod-A, -B, and -E were not significant. D, representative kinetic traces of pyrene actin assembly assays with 2 μM (10% pyrene-labeled) actin and 8 nM of indicated Fhod constructs.
Figure 5
Figure 5
Tails determine processivity.A, cartoons of chimeras between FH1FH2 domains and tails of multiple formins. B-G, direct observation of barbed-end elongation by total internal reflection fluorescence microscopy. Conditions are the same as in Figure 2 except the indicated construct was added at different concentrations (C, hDelFFC = 15 nM, D, CapuCT = 1 nM, E, CapuFhodA = 0.5 nM, F, hDelFhodB = 15 nM, G, hDelCapu = 15 nM). The scale bar represents 10 μm.

References

    1. Goode B.L., Eck M.J. Mechanism and function of formins in the control of actin assembly. Annu. Rev. Biochem. 2007;76:593–627. - PubMed
    1. Courtemanche N. Mechanisms of formin-mediated actin assembly and dynamics. Biophys. Rev. 2018;10:1553–1569. - PMC - PubMed
    1. Breitsprecher D., Goode B.L. Formins at a glance. J. Cell Sci. 2013;126:1–7. - PMC - PubMed
    1. Valencia D.A., Quinlan M.E. Formins. Curr. Biol. 2021;31:R517–R522. - PubMed
    1. Xu Y., Moseley J.B., Sagot I., Poy F., Pellman D., Goode B.L., et al. Crystal structures of a Formin Homology-2 domain reveal a tethered dimer architecture. Cell. 2004;116:711–723. - PubMed

Publication types