Seven oxidative stress-related genes predict the prognosis of hepatocellular carcinoma
- PMID: 38097352
- PMCID: PMC10781471
- DOI: 10.18632/aging.205330
Seven oxidative stress-related genes predict the prognosis of hepatocellular carcinoma
Abstract
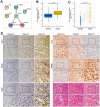
Predicting the prognosis of hepatocellular carcinoma (HCC) is a major medical challenge and of guiding significance for treatment. This study explored the actual relevance of RNA expression in predicting HCC prognosis. Cox's multiple regression was used to establish a risk score staging classification and to predict the HCC patients' prognosis on the basis of data in the Cancer Genome Atlas (TCGA). We screened seven gene biomarkers related to the prognosis of HCC from the perspective of oxidative stress, including Alpha-Enolase 1(ENO1), N-myc downstream-regulated gene 1 (NDRG1), nucleophosmin (NPM1), metallothionein-3, H2A histone family member X, Thioredoxin reductase 1 (TXNRD1) and interleukin 33 (IL-33). Among them we measured the expression of ENO1, NGDP1, NPM1, TXNRD1 and IL-33 to investigate the reliability of the multi-index prediction. The first four markers' expressions increased successively in the paracellular tissues, the hepatocellular carcinoma samples (from patients with better prognosis) and the hepatocellular carcinoma samples (from patients with poor prognosis), while IL-33 showed the opposite trend. The seven genes increased the sensitivity and specificity of the predictive model, resulting in a significant increase in overall confidence. Compared with the patients with higher-risk scores, the survival rates with lower-risk scores are significantly increased. Risk score is more accurate in predicting the prognosis HCC patients than other clinical factors. In conclusion, we use the Cox regression model to identify seven oxidative stress-related genes, investigate the reliability of the multi-index prediction, and develop a risk staging model for predicting the prognosis of HCC patients and guiding precise treatment strategy.
Keywords: Alpha-Enolase 1; Cox regression model; N-myc downstream-regulated gene 1; hepatocellular carcinoma; nucleophosmin.
Conflict of interest statement
Figures


Similar articles
-
A Cuproptosis-Related LncRNA Risk Model for Predicting Prognosis and Immunotherapeutic Efficacy in Patients with Hepatocellular Carcinoma.Biochem Genet. 2024 Jun;62(3):2332-2351. doi: 10.1007/s10528-023-10539-x. Epub 2023 Oct 29. Biochem Genet. 2024. PMID: 37898914
-
Clinical Significance of the Thioredoxin System and Thioredoxin-Domain-Containing Protein Family in Hepatocellular Carcinoma.Dig Dis Sci. 2019 Jan;64(1):123-136. doi: 10.1007/s10620-018-5307-x. Epub 2018 Oct 4. Dig Dis Sci. 2019. PMID: 30288659
-
Predictive value of a stemness-based classifier for prognosis and immunotherapy response of hepatocellular carcinoma based on bioinformatics and machine-learning strategies.Front Immunol. 2024 Apr 17;15:1244392. doi: 10.3389/fimmu.2024.1244392. eCollection 2024. Front Immunol. 2024. PMID: 38694506 Free PMC article.
-
Overexpression of EWSR1 (Ewing sarcoma breakpoint region 1/EWS RNA binding protein 1) predicts poor survival in patients with hepatocellular carcinoma.Bioengineered. 2021 Dec;12(1):7941-7949. doi: 10.1080/21655979.2021.1982844. Bioengineered. 2021. PMID: 34612781 Free PMC article.
-
Weighted correlation gene network analysis reveals a new stemness index-related survival model for prognostic prediction in hepatocellular carcinoma.Aging (Albany NY). 2020 Jul 9;12(13):13502-13517. doi: 10.18632/aging.103454. Epub 2020 Jul 9. Aging (Albany NY). 2020. PMID: 32644941 Free PMC article.
Cited by
-
Metallothionein: A Comprehensive Review of Its Classification, Structure, Biological Functions, and Applications.Antioxidants (Basel). 2024 Jul 9;13(7):825. doi: 10.3390/antiox13070825. Antioxidants (Basel). 2024. PMID: 39061894 Free PMC article. Review.
-
Comprehensive assessment of regulatory T-cells-related scoring system for predicting the prognosis, immune microenvironment and therapeutic response in hepatocellular carcinoma.Aging (Albany NY). 2024 Mar 8;16(6):5288-5310. doi: 10.18632/aging.205649. Epub 2024 Mar 8. Aging (Albany NY). 2024. PMID: 38461439 Free PMC article.
-
Metallothioneins in the Pathogenesis of Liver Diseases: A Review.Int J Hepatol. 2025 Jul 25;2025:8880889. doi: 10.1155/ijh/8880889. eCollection 2025. Int J Hepatol. 2025. PMID: 40755507 Free PMC article. Review.
References
-
- Pinyol R, Montal R, Bassaganyas L, Sia D, Takayama T, Chau GY, Mazzaferro V, Roayaie S, Lee HC, Kokudo N, Zhang Z, Torrecilla S, Moeini A, et al.. Molecular predictors of prevention of recurrence in HCC with sorafenib as adjuvant treatment and prognostic factors in the phase 3 STORM trial. Gut. 2019; 68:1065–75. 10.1136/gutjnl-2018-316408 - DOI - PMC - PubMed
Publication types
MeSH terms
Substances
LinkOut - more resources
Full Text Sources
Medical
Miscellaneous

