. 2023 Dec 14;14(1):7812.
doi: 10.1038/s41467-023-43510-w.

Repurposed drugs and their combinations prevent morbidity-inducing dermonecrosis caused by diverse cytotoxic snake venoms

Affiliations

Repurposed drugs and their combinations prevent morbidity-inducing dermonecrosis caused by diverse cytotoxic snake venoms

Steven R Hall et al. Nat Commun. .

Abstract

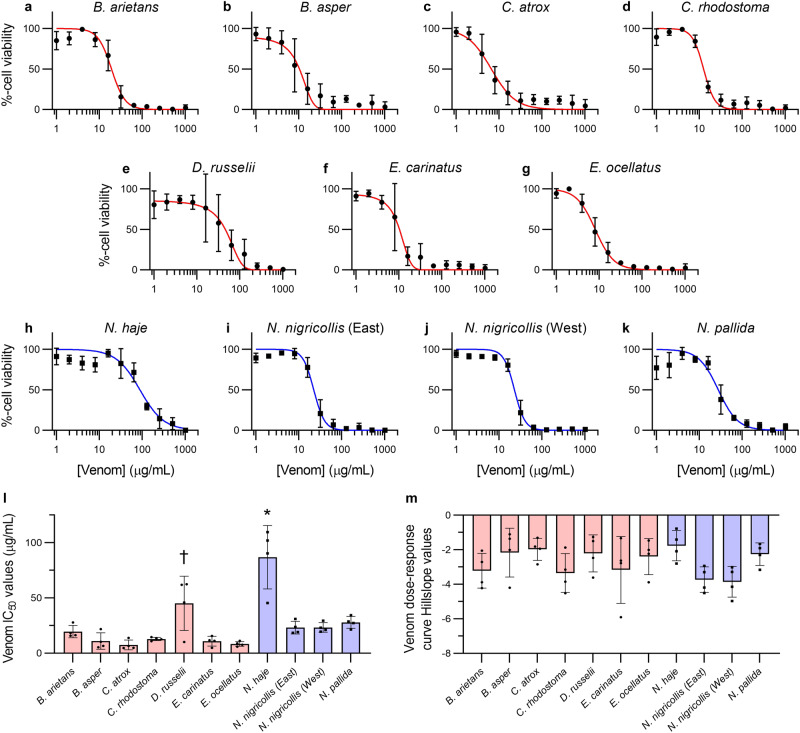
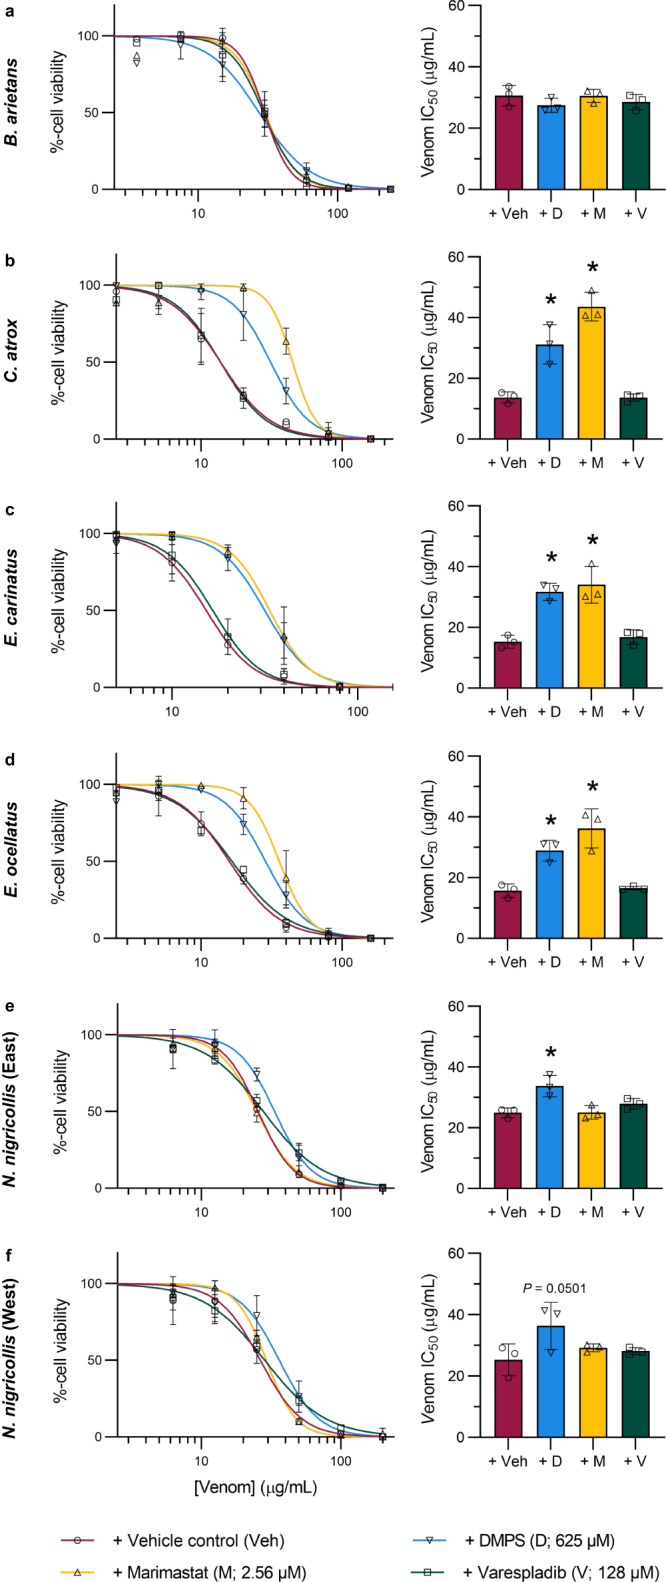
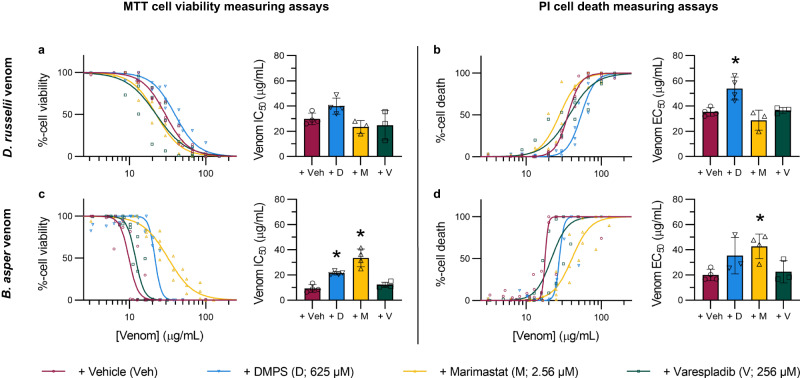
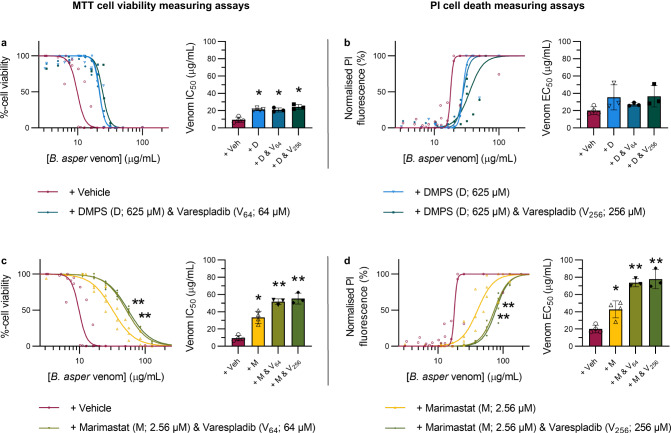
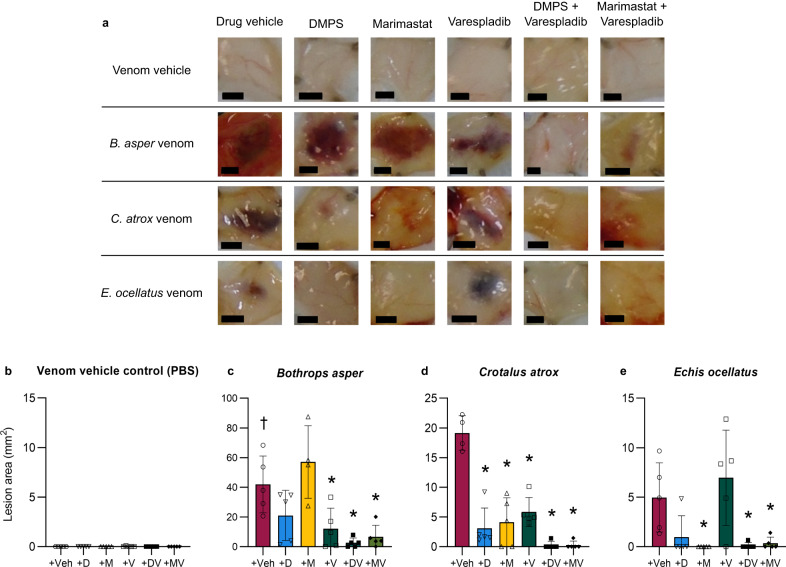
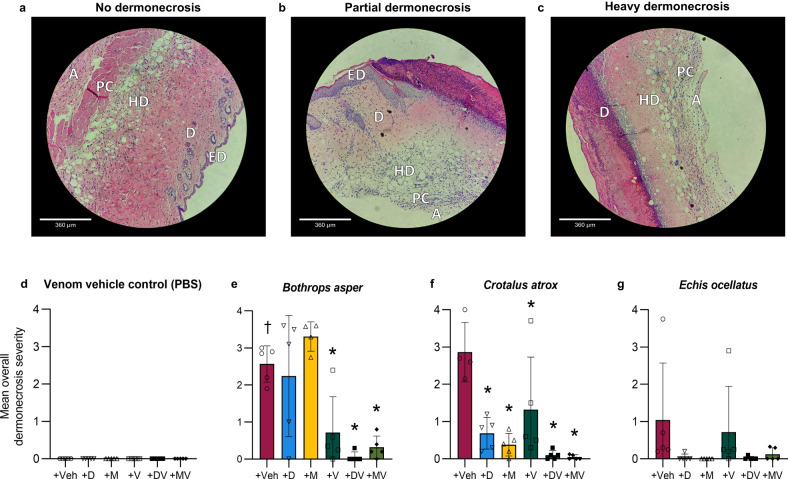
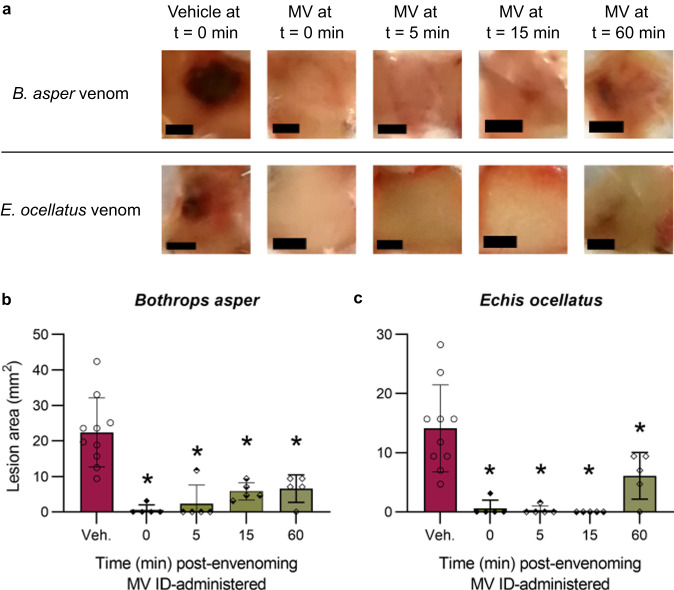
Morbidity from snakebite envenoming affects approximately 400,000 people annually. Tissue damage at the bite-site often leaves victims with catastrophic life-long injuries and is largely untreatable by current antivenoms. Repurposed small molecule drugs that inhibit specific snake venom toxins show considerable promise for tackling this neglected tropical disease. Using human skin cell assays as an initial model for snakebite-induced dermonecrosis, we show that the drugs 2,3-dimercapto-1-propanesulfonic acid (DMPS), marimastat, and varespladib, alone or in combination, inhibit the cytotoxicity of a broad range of medically important snake venoms. Thereafter, using preclinical mouse models of dermonecrosis, we demonstrate that the dual therapeutic combinations of DMPS or marimastat with varespladib significantly inhibit the dermonecrotic activity of geographically distinct and medically important snake venoms, even when the drug combinations are delivered one hour after envenoming. These findings strongly support the future translation of repurposed drug combinations as broad-spectrum therapeutics for preventing morbidity caused by snakebite.


Conflict of interest statement

The authors declare no competing interests.

Figures

Fig. 1
Fig. 1. Snake venoms dose-dependently inhibit HaCaT adherent cell viability.
MTT cell viability assays were completed in adherent HaCaT epidermal keratinocytes exposed to serial dilutions (1–1,024 µg/mL) of different snake venoms for 24 hours. The venoms tested were from a Bitis arietans, b Bothrops asper, c Crotalus atrox, d Calloselasma rhodostoma, e Daboia russelii, f Echis carinatus, g Echis ocellatus, h Naja haje, i East African Naja nigricollis, j West African Naja nigricollis, and k Naja pallida. l IC50 and m Hill slope values were calculated for each independent trial. Red-coloured data denotes viperid snakes, while blue-coloured data denotes elapid snakes. * Signifies that the value is significantly higher than all other tested venoms, and † signifies that the value is significantly higher than B. asper, C. atrox, C. rhodostoma, E. carinatus, and E. ocellatus, as determined by a one-way ANOVA comparing all values to each other followed by a Tukey’s multiple comparisons test (P < 0.05, n = 4 biologically independent cell experiments). ANOVA statistics for individual statistically analysed graphs are: l F(10,33) = 14.47, P = 0.0000000022; m F(10,33) = 1.828, P = 0.0942. Data are presented as mean values ± SD and the individual IC50 and Hill slope values for each trial are shown as points within the bars of the graphs in l and m. Source data are provided as a Source Data file.
Fig. 2
Fig. 2. DMPS and marimastat, but not varespladib, inhibit the potency of certain cytotoxic snake venoms in adherent HaCaT cells.
Serial dilutions of venoms (2.5–200 µg/mL) were pre-incubated with the MTC½ of DMPS, marimastat, varespladib, or vehicle control for 30 minutes, after which HaCaT cells were exposed to the treatments for 24 hours followed by MTT cell viability assays, from which venom concentration-response curves and their associated IC50 values were calculated. Panels show venom from a B. arietans, b C. atrox, c E. carinatus, d E. ocellatus, e East African N. nigricollis, and f West African N. nigricollis. * Signifies that the IC50 is significantly higher than that of the vehicle control for that venom as determined by a one-way ANOVA followed by Dunnett’s multiple comparisons test (P < 0.05, n = 3 biologically independent cell experiments). ANOVA statistics for individual statistically analysed graphs are: a F(3,8) = 1.057, P = 0.4195; b F(3,8) = 37.16, P = 0.000048; c F(3,8) = 21.17, P = 0.0004; d F(3,8) = 20.34, P = 0.0004; e F(3,8) = 8.757, P = 0.0066; f F(3,8) = 2.998, P = 0.0952. Data are presented as mean values ± SD and the individual values for each trial are shown as points within each of the bar graphs. Source data are provided as a Source Data file.
Fig. 3
Fig. 3. SVMP inhibitors reduce the loss of HaCaT cell viability and/or cell death stimulated by D. russelii and B. asper venoms.
HaCaT cells were treated for 24 hours with serial dilutions of D. russelii (3.125–100 µg/mL, top row) or B. asper (2.2–127 µg/mL, bottom row) venom that had been pre-incubated with drug vehicle control, DMPS (625 µM), marimastat (2.56 µM), or varespladib (256 µM). For all treatment groups, MTT cell viability (LHS of figure) and PI cell death (RHS of figure) assays were performed. * Signifies that value is significantly different than that of the vehicle control for that venom as determined by a one-way ANOVA followed by Dunnett’s multiple comparisons test (P < 0.05, n = 3 [a{M,V}, b{M, V}, d{D, V}] or 4 [a{Veh, D}, b{Veh, D}, c{Veh, D, M, V}, d{Veh, M}] biologically independent cell experiments). ANOVA statistics for individual statistically analysed graphs are: a F(3,10) = 3.969, P = 0.0422; b F(3,10) = 10.14, P = 0.0022; c F(3,12) = 29.20, P = 0.0000085; d F(3,10) = 4.677, P = 0.0273. Data are presented as mean values ± SD and the individual values for each trial are shown as points within each of the graphs. Source data are provided as a Source Data file.
Fig. 4
Fig. 4. Varespladib potentiates the inhibitory effects of marimastat, but not DMPS, against B. asper venom in HaCaT cells.
HaCaT cells were treated for 24 hours with serial dilutions of B. asper venom (2.2–190 µg/mL) that had been pre-incubated with drug vehicle control or with drug combination therapies consisting of DMPS (625 µM) plus varespladib (64 or 256 µM, abbreviated V64 or V256, respectively; top row) or marimastat (2.56 µM) plus V64 or V256 (bottom row). For all treatment groups, MTT cell viability (LHS of figure) and PI cell death (RHS of figure) assays were performed. * Signifies the value is significantly different than that of the vehicle control and ** signifies the value is significantly different than that of the marimastat-alone treatment, as determined by a one-way ANOVA comparing all treatments to each other followed by Tukey’s multiple comparisons test (P < 0.05, n = 3 [a{D & V64, D & V256}, b{D, D & V64, D & V256}, c{M & V64, M & V256}, d{M & V64, M & V256}] or 4 [a{Veh, D}, b{Veh}, c{Veh, M}, d{Veh, M}] biologically independent cell experiments). ANOVA statistics for individual statistically analysed graphs are: a F(3,10) = 26.63, P = 0.000044; b F(3,9) = 2.382, P = 0.1371; c F(3,10) = 56.55, P = 0.0000014; d F(3,10) = 40.41, P = 0.0000067. Data are presented as mean values ± SD and the individual values for each trial are shown as points within each of the graphs. Source data are provided as a Source Data file.
Fig. 5
Fig. 5. Dermal lesions induced by distinct snake venoms are inhibited by drug combinations containing an SVMP and a PLA2 inhibitor.
Individual mice were ID injected with B. asper (150 µg), C. atrox (100 µg), or E. ocellatus (39 µg) venom or venom vehicle control (PBS) that had been pre-incubated with drug vehicle control (98.48% PBS, 1.52% DMSO; Veh), DMPS (110 µg; D), marimastat (60 µg; M), varespladib (19 µg; V), DMPS & varespladib (110 and 19 µg, respectively; DV), or marimastat & varespladib (60 and 19 µg, respectively; MV). After 72 hours the mice were euthanised and their lesions excised, height and width measured with callipers, and photographed. a Representative images of the lesions resulting from each treatment group (black scale bar represents 3 mm). Bar graphs summarising the average total lesion areas for each drug treatment group when pre-incubated with b venom vehicle control (PBS), c B. asper, d C. atrox, or (e) E. ocellatus venom. † Signifies that these mice were culled at 24 h instead of the usual 72 h, due to their external lesions progressing to the maximum permitted size defined in our animal ethics licence, thus resulting in early euthanasia. * Signifies that value is significantly different than that of the drug vehicle control for that venom as determined by a one-way ANOVA followed by Dunnett’s multiple comparisons test (P < 0.05, n = 4 [c{M}, d{Veh}] or 5 [b{all}, c{Veh, D, V, DV, MV}, d{D, M, V, DV, MV}, e{all}] biologically independent animals). ANOVA statistics for individual statistically analysed graphs are: b F(5,24) = 1.000, P = 0.4389, c F(5,23) = 8.808, P = 0.000088; d F(5,23) = 28.80, P = 0.0000000035; e F(5,24) = 6.587, P = 0.0005. Data are presented as mean values ± SD and the individual values for each lesion are shown as points within each of the bars. Source data are provided as a Source Data file.
Fig. 6
Fig. 6. Histopathological analysis of ID-injection site cross-sections confirms venom-induced dermonecrosis can be reduced using SVMP- and PLA2-inhibiting drugs.
Four µm H&E sections were prepared from formalin-fixed, paraffin-embedded tissue from dermal injection sites and photographed at 100X magnification. Two blinded and independent experimenters scored, between 0–4, the percentage of each skin layer that was necrotic (0 = 0%, 1 = 0–25%, 2 = 25–50%, 3 = 50–75%, and 4 = 75–100%). The highest recorded score per cross-section was used as a measure of the maximum severity reached within each skin sample. Representative 100X-magnified images showing a no dermonecrosis (mean overall dermonecrosis score of 0), b partial dermonecrosis (1.4) and c heavy dermonecrosis (2.4), with epidermis (ED), dermis (D), hypodermis (HD), panniculus carnosus (PC), and adventitia (A) annotated in each image (note that the ED is not visible in the ‘Heavy dermonecrosis’ image due to the severity of the ulceration, and was therefore given a necrosis score of 4). Bar graphs summarising the mean overall dermonecrosis severity scores in cross-sections from mice ID-injected with d venom vehicle control (PBS), e B. asper venom, f C. atrox venom, or g E. ocellatus venom that had been pre-incubated with drug vehicle control (98.48% PBS, 1.52% DMSO; Veh), DMPS (110 µg; D), marimastat (60 µg; M), varespladib (19 µg; V), DMPS-plus-varespladib (110 and 19 µg, respectively; DV), or marimastat-plus-varespladib (60 and 19 µg, respectively; MV). † Signifies these mice were culled at 24 h instead of the usual 72 h, due to their external lesions progressing to the maximum permitted size defined in the animal ethics licence, resulting in early euthanasia. * Signifies that value is significantly different than that of the drug vehicle control as determined by a one-way ANOVA followed by Dunnett’s multiple comparisons test (P < 0.05, n = 4 [e{M}, f{Veh}] or 5 [d{all}, e{Veh, D, V, DV, MV}, f{D, M, V, DV, MV}, g{all}] biologically independent animals). ANOVA statistics: e F(5,23) = 11.81, P = 0.0000097; f F(5, 23) = 10.30, P = 0.000028; g F(5,24)1.531, P = 0.2178. Data are presented as mean values ± SD and individual scores are shown as points within each of the figures’ bars. Source data are provided as a Source Data file.
Fig. 7
Fig. 7. The drug combination of marimastat and varespladib significantly inhibits the size of dermal lesions induced by B. asper and E. ocellatus venoms when delivered up to 1 hour after venom challenge.
Mice (n = 5) were ID injected with B. asper (150 µg) or E. ocellatus (39 µg) venom and then ID injected in the same location at 0 minutes (i.e. a second injection immediately) post-venom challenge with drug vehicle control (98.48% PBS, 1.52% DMSO; Veh) or at 0-, 5-, 15-, or 60-minutes post-venom challenge with marimastat and varespladib (60 and 19 µg, respectively; MV). After 72 hours experimental animals were euthanised and their lesions excised, quantified, and photographed. a Representative images of the lesions resulting from each treatment group (black scale bar represents 3 mm). Bar graphs summarising the ability of MV to inhibit skin lesion formation caused by b B. asper and c E. ocellatus venoms at 0-, 5-, 15-, and 60-minutes post-venom challenge. * Signifies that value is significantly different than that of the drug vehicle control for that venom as determined by a one-way ANOVA followed by Dunnett’s multiple comparisons test (P < 0.05, n = 5 [all drug treatments] or 10 [vehicle controls] biologically independent animals). ANOVA statistics for individual statistically analysed graphs are: b F(4,25) = 14.27, P = 0.0000034, c F(4,25) = 12.88, P = 0.00000795. Data are presented as mean values ± SD and the individual values for each lesion are shown as points within each of the bars. Source data are provided as a Source Data file.

References

    1. Gutiérrez JM, et al. Snakebite envenoming. Nat Rev Dis Primers. 2017;3:1–21. - PubMed
    1. Kasturiratne A, et al. The global burden of snakebite: a literature analysis and modelling based on regional estimates of envenoming and deaths. PLoS Med. 2008;5:1591–1604. doi: 10.1371/journal.pmed.0050218. - DOI - PMC - PubMed
    1. Longbottom J, et al. Vulnerability to snakebite envenoming: a global mapping of hotspots. Lancet. 2018;392:673–684. doi: 10.1016/S0140-6736(18)31224-8. - DOI - PMC - PubMed
    1. Waiddyanatha S, Silva A, Siribaddana S, Isbister GK. Long-term effects of snake envenoming. Toxins. 2019;11:1–13. doi: 10.3390/toxins11040193. - DOI - PMC - PubMed
    1. Molyneux DH. The London declaration on neglected tropical diseases: 5 years on. Trans. R Soc. Trop. Med. Hyg. 2016;110:623–625. - PubMed

Publication types