. 2023 Dec 15;8(1):453.
doi: 10.1038/s41392-023-01710-2.

Aberrant epithelial cell interaction promotes esophageal squamous-cell carcinoma development and progression

Affiliations

Aberrant epithelial cell interaction promotes esophageal squamous-cell carcinoma development and progression

Liping Chen et al. Signal Transduct Target Ther. .

Abstract

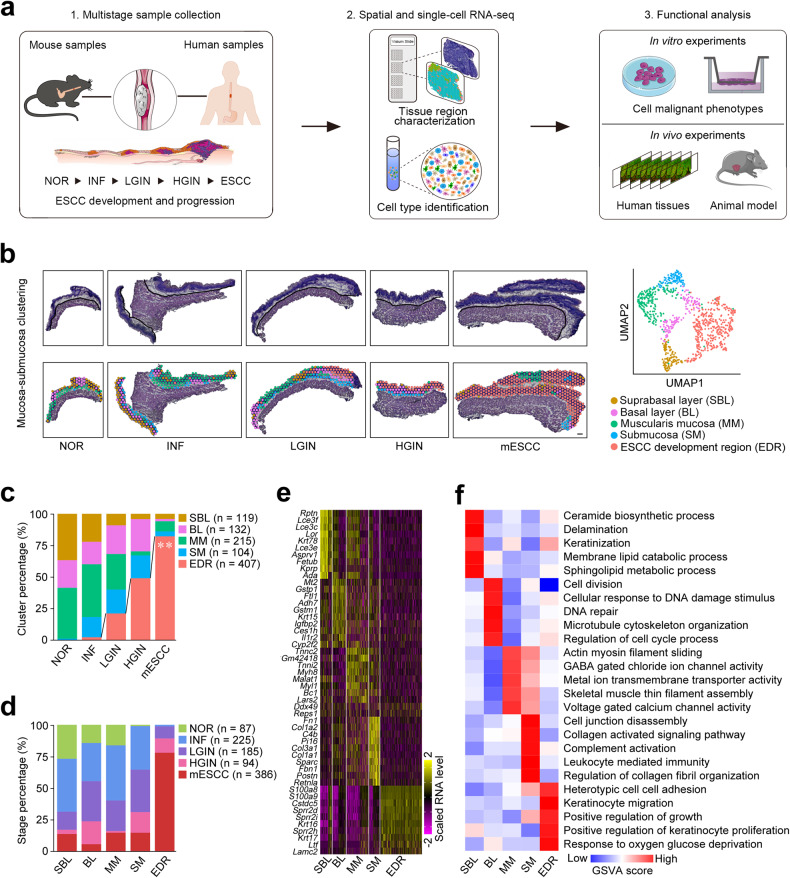
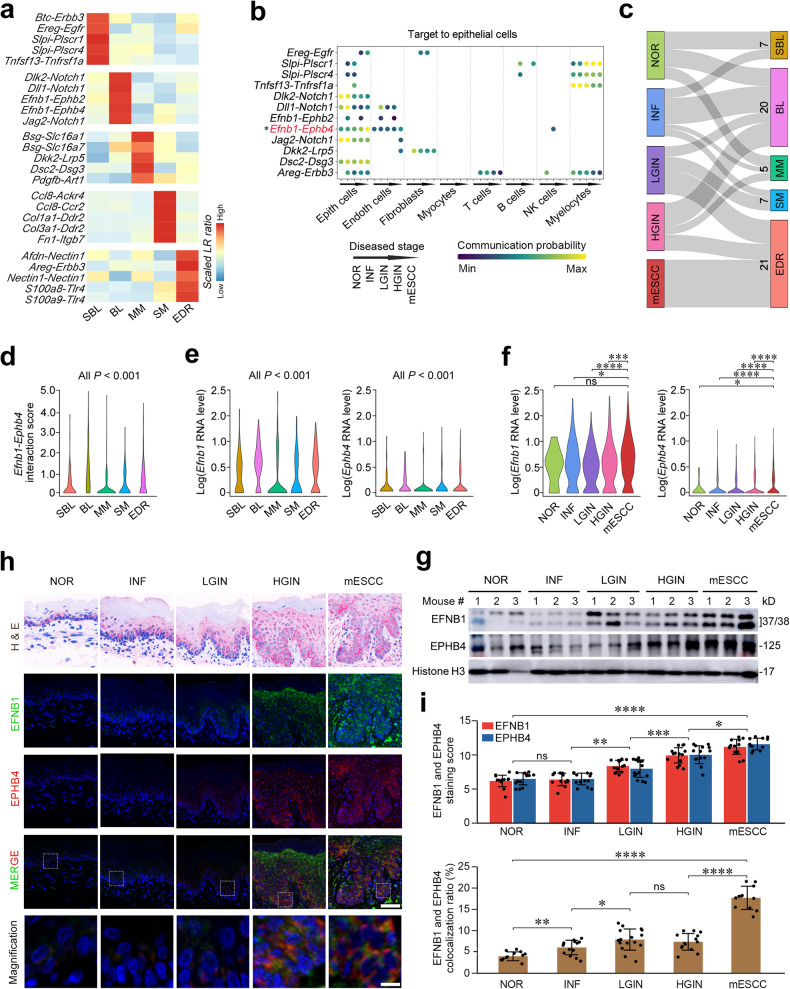
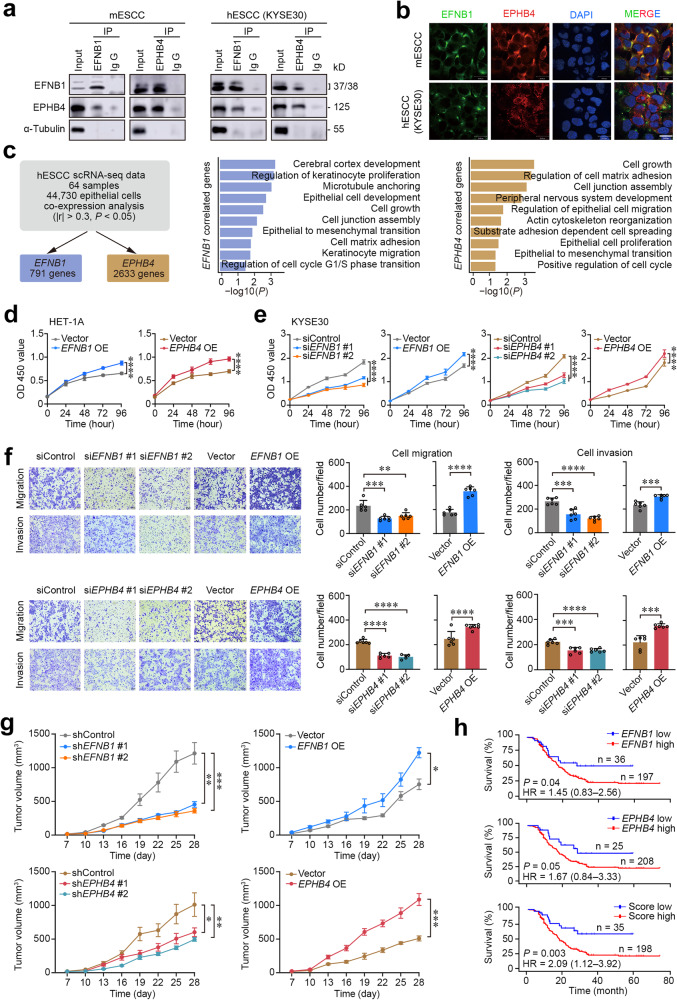
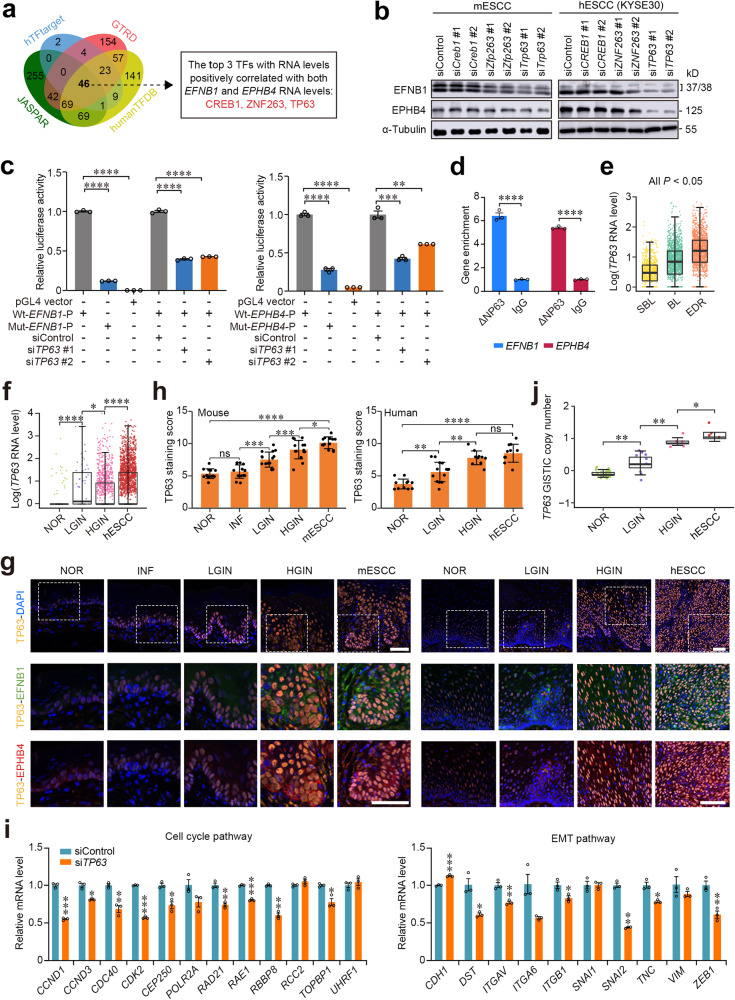
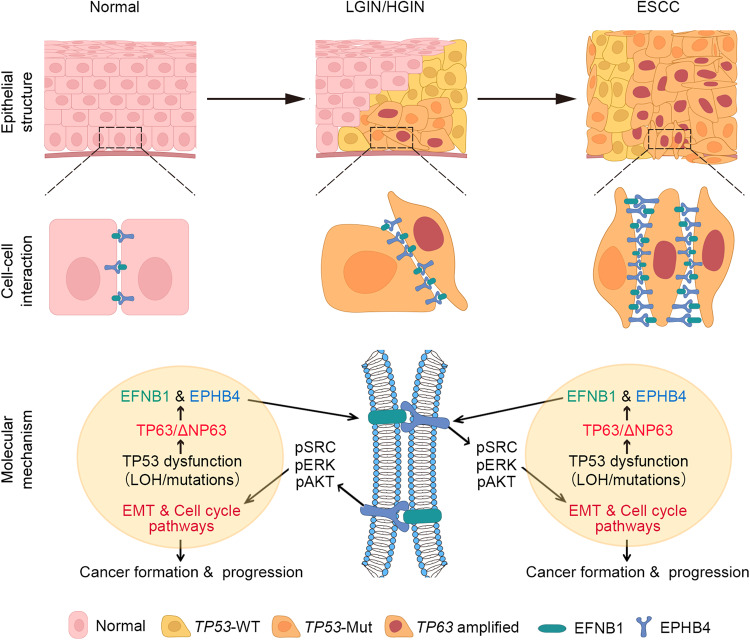
Epithelial-mesenchymal transition (EMT) and proliferation play important roles in epithelial cancer formation and progression, but what molecules and how they trigger EMT is largely unknown. Here we performed spatial transcriptomic and functional analyses on samples of multistage esophageal squamous-cell carcinoma (ESCC) from mice and humans to decipher these critical issues. By investigating spatiotemporal gene expression patterns and cell-cell interactions, we demonstrated that the aberrant epithelial cell interaction via EFNB1-EPHB4 triggers EMT and cell cycle mediated by downstream SRC/ERK/AKT signaling. The aberrant epithelial cell interaction occurs within the basal layer at early precancerous lesions, which expands to the whole epithelial layer and strengthens along the cancer development and progression. Functional analysis revealed that the aberrant EFNB1-EPHB4 interaction is caused by overexpressed ΔNP63 due to TP53 mutation, the culprit in human ESCC tumorigenesis. Our results shed new light on the role of TP53-TP63/ΔNP63-EFNB1-EPHB4 axis in EMT and cell proliferation in epithelial cancer formation.


Conflict of interest statement

The authors declare no competing interests.

Figures

Fig. 1
Fig. 1
Spatial transcriptomic analysis reveals distinct molecular regionalization in mESCC development and progression. a Scheme of the overall study design. b Graph-based clustering of mucosa-submucosa in five stage samples identified five tissue regions. Upper left: H&E staining of 5 stage samples with mucosa-submucosa and muscularis delineated by black lines. Lower left: spatial distribution of five tissue regions in each sample. Scale bar, 200 μm. Right: UMAP plot showing unbiased clustering of mucosa-submucosa spots in all five stage samples. NOR normal, INF inflammation, LGIN low-grade intraepithelial neoplasia, HGIN high-grade intraepithelial neoplasia, mESCC mouse esophageal squamous-cell carcinoma. c Stacked histogram showing the composition of five tissue regions across five stage samples. The proportion of EDR increased gradually during five stages. **P < 0.01 of Mann–Kendal trend test for different stages. d Stacked histogram showing the composition of five stages in five tissue regions. e Heatmap of scaled and normalized expression levels of the top 10 highly expressed genes in five tissue regions. f Heatmap of scaled and normalized gene set enrichment analysis (GSVA) scores for selected Gene Ontology pathways in five tissue regions. Also see Supplementary Fig. S1 and Supplementary Tables S1 and S2
Fig. 2
Fig. 2
Aberrant epithelial cell interaction via EFNB1-EPHB4 plays a role in mESCC formation. a Heatmap of proportion of tissue region-specific ligand-receptor (LR) gene pairs enriched in five tissue regions. b Bubble plot showing interaction of tissue region-specific LR gene pairs between eight cell types and epithelial cells in single-cell transcriptome data from five stage tissues (CRA002118). Each dot represented is significant (P < 0.05). Efnb1-Ephb4 interaction probability among epithelial cells is gradually and significantly elevated along mESCC progression. *P < 0.05 of Mann–Kendal trend test for different stages. c Sankey plot showing the distribution of spots with significant Efnb1-Ephb4 interaction in five tissue regions of five stage samples. d Violin plots of Efnb1-Ephb4 interaction score in five tissue regions. e Violin plots of log-normalized RNA levels of Efnb1 (left panel) and Ephb4 (right panel) in five tissue regions. BL and EDR had higher expression levels of Efnb1 and Ephb4 than the other three tissue regions. f Violin plots of log-normalized RNA levels of Efnb1 (left panel) and Ephb4 (right panel) in single-cell transcriptome data of epithelial cells in five stage samples (CRA002118). P for Wilcoxon rank-sum test in (df); *P < 0.05; ***P < 0.001; ****P < 0.0001; ns not significant. g Western blot of EFNB1 and EPHB4 in mouse esophageal tissues of different disease stages. Each stage had three samples and each blot assay had three biological repeats. h Representative immunofluorescence images of EFNB1 and EPHB4 in five disease stages showing that they were highly overexpressed in the basal layer of NOR and INF, which expanded to the whole layer along precancerous to cancerous progression. Scale bar on upper panel, 50 μm; scale bar on lower panel, 5 μm. i Upper panel: quantitative statistics of EFNB1 and EPHB4 staining scores in NOR (n = 13), INF (n = 14), LGIN (n = 16), HGIN (n = 14), and mESCC (n = 12). Data are mean ± SEM. Lower panel: quantitative statistics of EFNB1 and EPHB4 colocalization ratios in NOR (n = 13), INF (n = 14), LGIN (n = 16), HGIN (n = 14), and mESCC (n = 12). Data are mean ± SEM. Wilcoxon rank-sum test, **P < 0.01; ***P < 0.001; ****P < 0.0001 and ns not significant. NOR normal, INF inflammation, LGIN low-grade intraepithelial neoplasia, HGIN high-grade intraepithelial neoplasia, mESCC mouse esophageal squamous-cell carcinoma. Also see Supplementary Figs. S2 and S3 and Supplementary Table S3
Fig. 3
Fig. 3
Aberrant epithelial cell interaction via EFNB1-EPHB4 promotes hESCC formation. a Spatial plots showing distribution of three tissue regions in four stage samples from ESCC patients. Scale bar, 200 μm. Pt patient. b Stacked histogram showing the composition of three tissue regions across four disease stages (upper panel) and four stages across three tissue regions (lower panel). The proportion of SBL decreased gradually and significantly but the proportion of EDR increased gradually and significantly along the disease progression. *P < 0.05 of Mann–Kendal trend test. c Heatmap of scaled and normalized gene set enrichment analysis (GSVA) scores for selected Gene Ontology pathways in three tissue regions. d Sankey plot showing the distribution of spots with significant EFNB1-EPHB4 interaction in three tissue regions of four pathological stages. e EFNB1-EPHB4 interaction score in three tissue regions of four stages. Left panel: spatial plots showing that EFNB1-EPHB4 interaction score is higher in the basal layer of NOR, which expands to the whole layer along LGIN, HGIN, and hESCC. Scale bar, 200 μm. Right panel: boxplot of EFNB1-EPHB4 interaction score in three tissue regions shown is median and 25th to 75th percentile distribution with 1.5× quantile range represented by whiskers and the difference was tested by Wilcoxon rank-sum test. f Boxplots of log-normalized EFNB1 and EPHB4 RNA levels in three tissue regions. Data are median and 25th to 75th percentile distribution with 1.5× quantile range represented by whiskers. P value for Wilcoxon rank-sum test. g Bubble plot of EFNB1-EPHB4 interaction between seven cell types and epithelial cells in multistage single-cell transcriptome data (HRA000776). Each dot represented is significant (P < 0.05). EFNB1-EPHB4 interaction probability between epithelial cells elevates gradually during four pathological stages. *P < 0.05 of Mann–Kendal trend test. h Violin plots showing log-normalized EFNB1 and EPHB4 RNA levels in epithelial cells of different stage samples by scRNA-seq (HRA000776). i Representative immunofluorescence images of EFNB1 and EPHB4 in four pathological stages showing they are highly expressed in the basal layer of NOR, which expand to the whole layer as ESCC developed. Scale bar on left panel, 50 μm and on right panel, 5 μm. j Upper panel: quantitative statistics of EFNB1 and EPHB4 staining scores in NOR (n = 11), LGIN (n = 14), HGIN (n = 10), and hESCC (n = 11). Data are mean ± SEM. Lower panel: quantitative statistics of EFNB1 and EPHB4 colocalization ratios in NOR (n = 11), LGIN (n = 14), HGIN (n = 10), and hESCC (n = 11). Data are mean ± SEM. *P < 0.05; **P < 0.01; ****P < 0.0001; and ns not significant of Wilcoxon rank-sum test. k Violin plots showing log-normalized EFNB1 and EPHB4 RNA levels in epithelial cells of hESCC and normal tissues by scRNA-seq (GSE160269). The significant differences were examined by Wilcoxon rank-sum test. *P < 0.05; **P < 0.01; ***P < 0.001; ****P < 0.0001; and ns not significant. NOR normal, LGIN low-grade intraepithelial neoplasia, HGIN high-grade intraepithelial neoplasia, hESCC human esophageal squamous-cell carcinoma. Also see Supplementary Fig. S4 and Supplementary Table S4
Fig. 4
Fig. 4
Aberrant EFNB1-EPHB4 interaction enhances the malignant phenotypes of mouse and human ESCC cells. a Western blotting of immunoprecipitation products with anti-EFNB1 or anti-EPHB4 antibody in mESCC and hESCC cells (KYSE30) showing interaction between these two proteins. b Immunofluorescent staining showing colocalization of EFNB1 and EPHB4 on epithelial cell membrane in mESCC and hESCC cells. The nuclei were stained with DAPI. Scale bars, 30 μm. c Analysis of genes their expression levels were correlated with EFNB1 and EPHB4 expression levels in epithelial cells by scRNA-seq (GSE160269 data). Left panel shows the analytical scheme, and the middle and right panels show bar plots of selected terms from GO enrichment results of genes correlated with EFNB1 or EPHB4. d The effects of overexpressed EFNB1 or EPHB4 on cell proliferation of human immortalized esophageal epithelial cell line HET-1A. Each point represents mean ± SEM obtained from three independent experiments and each had six replications. ****P < 0.0001 of Student’s t-test. e The effects of forced EFNB1 or EPHB4 expression change on hESCC (KYSE30) cell proliferation. Each point represents mean ± SEM obtained from three independent experiments and each had six replications. ****P < 0.0001 of Student’s t-test. f The effects of forced EFNB1 and EPHB4 expression change on hESCC (KYSE30) cell migration and invasion. Left panel shows representative transwell images and the right panel shows quantitation statistics. Data are mean ± SEM from three independent experiments and each had two replications. Scale bar, 100 μm. **P < 0.01; ***P < 0.001; and ****P < 0.0001 of Wilcoxon rank-sum test. g The effects of forced EFNB1 and EPHB4 expression change in hESCC cells (KYSE30) on their xenograft growth in NSG mice. Tumor volumes are defined as length × width2 × 0.52. Data are mean ± SEM from five animals. *P < 0.05; **P < 0.01; and ***P < 0.001 of Student’s t-test. h Kaplan–Meier estimate of survival time in 233 ESCC patients by EFNB1, EPHB4 or EFNB1 and EPHB4 RNA levels. Hazard ratio (HR) and 95% confidence interval (CI) were computed by multivariate Cox proportional hazard models with age, sex, and tumor stage as covariates. Also see Supplementary Figs. S5 and S6 and Supplementary Table S5
Fig. 5
Fig. 5
Aberrant EFNB1-EPHB4 interaction triggers epithelial-to-mesenchymal transition and cell proliferation. a, b Qualitative PCR verification of the effects of EFNB1 (upper panel) and EPHB4 (lower panel) knockdown or overexpression (OE) on the expression alterations of genes involved in cell cycle pathway and epithelial-to-mesenchymal transition (EMT) pathway in hESCC cells (KYSE30). Data are mean ± SEM from three independent experiments. *P < 0.05; **P < 0.01; ***P < 0.001; ****P < 0.0001; and ns not significant of Wilcoxon rank-sum test. c Western blotting analysis of total and phosphorylated levels of ERK, SRC and AKT proteins in hESCC cells (KYSE30) with EFNB1 or EPHB4 knockdown or OE. Each western blot had three biological repeats. d Western blotting analysis of cell cycle markers (Cyclin D1, Cyclin D3, and CDK2) and EMT markers (Claudin-1, SLUG, and β-Catenin) in hESCC cells (KYSE30) with EFNB1 or EPHB4 knockdown or OE. Each western blot had three biological repeats. e Western blotting analysis of total and phosphorylated levels of ERK, SRC and AKT in hESCC cells (KYSE30) treated with recombinant human EFNB1 or EPHB4 inhibitor. Each western blot had three biological repeats. Also see Supplementary Fig. S7
Fig. 6
Fig. 6
Overexpression of TP63/∆NP63 during ESCC progression causes aberrant EFNB1-EPHB4 interaction. a Venn diagram showing potential transcription factors (TFs) that are positively correlated with EFNB1 and EPHB4 RNA levels in epithelial cells in scRNA-seq data (GSE160269). b The effects of knockdown of three interested TFs on EFNB1 and EPHB4 protein levels in mESCC and hESCC cells (KYSE30). Each western blot had three biological replications. c Results of reporter gene assays in hESCC cells (KYSE30). Bar plots showing the relative luciferase activity in cells transfected with the indicated reporter plasmids or siRNA. Wt, wild-type EFNB1 (left panel) or EPHB4 (right panel) promoter; Mut, mutant EFNB1 (left panel) or EPHB4 (right panel) promoter without ΔNP63 binding motif; P, promoter. Data are mean ± SEM from three independent experiments and each had three replications. **P < 0.01; ***P < 0.001; and ****P < 0.0001 of Student’s t-test. d Chromatin immunoprecipitation and qPCR showing EFNB1 and EPHB4 enrichment in the lysate of cells treated with ΔNP63 antibody. Data are mean ± SEM of three biological replications. ****P < 0.0001 of Wilcoxon rank-sum test. e The difference of TP63 RNA level in epithelial cells of different tissue regions of hESCC samples analyzed by spatial transcriptomic sequencing. f The difference of TP63 RNA level in epithelial cells of different disease stages analyzed by scRNA-seq (HRA000776 data). Data in (e) and (f) are median and 25th to 75th percentile distribution with 1.5× quantile range represented by whiskers. The differences were examined by Wilcoxon rank-sum test. *P < 0.05 and ****P < 0.0001 of Wilcoxon rank-sum test. g Representative immunofluorescence images of TP63, EFNB1 and EPHB4 in multistage tissues from mouse (left panel) and human (right panel) esophageal tissues. The colocalization signals are high in the basal layer of NOR (also INF in mice) tissues but expand to the whole layer along the disease progression. Scale bar on upper panel, 50 μm and on lower panel, 25 μm. h Quantitative statistics of TP63 staining score in NOR (n = 13), INF (n = 14), LGIN (n = 16), HGIN (n = 14), and mESCC (n = 12) of mouse tissues and in NOR (n = 11), LGIN (n = 14), HGIN (n = 10), and hESCC (n = 11) of human tissues. Data are mean ± SEM and the differences were examined by Wilcoxon rank-sum test. *P < 0.05; ***P < 0.001; ****P < 0.0001; and ns not significant. i Verification of gene expression in cell cycle pathway (left panel) and epithelial-to-mesenchymal transition (EMT) pathway (right panel) in TP63 knockdown hESCC cells (KYSE30). The mRNA levels were determined by qPCR. Data are mean ± SEM from three independent experiments. *P < 0.05; **P < 0.01; ***P < 0.001; ****P < 0.0001; and ns not significant of Student’s t-test. j GISTIC copy number of TP63 in NOR (n = 22), LGIN (n = 11), HGIN (n = 5) and hESCC (n = 4) tissue samples. Data are median and 25th to 75th percentile. *P < 0.05 and **P < 0.01 of Wilcoxon rank-sum test. SBL suprabasal layer, BL basal layer, EDR ESCC development region, NOR normal tissue, INF inflammation, LGIN low-grade intraepithelial neoplasia, HGIN high-grade intraepithelial neoplasia, hESCC human esophageal squamous-cell carcinoma. Also see Supplementary Fig. S8
Fig. 7
Fig. 7
The schematic illustration for the possible mechanism that the aberrant TP53-TP63/ΔNP63-EFNB1-EPHB4 signaling triggers EMT and accelerates cell cycle during ESCC formation and development. In epithelial cells, TP53 dysfunction due to loss of heterozygosity (LOH) and mutations causes TP63/ΔNP63 amplification and overexpression, which upregulates EFNB1 and EPHB4 expression. The overexpressed EFNB1 and EPHB4 enhance their mediated aberrant cell–cell interaction among epithelial cells, resulting in the downstream SRC/ERK/AKT signaling activation, which triggers epithelial-mesenchymal transition and accelerates cell cycle to promote ESCC formation and progression

References

    1. Abnet CC, Arnold M, Wei WQ. Epidemiology of esophageal squamous cell carcinoma. Gastroenterology. 2018;154:360–373. doi: 10.1053/j.gastro.2017.08.023. - DOI - PMC - PubMed
    1. Nagtegaal ID, et al. The 2019 WHO classification of tumours of the digestive system. Histopathology. 2020;76:182–188. doi: 10.1111/his.13975. - DOI - PMC - PubMed
    1. Wang GQ, et al. Histological precursors of oesophageal squamous cell carcinoma: results from a 13 year prospective follow up study in a high risk population. Gut. 2005;54:187–192. doi: 10.1136/gut.2004.046631. - DOI - PMC - PubMed
    1. Wei WQ, et al. Long-term follow-up of a community assignment, one-time endoscopic screening study of esophageal cancer in China. J. Clin. Oncol. 2015;33:1951–1957. doi: 10.1200/JCO.2014.58.0423. - DOI - PMC - PubMed
    1. Wei WQ, et al. Esophageal histological precursor lesions and subsequent 8.5-year cancer risk in a population-based prospective study in China. Am. J. Gastroenterol. 2020;115:1036–1044. doi: 10.14309/ajg.0000000000000640. - DOI - PMC - PubMed