. 2023 Dec 14;14(1):8120.
doi: 10.1038/s41467-023-43336-6.

Activation of ILC2s through constitutive IFNγ signaling reduction leads to spontaneous pulmonary fibrosis

Affiliations

Activation of ILC2s through constitutive IFNγ signaling reduction leads to spontaneous pulmonary fibrosis

Natsuko Otaki et al. Nat Commun. .

Abstract

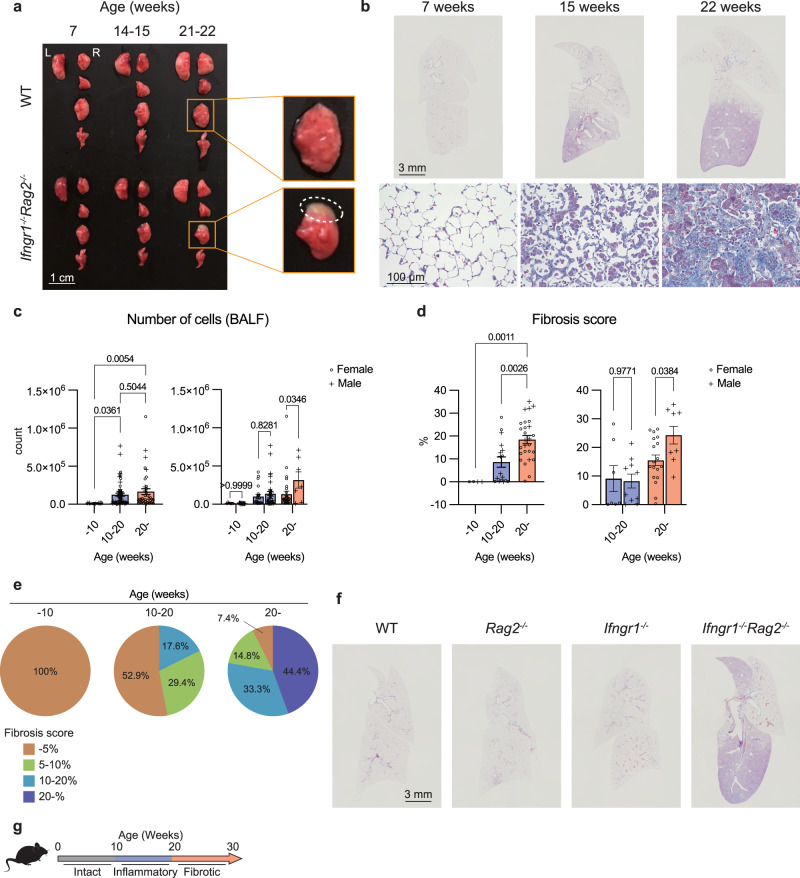
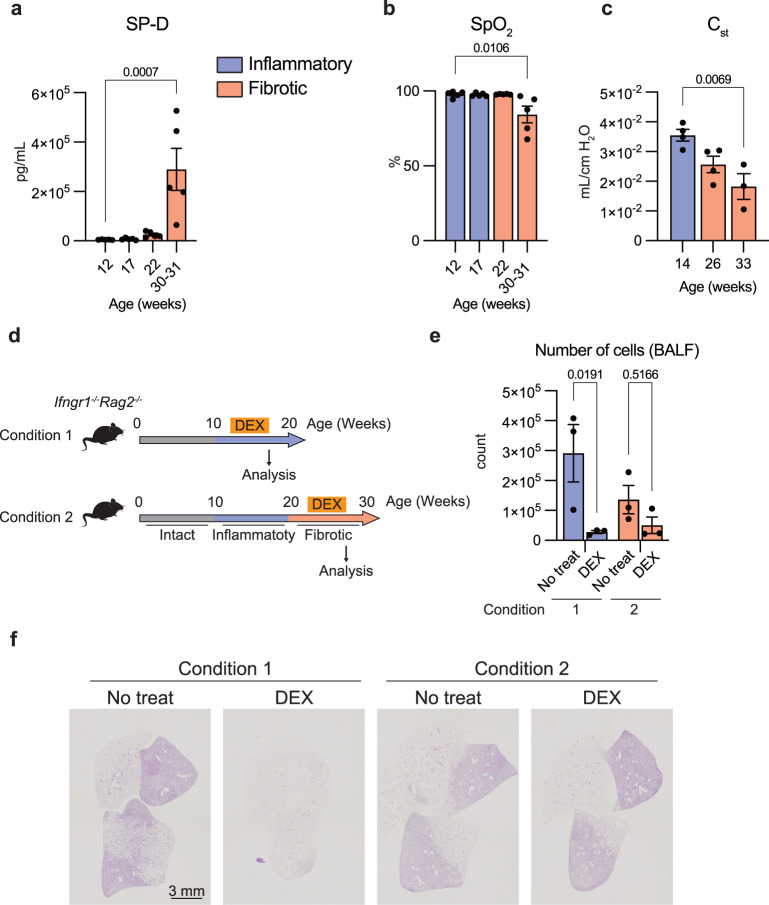
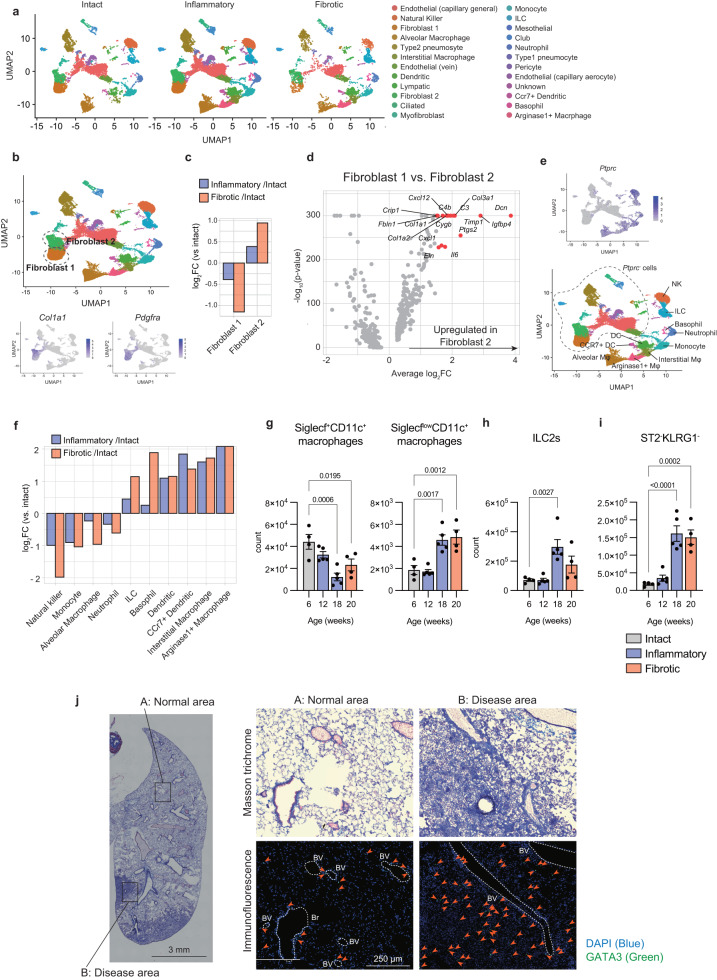
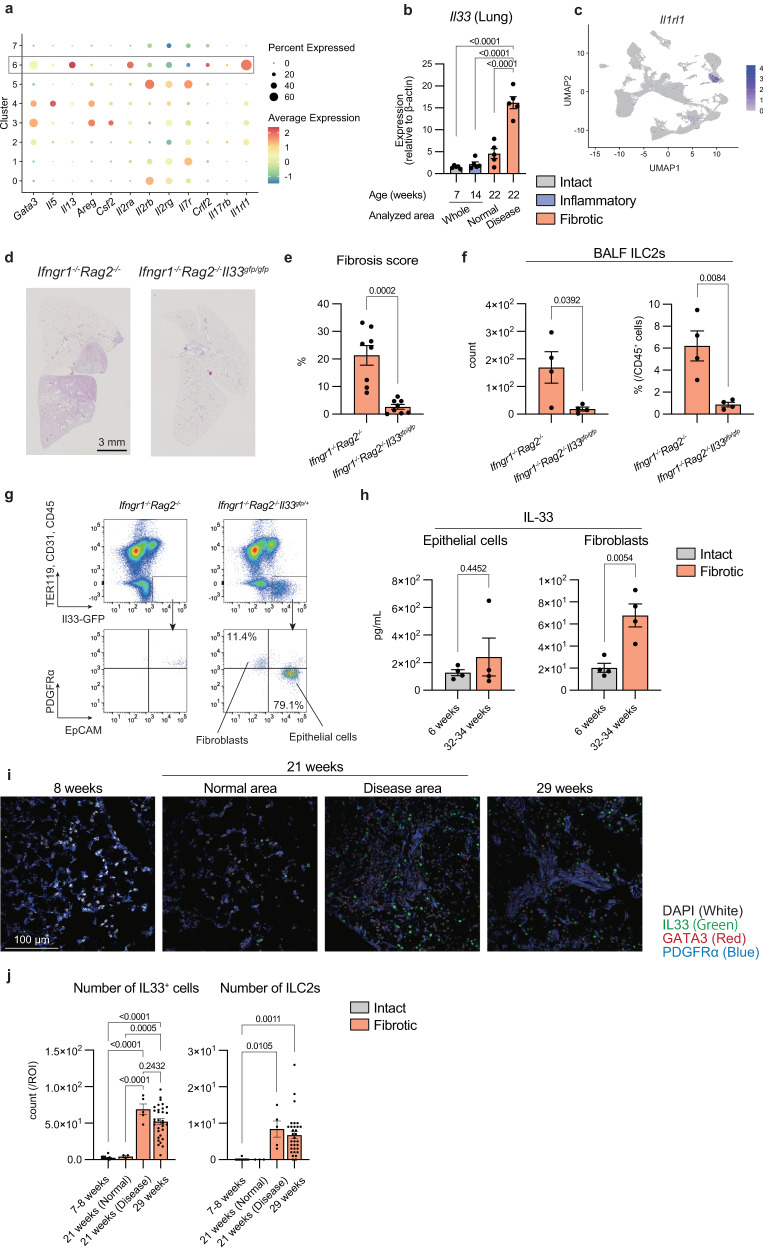
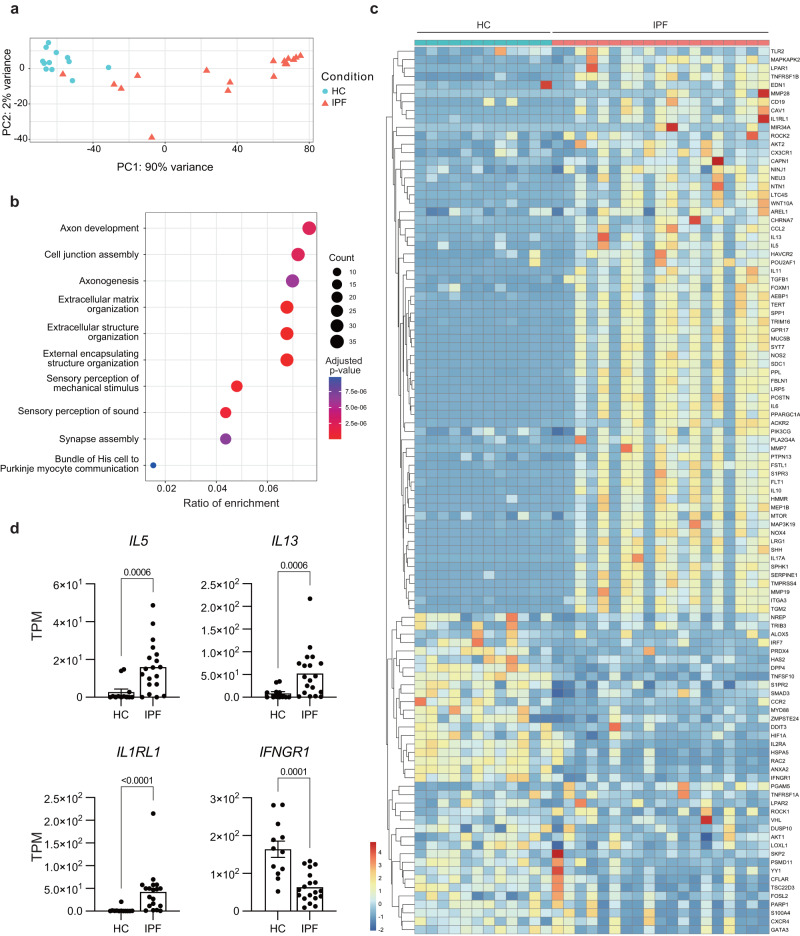
Pulmonary fibrosis (PF), a condition characterized by inflammation and collagen deposition in the alveolar interstitium, causes dyspnea and fatal outcomes. Although the bleomycin-induced PF mouse model has improved our understanding of exogenous factor-induced fibrosis, the mechanism governing endogenous factor-induced fibrosis remains unknown. Here, we find that Ifngr1-/-Rag2-/- mice, which lack the critical suppression factor for group 2 innate lymphoid cells (ILC2), develop PF spontaneously. The onset phase of fibrosis includes ILC2 subpopulations with a high Il1rl1 (IL-33 receptor) expression, and fibrosis does not develop in ILC-deficient or IL-33-deficient mice. Although ILC2s are normally localized near bronchioles and blood vessels, ILC2s are increased in fibrotic areas along with IL-33 positive fibroblasts during fibrosis. Co-culture analysis shows that activated-ILC2s directly induce collagen production from fibroblasts. Furthermore, increased IL1RL1 and decreased IFNGR1 expressions are confirmed in ILC2s from individuals with idiopathic PF, highlighting the applicability of Ifngr1-/-Rag2-/- mice as a mouse model for fibrosis research.


Conflict of interest statement

K. Moro received a grant from Astellas Pharma, Inc. All other authors declare no competing interests.

Figures

Fig. 1
Fig. 1. Ifngr1-/-Rag2-/- mice spontaneously develop PF.
a Lungs of wild-type (WT) and Ifngr1-/-Rag2-/- mice. L, left; R, right. The third right lobes are magnified. A disease area, defined as a visibly distinct white region, was indicated by a dotted circle. Scale bar: 1 cm. b Representative Masson’s trichrome (MT)-stained images of lung tissue sections from Ifngr1-/-Rag2-/- mice of the indicated ages (females). The upper images show the whole right lobes and the lower panels show magnified images. Scale bars: 3 mm (upper panels) or 100 μm (lower panels). c Quantification of the absolute number of whole bronchoalveolar lavage fluid (BALF) cells of Ifngr1-/-Rag2-/- mice of different ages using flow cytometry (n = 119 [60 females, 59 males]). The left graph includes data for all mice grouped by age, while the right graph shows data grouped by age and sex. See Supplementary Fig 1b for more information on each mouse. The results of several experiments were combined. d Fibrosis scores of Ifngr1-/-Rag2-/- mice calculated using MT-stained images of their lung tissue sections (n = 48 [27 females, 21 males]). See Supplementary Fig. 2a and the Methods section for the definition of the fibrosis score. See Supplementary Fig. 2c for more information on each mouse. The results of several experiments were combined. e The frequency of mice with the indicated fibrosis scores, shown in Fig. 2d (n = 48 [27 females, 21 males]). The frequency was calculated for each age group. f Representative MT-stained images of lung tissue sections from the indicated mouse strains, showing whole right lobes (21 weeks; males). Scale bar: 3 mm. g Schematic of the stages of disease progression. Data are representative of at least three independent experiments and are presented as the mean ± s.e.m. For statistical analysis, the following tests were used: (c, d) (left), one-way ANOVA with Tukey’s multiple comparisons tests; (c, d) (right), two-way ANOVA with Sidak’s multiple comparisons tests. For (c, d) source data are provided as a Source Data file.
Fig. 2
Fig. 2. Assessment of the pathophysiology of Ifngr1-/-Rag2-/- mice from a clinical perspective.
a Quantification of SP-D levels in the serum of Ifngr1-/-Rag2-/- mice of different ages as indicated in the graph using ELISA (n = 5/group; females). b SpO2 of Ifngr1-/-Rag2-/- mice of different ages as indicated in the graph (n = 5/group; females). c Quantification of the Cst of Ifngr1-/-Rag2-/- mice of different ages (14 and 26 weeks: n = 4/group; females, 33 weeks: n = 3/group; females). See the Methods section for the formula and the parameter of Cst. df Dexamethasone treatment of Ifngr1-/-Rag2-/- mice. DEX, dexamethasone. d Schematic of the experiment. Ifngr1-/-Rag2-/- mice were administered dexamethasone (3 mg·kg-1/day) with a micro-osmotic pump implanted in the subcutaneous pockets under the back skin of mice either from 14 to 18 weeks (inflammation phase) or from 23 to 28 weeks old (fibrosis phase) (n = 3/group; females). e Quantification of the absolute number of whole BALF cells of Ifngr1-/-Rag2-/- mice by flow cytometry (n = 3/group; females). f Representative MT-stained images of lung tissue sections from Ifngr1-/-Rag2-/- mice of each condition, showing the whole right lobes. Scale bar: 3 mm. Data, except for (c) are representative of at least three independent experiments and are presented as the mean ± s.e.m. For statistical analysis, the following tests were used: (ac) one-way ANOVA with Dunnett’s multiple comparisons tests; (e) two-way ANOVA with Sidak’s multiple comparisons tests. For (a, b, ce) source data are provided as a Source Data file.
Fig. 3
Fig. 3. ILC2s and ST2-KLRG1- cells increase with PF progression.
af scRNA-seq of whole lung cells from Rag2-/- mice (18 weeks old) and Ifngr1-/-Rag2-/- mice (7, 12, 16, 19, and 24 weeks old) (n = 2/group; females). a Unsupervised clustering of the combined data set plotted on UMAP (Uniform Manifold Approximation and Projection), divided by each phase, and colored according to the identified cell types. b All the cells of the combined data set are plotted on UMAP. The clusters defined as Fibroblast 1 and Fibroblast 2 are indicated by dotted circles. The lower panels show the expression of Col1a1 and Pdgfra. c Relative abundance of Fibroblast 1 and Fibroblast 2 in Ptprc- clusters, compared to that in the intact phase. d Volcano plot of differentially expressed genes (|log2[fold change]| > 0.25) between Fibroblast 1 and Fibroblast 2. Upregulated genes (log2[fold change] > 1.5; P < 10-150) are highlighted in red. e The upper panel shows the expression of Ptprc. The lower panel shows the identified immune cells. f Relative abundance of the indicated cell types in Ptprc+ clusters, compared to the intact phase. gi Flow cytometry analysis of the lungs of Ifngr1-/-Rag2-/- mice of different ages as indicated (6 and 20 weeks: n = 4/group; 12 and 18 weeks: n = 5/group; females). Quantification of the absolute number of indicated cells of lungs in each phase. j MT and immunofluorescence staining images of the whole right lung lobes of Ifngr1-/-Rag2-/- mice (24 weeks; male). The areas enclosed by the squares in the left panel are enlarged and shown in the right panels (A: normal area, and B: disease area). The arrows indicate Gata3-positive cells. The dotted lines indicate blood vessels or bronchi. BV, blood vessel; Br, bronchus. Blue, DAPI; Green, Gata3. Scale bars: 3 mm (left panel) or 250 μm (right panels). Data are representative of at least three independent experiments and are presented as the mean ± s.e.m. For statistical analysis, the following tests were used: d two-sided Wilcoxon Rank Sum test with the Bonferroni method. gi one-way ANOVA with Dunnett’s multiple comparisons tests. For (g, h, i) source data are provided as a Source Data file.
Fig. 4
Fig. 4. ILCs are indispensable for PF progression.
a Representative MT-stained images of lung tissue sections of the indicated mice, showing the whole right lobes (Ifngr1-/-Rag2-/- mice: 27 weeks; male, Ifngr1-/-Il2rg-/-Rag2-/- mice: 27 weeks; female). Scale bar: 3 mm. b Fibrosis scores calculated using MT-stained images of lung tissue sections from the indicated mice (Ifngr1-/-Il2rg-/-Rag2-/- mice: n = 10/group [4 at 21 weeks, 1 at 23 weeks, 3 at 27 weeks, 1 at 28 weeks, 1 at 46 weeks]; 9 females and 1 male, Ifngr1-/-Rag2-/- mice: n = 10/group [1 at 22 weeks, 5 at 23 weeks, 1 at 25 weeks, 2 at 26 weeks, 1 at 27 weeks]; 5 females and 5 males). ce Bone marrow transfer (BMT) experiment. See the Methods section and Supplementary Fig. 6 for details (n = 4/group; females). c Representative MT-stained images of lung tissue sections of mice with each condition, showing the whole right lobes. Scale bar: 3 mm. d Fibrosis scores were calculated using MT-stained images of lung tissue sections of mice from each condition. The results of four experiments were integrated to calculate the scores. e Quantification of the absolute number of the indicated cells in the lungs of mice with each condition by flow cytometry. f The expression of Thy-1 in all lung cells. gi Depletion of ILCs using anti-Thy-1 antibodies. g Schematic of the experiment. Ifngr1-/-Rag2-/- mice were intraperitoneally administered anti-Thy-1 antibodies (clone: 30H12) (200 μg/head per shot) every 3 days for 6 weeks (12 weeks old at the start of administration, n = 3/group; females). h Representative MT-stained images of lung tissue sections of mice in each condition, showing the whole right lobes. Scale bar: 3 mm. i Fibrosis scores were calculated using MT-stained images of lung tissue sections of mice in each condition. The results of two experiments were integrated to calculate the scores. Data are representative of at least three independent experiments and are presented as the mean ± s.e.m. For statistical analysis, the following tests were used: (bd, ei) two-tailed unpaired Student’s t-tests. For (bd, ei) source data are provided as a Source Data file.
Fig. 5
Fig. 5. ILC2s and ILC3s subpopulations increase with PF progression.
ae Clusters identified as ILCs were extracted from all lung cells in the scRNA-seq data shown in Fig. 3, on which unsupervised clustering was performed. a Unsupervised clustering of ILCs plotted on UMAP and colored according to each cluster. b Violin plots of the ILC1, ILC2, and ILC3 scores of each cluster, calculated from the average expression levels of signature genes of each population. c The expression of Tbx21, Gata3, and Rorc in ILCs. d The upper panel shows an unsupervised clustering of ILCs plotted on UMAP divided by each phase. The dotted circles show clusters 1 and 6. The lower panel shows the relative abundance of each cluster in ILCs compared to the intact phase. e The expression of Thy-1, Il1rl1, and Klrg1 in ILCs. f Quantification of the absolute number and ratio of lung ILC3-like cells in the indicated mice by flow cytometry (17 weeks for Ifngr1-/-Rag2-/- mice and 19 weeks old for Ifngr1-/-Rorc-/-Rag2-/- mice, n = 5/group; males). g Representative MT-stained images of lung tissue sections of the indicated mice, showing the whole right lobes. Scale bar: 3 mm. h Fibrosis scores were calculated using MT-stained images of lung tissue sections from the indicated mice (Ifngr1-/-Rorc-/-Rag2-/- mice: n = 7/group [2 at 21 weeks, 2 at 24 weeks, 2 at 34 weeks, 1 at 37 weeks]; 6 females and 1 male, Ifngr1-/-Rag2-/- mice: n = 7/group [3 at 21 weeks, 1 at 22 weeks, 2 at 21 weeks, 1 at 22 weeks, 4 at 23 weeks]; 3 females and 4 males). i Quantification of the absolute number and ratio of both lung and BALF ILC2s of the indicated mice by flow cytometry (17 weeks for Ifngr1-/-Rag2-/- mice and 19 weeks for Ifngr1-/-Rorc-/-Rag2-/- mice; n = 5/group; males). Data are representative of at least three independent experiments and are presented as the mean ± s.e.m. For statistical analysis, the following tests were used: (fh, i) two-tailed unpaired Student’s t-tests. For (fh, i) source data are provided as a Source Data file.
Fig. 6
Fig. 6. IL-33-mediated activation of ILC2s is indispensable for PF progression.
a Dot plot of sub-clustered ILC subsets showing the ILC2-related genes. Cluster 6 is highlighted. b mRNA expression of Il33 in the lungs of Ifngr1-/-Rag2-/- mice quantified by RT-qPCR. See the Methods section for details (n = 5/group; males). c The expression of Il1rl1 in all lung cells. d Representative MT-stained images of lung tissue sections, showing the whole right lobes. Scale bar: 3 mm. e Fibrosis scores were calculated using MT-stained images of lung tissue sections. The results of several experiments were combined. See the Methods section for details (Ifngr1-/- Rag2-/-Il33gfp/gfp mice: n = 8/group [2 at 22 weeks, 1 at 23 weeks, 1 at 24 weeks, 3 at 25 weeks, 1 at 36 weeks]; 4 females and 4 males, Ifngr1-/-Rag2-/- mice: n = 8/group [2 at 21 weeks, 1 at 22 weeks, 4 at 23 weeks, 1 at 27 weeks]; 4 females and 4 males). f Quantification of the absolute number and ratio of BALF ILC2s by flow cytometry (n = 4/group [Ifngr1-/-Rag2-/- mice: 4 at 24  weeks, Ifngr1-/- Rag2-/-Il33gfp/gfp mice: 1 at 24 weeks, 3 at 23 weeks]; females). g Representative flow cytometry plot of the lung cells. h Quantification of IL-33 in both epithelial cells and fibroblasts sorted from the lungs of Ifngr1-/-Rag2-/- mice of different ages using ELISA (n = 4/group; males). i, j Immunofluorescence staining of the lungs of Ifngr1-/-Rag2-/- mice (n = 1/group; males). i Representative immunofluorescence staining images of the lungs of Ifngr1-/-Rag2-/- mice. White, DAPI; Green, IL-33; Red, Gata3; Blue, PDGFRα. Scale bar: 100 μm. j Quantification of the number of IL33+ cells and ILC2s (defined by GATA3+ expression) per image. See Supplementary Fig. 8e for details on the analysis process. Data are representative of at least three independent experiments and are presented as the mean ± s.e.m. For statistical analysis, the following tests were used: (e, fh) two-tailed unpaired Student’s t-tests; (bj) one-way ANOVA with Tukey’s multiple comparisons tests. For (be, fhj) source data are provided as a Source Data file.
Fig. 7
Fig. 7. IL-33-activated ILC2s upregulate collagen production from fibroblasts.
a, b ILC2s and fibroblasts were sorted from WT mice on day 0 and were co-cultured (ILC2s, 5000 cells/well; fibroblasts, 20,000 cells/well; IL-2, -7, and -33, 10 ng·mL−1) under the indicated conditions. On day 5, ILC2s were washed out, and fibroblasts were stained with Sirius red. Cells sorted from 10 mice were combined and seeded into four separate wells. This experiment was repeated multiple times, consistently yielding similar results in each iteration. a Representative images of Sirius red staining in the indicated conditions. Scale bar: 200 μm. b Absorption rate of the eluted Sirius red (n = 4 wells /condition). Fi, fibroblasts. Data are representative of at least three independent experiments and are presented as the mean ± s.e.m. For statistical analysis, the following tests were used: (b) one-way ANOVA with Tukey’s multiple comparisons tests. For (b) source data are provided as a Source Data file.
Fig. 8
Fig. 8. ILC2s from individuals with IPF show a similar phenotype to ILC2s from Ifngr1-/-Rag2-/- mice.
ad RNA-seq of peripheral blood ILC2s sorted from 12 healthy volunteers and 19 patients with IPF. a Principal component analysis (PCA) of each sample. HC: healthy control. b Gene ontology enrichment analysis of the highly expressed genes in ILC2s from patients with IPF compared to those from healthy controls (log2[fold change] > 5; P < 10-25). c Heatmap of z-scores of the transcripts per kilobase million (TPM values) of fibrosis-related genes. HC: healthy control. d The TPM values of the indicated genes of ILC2s from healthy controls and patients with IPF. HC: healthy control. Data are presented as the mean ± s.e.m. For statistical analysis, the following tests were used: (b) over representation analysis (ORA), which corresponds to a one-sided Fisher’s exact test, with the Benjamini–Hochberg method. d Two-sided Mann-Whitney test. For (d) source data are provided as a Source Data file.

References

    1. Kabata H, Moro K, Koyasu S. The group 2 innate lymphoid cell (ILC2) regulatory network and its underlying mechanisms. Immunol. Rev. 2018;286:37–52. doi: 10.1111/imr.12706. - DOI - PubMed
    1. Vivier E, et al. Innate lymphoid cells: 10 years on. Cell. 2018;174:1054–1066. doi: 10.1016/j.cell.2018.07.017. - DOI - PubMed
    1. Morita H, Moro K, Koyasu S. Innate lymphoid cells in allergic and nonallergic inflammation. J. Allerg. Clin. Immunol. 2016;138:1253–1264. doi: 10.1016/j.jaci.2016.09.011. - DOI - PubMed
    1. Moro K, et al. Interferon and IL-27 antagonize the function of group 2 innate lymphoid cells and type 2 innate immune responses. Nat. Immunol. 2016;17:76–86. doi: 10.1038/ni.3309. - DOI - PubMed
    1. Roediger B, et al. IL-2 is a critical regulator of group 2 innate lymphoid cell function during pulmonary inflammation. J. Allerg. Clin. Immunol. 2015;136:1653–1663.e7. doi: 10.1016/j.jaci.2015.03.043. - DOI - PubMed

Publication types

Associated data