. 2023 Dec 14;14(1):8210.
doi: 10.1038/s41467-023-43448-z.

Identification of inulin-responsive bacteria in the gut microbiota via multi-modal activity-based sorting

Affiliations

Identification of inulin-responsive bacteria in the gut microbiota via multi-modal activity-based sorting

Alessandra Riva et al. Nat Commun. .

Abstract

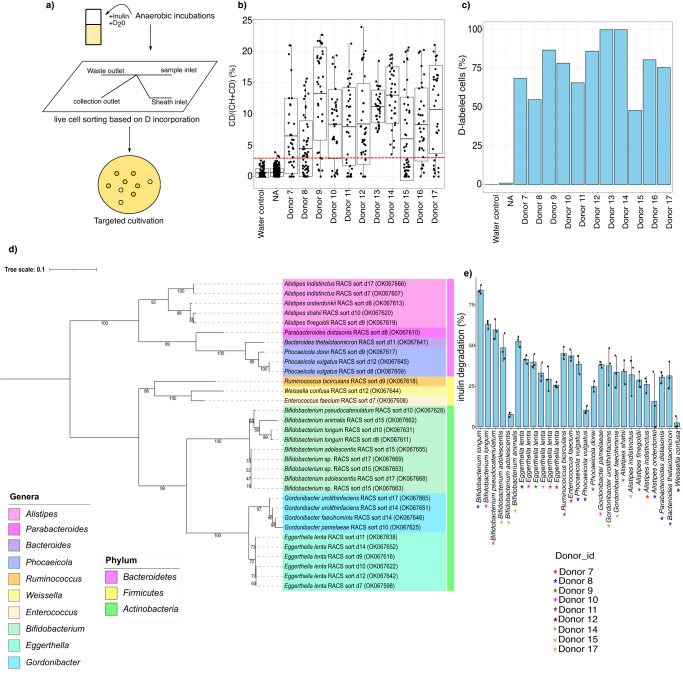
Prebiotics are defined as non-digestible dietary components that promote the growth of beneficial gut microorganisms. In many cases, however, this capability is not systematically evaluated. Here, we develop a methodology for determining prebiotic-responsive bacteria using the popular dietary supplement inulin. We first identify microbes with a capacity to bind inulin using mesoporous silica nanoparticles functionalized with inulin. 16S rRNA gene amplicon sequencing of sorted cells revealed that the ability to bind inulin was widespread in the microbiota. We further evaluate which taxa are metabolically stimulated by inulin and find that diverse taxa from the phyla Firmicutes and Actinobacteria respond to inulin, and several isolates of these taxa can degrade inulin. Incubation with another prebiotic, xylooligosaccharides (XOS), in contrast, shows a more robust bifidogenic effect. Interestingly, the Coriobacteriia Eggerthella lenta and Gordonibacter urolithinfaciens are indirectly stimulated by the inulin degradation process, expanding our knowledge of inulin-responsive bacteria.


Conflict of interest statement

The authors declare no competing interests.

Figures

Fig. 1
Fig. 1. Inulin-binding taxa in the gut microbiota.
a Experimental design: After 1 h of anaerobic incubation of human stool samples with mesoporous silica nanoparticles (MSNs, scanning electron microscopy micrograph of MSNs is shown on the left), structured illumination microscopy fluorescence image revealed the interaction between bacteria (DAPI = red) and MSNs (rhodamine = blue). Subsequently, the bacteria bound to MSNs were sorted with fluorescence-activated cell sorting (FACS) and profiled with 16S rRNA gene amplicon sequencing. Colors refer to different bacterial taxa. b Log2 fold changes for each donor are shown at the genus level. Bubble size indicates relative abundance in the starting sample. Asterisks indicate significantly enriched taxa after supplementation with inulin-grafted MSN, as calculated with the Wald test (2-sided, p < 0.05, n = 108 samples). Genera with relative abundance >0.5% were considered. Hydrophobic and hydrophilic refers to the type of MSNs used. Source data are provided as a Source Data file.
Fig. 2
Fig. 2. Translationally active community after inulin supplementation.
a Eleven fresh stool samples were incubated anaerobically in the presence of the prebiotic inulin. The 11 donors were different from the 6 donors enrolled for the MSN experiment. After 6 h, translationally active cells were sorted with BONCAT-FACS based on Cy5 fluorescence signals (pink). Color code refers to different bacteria taxa and stars represent translationally active fraction sorted. b Log2 fold changes for each donor are shown at the genus level. Bubble size indicates relative abundance in the starting sample. Asterisks indicate significantly enriched taxa after supplementation with inulin, as calculated with the Wald test (2-sided, p < 0.05, n = 33 samples). Genera with relative abundance >0.5% were considered. Source data are provided as a Source Data file.
Fig. 3
Fig. 3. RACS isolated strains are involved in inulin degradation.
a Experimental design. b Percentage of active cells measured by Raman microspectroscopy. The x-axis represents stool samples collected from 11 donors and incubated for 6 h in D2O-containing media in the presence of inulin. The y-axis shows the level of D incorporation of randomly selected cells, as quantified by %CD. Each dot represents a random single-cell measurement (water control: n = 76 cells, nothing added NA: n = 313 cells, donor 7: n = 35 cells, donor 8: n = 62 cells, donor 9: n = 38 cells, donor 10: n = 37 cells, donor 11: n = 35 cells, donor 12: n = 36 cells, donor 13: n = 33 cells, donor 14: n = 35 cells, donor 15: n = 48 cells, donor 16: n = 36 cells, donor 17: n = 37 cells). The red dashed line at 2.75% indicates the threshold for considering a cell labeled. It was determined by calculating the mean +3 sd of %CD in randomly selected cells from a stool sample incubated without the addition of D2O (water control). Boxplot: boxplot medians (center lines), interquartile ranges (box ranges), whisker ranges. c Percentage of cells labeled (i.e., with %CD higher than threshold) per donor. d Phylogenetic analysis of representative strains isolated with RACS (OK067598-OK067669). Representative strains were selected as unique species isolated from each donor. The tree was generated with the maximum likelihood algorithm using IQtree, with the optimal model identified by modelFinder as K2P+I+G4 and rooted at mid-point. Each color in the tree denotes the different genera isolated and each color code represented as a color strip shows the different phyla (Bacteroidetes: pink, Firmicutes: yellow, Actinobacteria: green). e Inulin degradation of RACS isolates measured as the percentage of inulin degraded by each strain after incubation in inulin-supplemented media (YCFA-IN). Strains were sampled in the early stationary phase. Donors are underlined as colored asterisks in the figure. Triplicates measurements are shown. Error bars represent the standard deviation of the mean. Source data are provided as a Source Data file.
Fig. 4
Fig. 4. Translationally active community and RACS isolated strains after XOS supplementation.
a BONCAT-FACS: log2 fold changes for each donor are shown at the genus level. Bubble size indicates relative abundance in the starting sample. Asterisks indicate significantly enriched taxa after supplementation with XOS, as calculated with the Wald test (2-sided, p < 0.05, n = 36 samples). Genera with relative abundance >0.5% were considered. b Example of fluorescence microscopy images showing BONCAT-positive cells (pink, Cy5) after 6 h incubation with XOS. All cells are stained with DAPI (blue). c No amendment control shows no BONCAT signal. Both images were recorded using identical settings, and imaging was performed for all 6 donors. d Percentage of active cells measured by Raman microspectroscopy. The x-axis represents 6 stool samples collected from 6 donors and incubated for 6 h in D2O-containing media in the presence of XOS. The y-axis represents the level of D incorporation of randomly selected cells measured by %CD. Each dot represents a random single-cell measurement (water control: n = 40 cells, donor 18 nothing added (NA): n = 40 cells, donor 18: n = 40 cells, donor 19 NA: n = 30 cells, donor 19: n = 40 cells, donor 20 NA: n = 40 cells, donor 20: n = 40 cells, donor 21 NA: n = 40 cells, donor 21: n = 40 cells, donor 22 NA: n = 40 cells, donor 22: n = 40 cells, donor 23 NA: n = 40 cells, donor 23: n = 40 cells). The red dashed line at 2.55% indicates the threshold for considering a cell labeled. Boxplot: boxplot medians (center lines), interquartile ranges (box ranges), whisker ranges. e Phylogenetic analysis of representative strains isolated with RACS after XOS supplementation (OP183499-OP183547). The tree was generated with the maximum likelihood algorithm using IQtree, with the optimal model identified by modelFinder as TN+F+G4 and rooted at mid-point. Each color in the tree denotes the different genera isolated and each color code represented as a color strip shows the different phyla. Source data are provided as a Source Data file.

References

    1. Porter NT, Martens EC. The critical roles of polysaccharides in gut microbial ecology and physiology. Annu. Rev. Microbiol. 2017;71:349–369. doi: 10.1146/annurev-micro-102215-095316. - DOI - PubMed
    1. Holscher HD. Dietary fiber and prebiotics and the gastrointestinal microbiota. Gut Microbes. 2017;8:172–184. doi: 10.1080/19490976.2017.1290756. - DOI - PMC - PubMed
    1. Gibson GR, Roberfroid MB. Dietary modulation of the human colonic microbiota: introducing the concept of prebiotics. J. Nutr. 1995;125:1401–1412. doi: 10.1093/jn/125.6.1401. - DOI - PubMed
    1. Gibson GR, et al. Expert consensus document: the International Scientific Association for Probiotics and Prebiotics (ISAPP) consensus statement on the definition and scope of prebiotics. Nat. Rev. Gastroenterol. Hepatol. 2017;14:491–502. doi: 10.1038/nrgastro.2017.75. - DOI - PubMed
    1. Slavin J. Fiber and prebiotics: mechanisms and health benefits. Nutrients. 2013;5:1417–1435. doi: 10.3390/nu5041417. - DOI - PMC - PubMed

Publication types

Associated data