. 2023 Dec 14;14(1):8328.
doi: 10.1038/s41467-023-43168-4.

A computational toolbox for the assembly yield of complex and heterogeneous structures

Affiliations

A computational toolbox for the assembly yield of complex and heterogeneous structures

Agnese I Curatolo et al. Nat Commun. .

Abstract

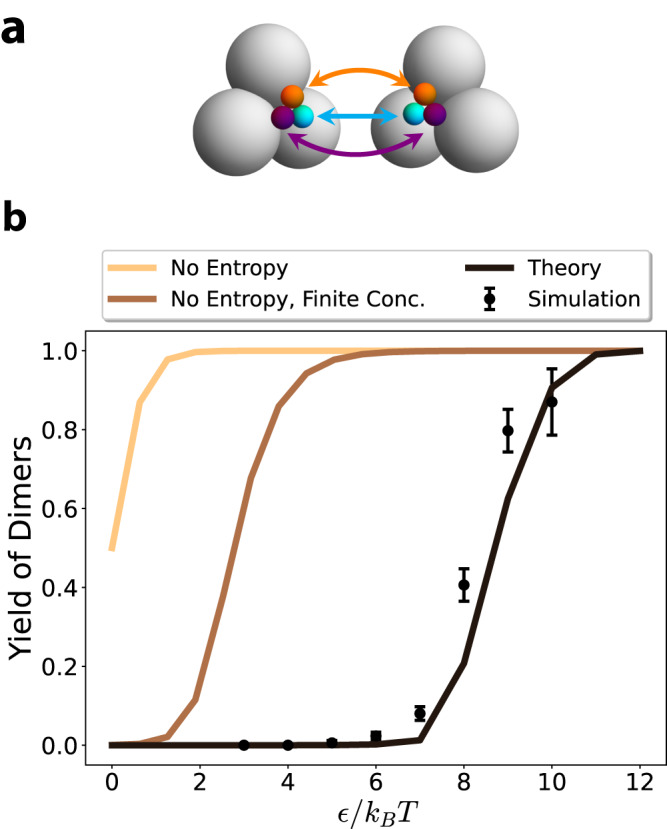
The self-assembly of complex structures from a set of non-identical building blocks is a hallmark of soft matter and biological systems, including protein complexes, colloidal clusters, and DNA-based assemblies. Predicting the dependence of the equilibrium assembly yield on the concentrations and interaction energies of building blocks is highly challenging, owing to the difficulty of computing the entropic contributions to the free energy of the many structures that compete with the ground state configuration. While these calculations yield well known results for spherically symmetric building blocks, they do not hold when the building blocks have internal rotational degrees of freedom. Here we present an approach for solving this problem that works with arbitrary building blocks, including proteins with known structure and complex colloidal building blocks. Our algorithm combines classical statistical mechanics with recently developed computational tools for automatic differentiation. Automatic differentiation allows efficient evaluation of equilibrium averages over configurations that would otherwise be intractable. We demonstrate the validity of our framework by comparison to molecular dynamics simulations of simple examples, and apply it to calculate the yield curves for known protein complexes and for the assembly of colloidal shells.


Conflict of interest statement

The authors declare no competing interests.

Figures

Fig. 1
Fig. 1. Overview of the analysis procedure.
We depict the process by which we predict assembly yield as a functions of system parameters, using the TRAP protein complex as an example. Starting with a given complex (here, a PDB file), we generate a coarse-grained model (here, each amino acid is replaced by a sphere). We specify the contacts at the various binding interfaces and their strengths (here, using patches at the interfaces). We then enumerate all possible structures that can form (in this case, 3 monomers, 3 dimers, 1 trimer). Finally, we compute the partition function for each structure as described in this work, and compute the expected yields of each structure as a function of system parameters. The true yield curves for the TRAP protein complex are shown in Fig. 4.
Fig. 2
Fig. 2. Toy model for self-assembly of non-spherically symmetric building blocks.
a The two monomer types are shown; each colored patch of the first monomer is attracted by the corresponding colored patch of the second monomer by a Morse potential (see “Methods—Details of the pair potential”). The total attractive potential of the cluster is given by E0 = 3Eb where Eb is the strength of each patch. b Comparison between theoretical and simulation yield for the dimeric state (when the two monomers are attached to each other). The number of building blocks of each type is N1 = N2 = 9 and the volume of the system is V = 18, 000d3 where d = 1 is the diameter of the gray spheres. The interaction range was set to 8/α = 8d/5. Error bars represent standard error over n = 10 simulations, where the error is measured relative to the mean. The theoretical yield shown is computed in the canonical ensemble (see Supplemental section E). All simulations were performed in the HOOMD-blue simulation package.
Fig. 3
Fig. 3. Model and results for the PFL complex.
a Coarse grained model for proteins A (orange) and B (cyan) of the PFL complex. Left and right depict the monomeric and the dimeric complexes, respectively. The residues highlighted at the interface are the patches we put as contacts. The total strength of the AB interface is EAB = ϵpAB where pAB=bpAB(b)=2.4 in the units of ref. and ϵ is a proportionality constant that converts between these units and kBT. b Plot showing the yield curves of the dimeric state as a function of the energy. Different colors correspond to different concentrations, here expressed in units of d−3 where d is the diameter of each sphere representing an amino acid. Source data are provided as a Source data file.
Fig. 4
Fig. 4. Model and results for the TRAP complex.
a Coarse grained model for proteins M (purple), N (cyan) and O (orange) of the TRAP complex. Left, center and right depict the monomeric, the MN dimeric and the trimeric complexes, respectively. The total strengths of the three interfaces are pMN = 15.7, pMO = 1.9 and pNO = 6.7. b We show the concentrations of the three structures which include the building block M as a function of the interaction energy. The concentrations are normalized by the total input concentration of M, cMtot, which was set equal to the input concentration of the other two monomers. Different colors correspond to different total concentrations cMtot (in units of d−3). When the temperature is appropriately tuned, we observe an intermediate state between the formation of only monomers and only trimers, corresponding to high yield of the dimer MN. c The relative concentrations of monomers M, dimers MN and MO and trimer MNO are reported for different values of DX (see main text) with fixed ϵ = 4 kBT and total concentration of monomers cMtot=105d3. Source data are provided as a Source data file.
Fig. 5
Fig. 5. The yield of spherical cages.
a An instance of each N-mer, from monomer (dashed square) to 60-mer (full square). Each pair of spheres interacts via a smoothed Morse potential with parameters α = 5R−1, r0 = 0.46R, rcut = 0.75R, where R is the radius of the full cage. For each intermediate, the total energy is equal to the sum of the pair potentials of all pairs of spheres, multiplied by the prefactor ϵ. b Yield curves for monomers and 60-mers at different concentrations (in units of R−3). No intermediate state was prevalent within the observed parameters range. Source data are provided as a Source data file.

References

    1. Mirkin CA, Letsinger RL, Mucic RC, Storhoff JJ. A DNA-based method for rationally assembling nanoparticles into macroscopic materials. Nature. 1996;382:3. doi: 10.1038/382607a0. - DOI - PubMed
    1. Wei B, Dai M, Yin P. Complex shapes self-assembled from single-stranded DNA tiles. Nature. 2012;485:623. doi: 10.1038/nature11075. - DOI - PMC - PubMed
    1. Ke Y, Ong LL, Shih WM, Yin P. Three-dimensional structures self-assembled from DNA bricks. Science. 2012;338:1177. doi: 10.1126/science.1227268. - DOI - PMC - PubMed
    1. King NP, et al. Computational design of self-assembling protein nanomaterials with atomic level accuracy. Science. 2012;828:1171. doi: 10.1126/science.1219364. - DOI - PMC - PubMed
    1. Lai YT, King NP, Yeates TO. Principles for designing ordered protein assemblies. Trends Cell Biol. 2012;22:653. doi: 10.1016/j.tcb.2012.08.004. - DOI - PubMed