. 2023 Dec 14;14(1):8316.
doi: 10.1038/s41467-023-43896-7.

Atherosclerotic plaque development in mice is enhanced by myeloid ZEB1 downregulation

Affiliations

Atherosclerotic plaque development in mice is enhanced by myeloid ZEB1 downregulation

M C Martinez-Campanario et al. Nat Commun. .

Abstract

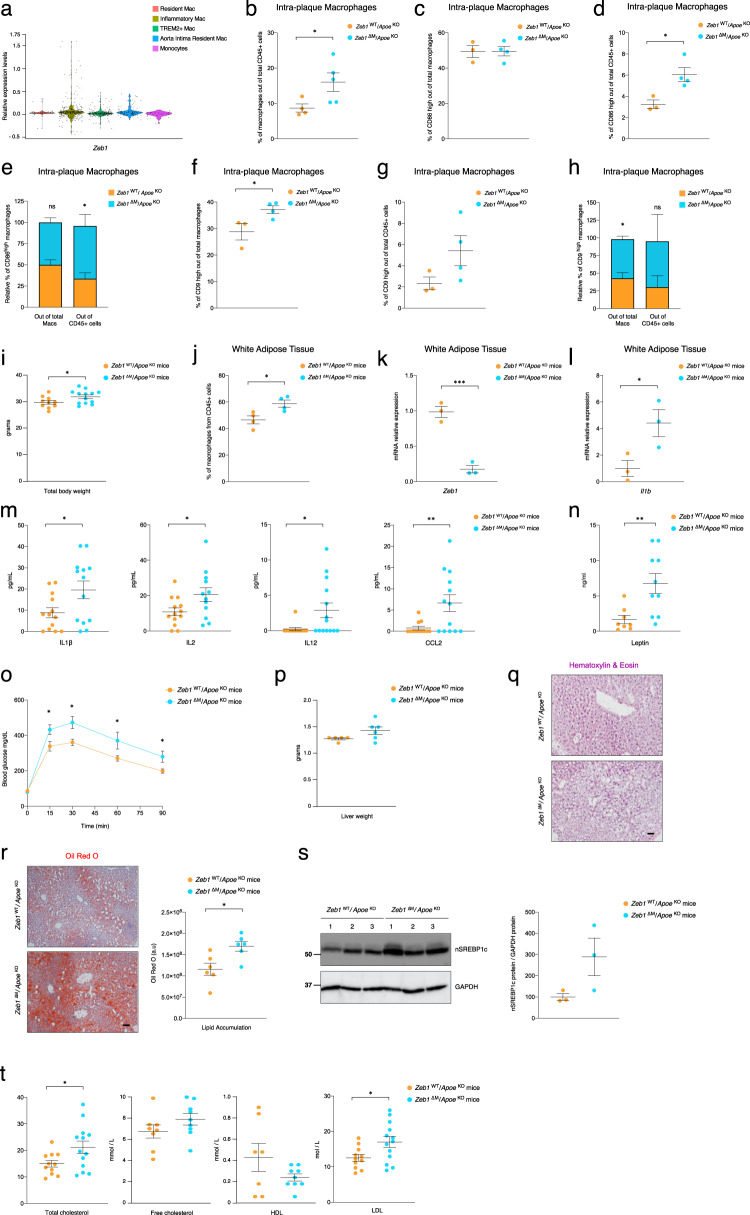
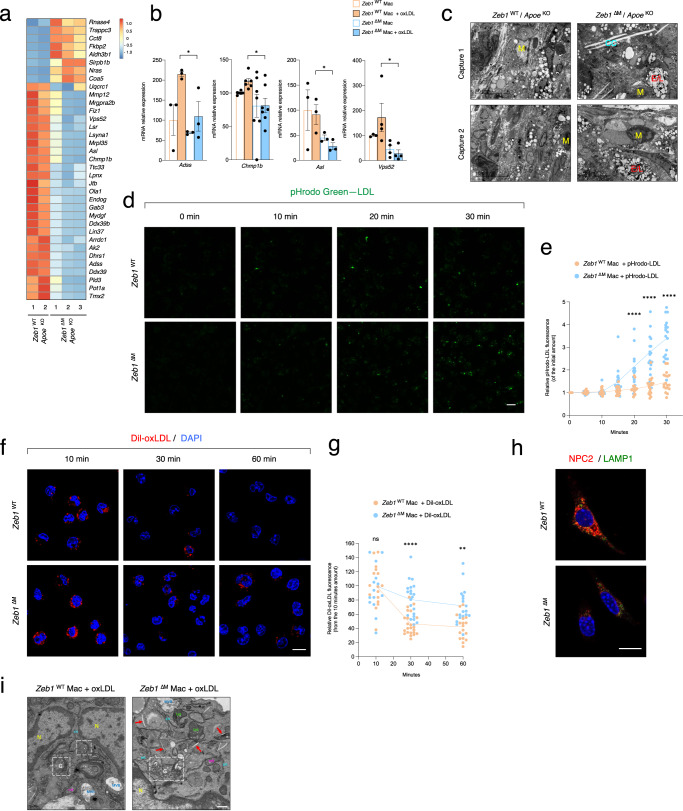
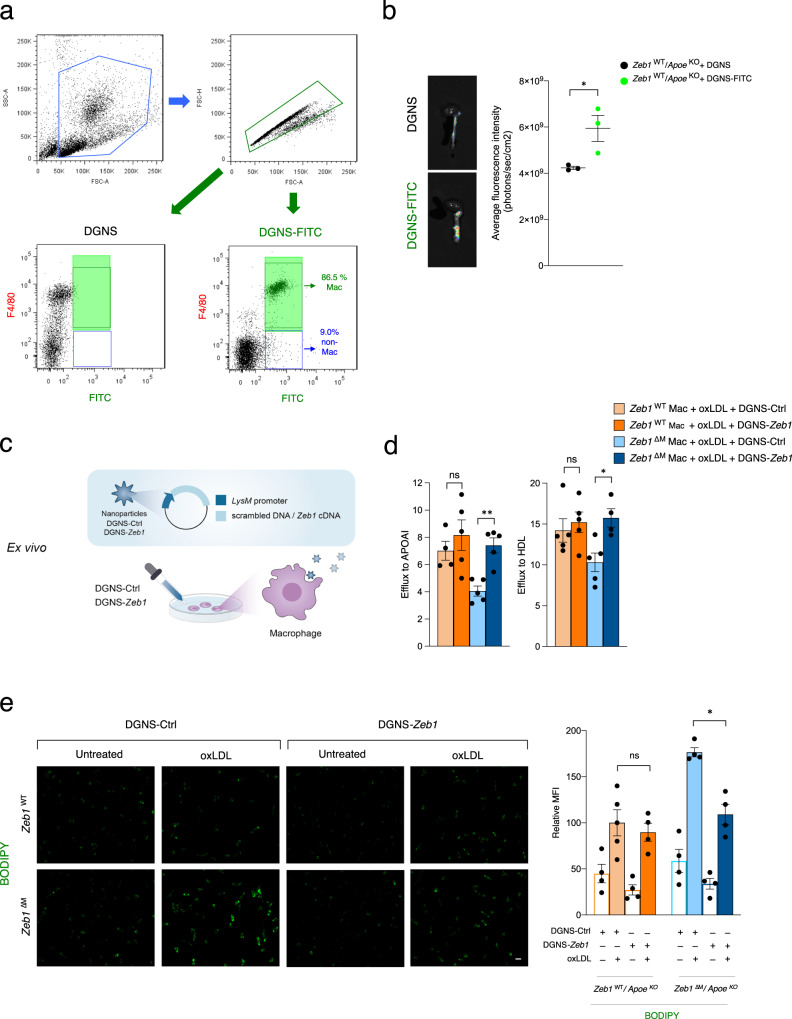
Accumulation of lipid-laden macrophages within the arterial neointima is a critical step in atherosclerotic plaque formation. Here, we show that reduced levels of the cellular plasticity factor ZEB1 in macrophages increase atherosclerotic plaque formation and the chance of cardiovascular events. Compared to control counterparts (Zeb1WT/ApoeKO), male mice with Zeb1 ablation in their myeloid cells (Zeb1∆M/ApoeKO) have larger atherosclerotic plaques and higher lipid accumulation in their macrophages due to delayed lipid traffic and deficient cholesterol efflux. Zeb1∆M/ApoeKO mice display more pronounced systemic metabolic alterations than Zeb1WT/ApoeKO mice, with higher serum levels of low-density lipoproteins and inflammatory cytokines and larger ectopic fat deposits. Higher lipid accumulation in Zeb1∆M macrophages is reverted by the exogenous expression of Zeb1 through macrophage-targeted nanoparticles. In vivo administration of these nanoparticles reduces atherosclerotic plaque formation in Zeb1∆M/ApoeKO mice. Finally, low ZEB1 expression in human endarterectomies is associated with plaque rupture and cardiovascular events. These results set ZEB1 in macrophages as a potential target in the treatment of atherosclerosis.


Conflict of interest statement

The authors declare no competing interests.

Figures

Fig. 1
Fig. 1. Downregulation of Zeb1 expression in myeloid cells increases plaque formation.
a Feeding protocol schematic for Zeb1(+/+)/ApoEKO and Zeb1(+/−)/ApoEKO male mice. From birth until 8 weeks of age, mice were provided ad libitum access to the Chow diet, followed by 12 weeks on the Western diet. b Total bodyweight of Zeb1(+/+)/ApoEKO and Zeb1(+/−)/ApoEKO mice at the end of the protocol before euthanasia (n = 5). c Representative captures and quantification of the atherosclerotic lesion area in aortic root sections of Zeb1(+/+)/ApoEKO (n = 4) and Zeb1(+/−)/ApoEKO (n = 5) mice at the end of the feeding protocol. d Feeding protocol schematic for Zeb1WT/ApoeKO and Zeb1∆M/ApoeKO male mice. From birth to the age of 8-week-old, mice were provided ad libitum access to the Chow diet followed by 10 weeks on the Western diet. e Zeb1 mRNA levels in the peritoneal macrophages of Zeb1WT/ApoeKO (n = 7) and Zeb1∆M/ApoeKO (n = 9) mice. f Representative en face ORO staining images and atherosclerosis lesion area quantification in Zeb1WT/ApoeKO (n = 11) and Zeb1∆M/ApoeKO (n = 10) mice at the end of the Western diet feeding protocol. g As in f, representative images and quantification of the atherosclerosis lesion area of aortic root sections stained with H&E from mice of both genotypes. The dashed line delineates the plaque and “N” indicates a representative area of necrosis. Scale bar: 200 μm. (n = 7,9). h As in g, but sections were stained with ORO to assess lipid accumulation. Scale bar: 200 μm. (n = 9,9). i As in g, but sections were stained with BODIPY® 493/503 (hereinafter referred to as BODIPY). Scale bar: 50 μm. (n = 7, 6). j As in g, but sections were stained for LAMP2/MAC3 (clone M3/84, dilution 1/50). Scale bar: 50 μm (n = 8,7). k As in g, but tissue sections were stained for Sirius Red. Scale bar: 100 μm. (n = 6, 7). l Quantification of plaque necrosis from the staining for Sirius Red. (n = 6,7). m As in g, but sections were stained with TUNEL and LAMP2/MAC3 (clone M3/84, dilution 1/50) along with DAPI for nuclear staining. Quantification of “macrophage-associated” apoptotic cells to “free AC”. Scale bar: 25 μm. (n = 5,6). All Graphs represent mean values ± SEM with two-tailed unpaired Mann–Whitney test. p ≤ 0.001 (***), p ≤ 0.01 (**) or p ≤ 0.05 (*) levels, or non-significant (ns) for values of p > 0.05, and with specified numerical p values for 0.05 < p < 0.075. The raw data, along with p values from the statistical analyses, are included in the Source Data file.
Fig. 2
Fig. 2. Zeb1∆M/ApoeKO mice exhibit systemic inflammation and fat accumulation.
a Macrophage subpopulations were analyzed using published scRNAseq datasets of mouse atherosclerosis (GSE116240 and GSE149070),,. b The share of macrophages out of CD45+ cells within the atherosclerotic plaque of Zeb1WT/ApoeKO (n = 4) and Zeb1∆M/ApoeKO (n = 5) mice was determined by FACS. c As in b, but the share of CD86high macrophages was calculated out of the total number of macrophages (CD45+, CD11b+, F4/80+). (n = 3,4). d As in b, but the share of CD86high macrophages was calculated out of total CD45+ cells. (n = 3, 4). e Stacked bar chart for (c) and (d). fh As in ce, but for CD9high macrophages. i Total body weight of Zeb1WT/ApoeKO (n = 10) and Zeb1∆M/ApoeKO (n = 13) mice at the end of the feeding protocol. j The share of macrophages out of CD45+ cells infiltrating the WAT of Zeb1WT/ApoeKO and Zeb1∆M/ApoeKO mice. (n = 4). k and l Zeb1 and Il1b mRNA levels in the macrophages infiltrating the WAT of Zeb1WT/ApoeKO and Zeb1∆M/ApoeKO mice (n = 3). m Serum levels of IL1β (n = 13), IL2 (n = 13,12), IL12 (n = 12,14), and CCL2 (n = 12,13) from Zeb1WT/ApoeKO and Zeb1∆M/ApoeKO mice at the end of the feeding protocol. n Serum levels of leptin in Zeb1WT/ApoeKO (n = 8) and Zeb1∆M/ApoeKO (n = 10) mice. o Glucose tolerance test in Zeb1WT/ApoeKO (n = 7) and Zeb1∆M/ApoeKO (n = 6) mice at the end of the feeding protocol plus 16 h of fasting. p Liver weight of Zeb1WT/ApoeKO (n = 5) and Zeb1∆M/ApoeKO (n = 6) mice. q Representative images of liver sections from Zeb1WT/ApoeKO and Zeb1∆M/ApoeKO mice stained with H&E. Scale bar: 20 μm. r As in q, sections were stained for ORO. Representative images and quantification. Scale bar: 20 μm. (n = 6). s Lysates from the livers of Zeb1WT/ApoeKO and Zeb1∆M/ApoeKO at the end of the feeding protocol plus 12 h of fasting were blotted for mSREBP1c (clone 2A4, dilution 1/1000) and GAPDH (1E6D9, 1/20,000) as loading control. (n = 3). t Serum levels of total cholesterol (n = 11,13), free colesterol (n = 8,9), HDL (n = 7,9), and LDL (n = 11,13) in Zeb1WT/ApoeKO and Zeb1∆M/ApoeKO mice at the end of the feeding protocol. Graphs represent mean values ± SEM with two-tailed unpaired Student’s t test. p ≤ 0.001 (***), p ≤ 0.01 (**) or p ≤ 0.05 (*) levels, or non-significant (ns) for values of p > 0.05. The raw data, along with p values from statistical analyses are included in the Source Data file.
Fig. 3
Fig. 3. ZEB1 inhibits lipid accumulation and promotes cholesterol efflux in macrophages.
a Zeb1WT and Zeb1∆M peritoneal macrophages either untreated or treated with 50 μg/mL of ox-LDL for 24 h were assessed for lipid accumulation with BODIPY and Filipin. Representative images (scale bar: 20 μm) and quantification (BODIPY, n = 6,5,7,7; Filipin, n = 3). b BODIPY staining of macrophages from Zeb1WT/ApoeKO and Zeb1∆M/ApoeKO mice at the end of the feeding protocol (n = 8). c mRNA levels of Abca1 (n = 4,5,5,5), Abcg1 (n = 4,4,6,5), and ScarbI (n = 4,3,3,3) were determined by qRT-PCR in Zeb1WT and Zeb1∆M peritoneal macrophages untreated or treated for 24 h with 50 μg/mL of oxLDL. d Cholesterol efflux to lipid-free APOA1 and HDL in Zeb1WT and Zeb1∆M peritoneal macrophages preloaded with 3H-cholesterol and 50 μg/mL of oxLDL (APOA1 n = 5,6; HDL n = 4,5). e As in c, but for Prkaa1 (n = 4,4,5,4), Nr1h3 (n = 4,6,6,6), Ppargc1a (n = 3), and Slc2a1 (n = 4,4,3,3). f BODIPY staining in Zeb1WT and Zeb1∆M peritoneal macrophages treated with 50 μg/mL of oxLDL in the presence or absence of 100 μM of A769662. Representative pictures (scale bar: 20 μm) and quantification. (n = 3,3,4,4). g As in f, but Nr1h3 (n = 3,3,4,3) and Ppargc1a (n = 4,5,5,6) mRNA expression was assessed. h As in f, but Zeb1WT and Zeb1∆M peritoneal macrophages treated with 50 μg/mL of oxLDL in the presence or absence of 15 μM of compound C (CC) (n = 3,3,4,4). Graphs represent mean values ± SEM with two-tailed unpaired Student’s t test. p ≤ 0.001 (***), p ≤ 0.01 (**) or p ≤ 0.05 (*) levels, or non-significant (ns) for values of p > 0.05. The raw data, along with p values from statistical analyses are included in the Source Data file.
Fig. 4
Fig. 4. Zeb1 deletion hinders the intracellular lipid traffic in macrophages.
a Heatmap of the top differentially expressed genes (DEG) in the RNAseq of infiltrating macrophages in the plaque of Zeb1WT/ApoeKO (n = 2) and Zeb1∆M/ApoeKO (n = 3) mice at the end of the Western diet feeding protocol. b mRNA levels of Adss1 (n = 3), Chmp1b (n = 6,6,7,7), Asl (n = 3), and Vps52 (n = 3,4,4,4) were determined by qRT-PCR in Zeb1WT and Zeb1∆M peritoneal macrophages untreated or treated for 24 h with 50 μg/mL of ox-LDL. c Ultrastructure of areas containing macrophages in atherosclerotic plaque in Zeb1WT/ApoeKO and Zeb1∆M/ApoeKO mice at the end of the feeding protocol were examined by TEM. Two representative captures are shown and additional captures are displayed in Supplementary Fig. S4b. Macrophages (M), cholesterol crystals (CC), late endosomes/lysosomes (E/L). Scale bar: 10 μm (n = 3). d The uptake and transport of pHrodo™ Green-LDL fluorescence in Zeb1WT and Zeb1∆M macrophages were captured over time (0–30 min) by confocal microscopy (see the corresponding Supplementary Movies 1 and 2, respectively, in Supplementary Information). Representative captures. Scale bar: 10 μm. e As in d, n = 18 cells quantification of three independent experiments. f DiI-oxLDL fluorescence of Zeb1WT and Zeb1∆M macrophages at 0, 30, and 60 min was assessed by confocal microscopy. See Supplementary Fig. S3c for individual staining pictures. Representative captures. Scale bar: 10 μm. g As in f, n = 17,18 cells quantification of two independent experiments. h Representative pictures of Zeb1WT and Zeb1∆M macrophages stained for NPC2 (red, clone 19888-1-AP, dilution 1/100) and LAMP1 (green, H4A3, 1/500) and assessed by confocal microscopy of two independent experiments. See Supplementary Fig. S4d for individual staining. Representative captures. Scale bar: 10 μm. i Representative TEM images of Zeb1WT and Zeb1∆M macrophages from a 5–6 mice pool for each genotype. In Zeb1WT macrophages, oxLDL is internalized via receptor-mediated endocytosis, forming multivesicular bodies (MVBs, late endosomes) that fuse with lysosomes to complete degradation. In Zeb1∆M macrophages, cholesterol accumulates in endolysosomes and forms crystals (red arrows). Zeb1∆M/ApoeKO macrophages also exhibited Golgi fragmentation (dashed squares). mit mitochondria, MVB multivesicular body (late endosome), G Golgi complex, N nucleus, ER endoplasmic reticulum, Lys lysosome. Scale bar: 500 nm. Graphs represent mean values ± SEM with two-tailed unpaired Student’s t test (b) or two-way ANOVA test (e, g). p ≤ 0.001 (***), p ≤ 0.01 (**) or p ≤ 0.05 (*) levels, or non-significant (ns) for values of p > 0.05. The raw data, along with p values from statistical analyses are included in the Source Data file.
Fig. 5
Fig. 5. Macrophage-targeted nanoparticles expressing ZEB1 reduce lipid accumulation and enhance cholesterol efflux.
a Peritoneal cells were incubated for 6 h with DGNS and DGNS-FITC and the identity of macrophages versus non-macrophages was assessed by their expression of F4/80. b Intravenous injection of DGNS or DGNS-FITC into the tail of ApoeKO mice and analysis of FITC fluorescence. Representative pictures and quantification of FITC fluorescence using ImageJ software (n = 3). c Schematic of the generation of DGNS-Ctrl and DGNS-Zeb1 and ex vivo administration into macrophages. d Macrophages from both genotypes were assessed for cholesterol efflux as in Fig. 3d. (APOAI n = 4,5,5,5; HDL n = 5,5,5,4). e As in d, but macrophages from both genotypes were assessed for BODIPY staining (n = 4). Representative captures (scale bar: 20 μm) and quantification of four independent experiments. Graphs represent mean values ± SEM with two-tailed unpaired Student’s t test (b) or two-tailed unpaired Mann-Whitney (d, e). p ≤ 0.001 (***), p ≤ 0.01 (**) or p ≤ 0.05 (*) levels, or non-significant (ns) for values of p > 0.05. Raw data along with p values from for statistical analyses are included in the Source Data file.
Fig. 6
Fig. 6. In vivo use of macrophage-targeted nanoparticles expressing ZEB1 reduces atherosclerotic plaque formation.
a Schematic and timeline of the injection of 50 μg/kg of DGNS-Ctrl or DGNS-Zeb1 in Zeb1∆M/ApoeKO mice. b As in a, H&E staining of sections of liver and kidney from Zeb1∆M/ApoeKO mice injected with DGNS-Ctrl. Scale bar: 20 μm. (n = 2,3) c Representative pictures of aortic sinus sections Zeb1∆M/ApoeKO mice. stained for ZEB1 (HPA027524, 1/500) and LAMP2/MAC3 (clone M3/84, 1/50). (n = 3). Scale bar: 50 μm. d Representative images of the en face ORO staining of aorta of Zeb1∆M/ApoeKO mice at the end of the protocol as in (a) and quantification of the plaque area by ImageJ (n = 10,7). e Representative pictures of H&E staining of aortic sinus sections of Zeb1∆M/ApoeKO mice and quantification of the plaque area (n = 7,8). Scale bar: 200 μm. f As in d, but staining for ORO. Scale bar: 200 μm (n = 6). g As in f, but in liver sections (n = 6,5). h Data from eleven plaques (7 males; 4 females), six stable and five rupture, from the endarterectomies of patients in GSE41571 were assessed for ZEB1 mRNA expression, divided into two cohorts by the median of ZEB1 expression (ZEB1high versus ZEB1low), and examined for their association with stable or ruptured plaques. i As in h, heatmap of genes associated with plaque stability and rupture in stable and ruptured plaques. j Analyses of plaques from the endarterectomies of 39 male patients in GSE163154—14 without intra-plaque hemorrhage (non-IPH) and 25 with plaque hemorrhage (IPH)—were assessed for ZEB1 mRNA expression divided in two cohorts by the median of ZEB1 expression (ZEB1high versus ZEB1low), and examined for their association with IPH. k The endarterectomies from 24 patients (21 males; 3 females) were assessed for ZEB1 mRNA levels by qRT-PCR and segregated in two cohorts depending on whether they expressed ZEB1 above (ZEB1high, 11 patients) or below (ZEB1low, 13 patients) the median. The clinical history of patients in both cohorts was analyzed to determine whether they had (symptomatic) or not (asymptomatic) a cardiovascular event. Graphs represent mean values ± SEM with two-tailed unpaired Mann-Whitney (d, e, f) or Fisher’s exact test (h, j, k). p ≤ 0.001 (***), p ≤ 0.01 (**) or p ≤ 0.05 (*) levels, or non-significant (ns) for values of p > 0.05. The raw data, along with p values from statistical analyses are included in the Source Data file.

References

    1. Libby P, et al. Atherosclerosis. Nat. Rev. Dis. Primers. 2019;5:56. doi: 10.1038/s41572-019-0106-z. - DOI - PubMed
    1. Björkegren JLM, Lusis AJ. Atherosclerosis: recent developments. Cell. 2022;185:1630–1645. doi: 10.1016/j.cell.2022.04.004. - DOI - PMC - PubMed
    1. Kim K, et al. Transcriptome analysis reveals nonfoamy rather than foamy plaque macrophages are proinflammatory in atherosclerotic murine models. Circ. Res. 2018;123:1127–1142. doi: 10.1161/CIRCRESAHA.118.312804. - DOI - PMC - PubMed
    1. Winkels H, et al. Atlas of the immune cell repertoire in mouse atherosclerosis defined by single-cell RNA-sequencing and mass cytometry. Circ. Res. 2018;122:1675–1688. doi: 10.1161/CIRCRESAHA.117.312513. - DOI - PMC - PubMed
    1. Fernandez DM, et al. Single-cell immune landscape of human atherosclerotic plaques. Nat. Med. 2019;25:1576–1588. doi: 10.1038/s41591-019-0590-4. - DOI - PMC - PubMed

Publication types

Associated data