. 2023 Dec 14;9(1):101.
doi: 10.1038/s41522-023-00465-6.

Csu pili dependent biofilm formation and virulence of Acinetobacter baumannii

Affiliations

Csu pili dependent biofilm formation and virulence of Acinetobacter baumannii

Irfan Ahmad et al. NPJ Biofilms Microbiomes. .

Abstract

Acinetobacter baumannii has emerged as one of the most common extensive drug-resistant nosocomial bacterial pathogens. Not only can the bacteria survive in hospital settings for long periods, but they are also able to resist adverse conditions. However, underlying regulatory mechanisms that allow A. baumannii to cope with these conditions and mediate its virulence are poorly understood. Here, we show that bi-stable expression of the Csu pili, along with the production of poly-N-acetyl glucosamine, regulates the formation of Mountain-like biofilm-patches on glass surfaces to protect bacteria from the bactericidal effect of colistin. Csu pilus assembly is found to be an essential component of mature biofilms formed on glass surfaces and of pellicles. By using several microscopic techniques, we show that clinical isolates of A. baumannii carrying abundant Csu pili mediate adherence to epithelial cells. In addition, Csu pili suppressed surface-associated motility but enhanced colonization of bacteria into the lungs, spleen, and liver in a mouse model of systemic infection. The screening of c-di-GMP metabolizing protein mutants of A. baumannii 17978 for the capability to adhere to epithelial cells led us to identify GGDEF/EAL protein AIS_2337, here denoted PdeB, as a major regulator of Csu pili-mediated virulence and biofilm formation. Moreover, PdeB was found to be involved in the type IV pili-regulated robustness of surface-associated motility. Our findings suggest that the Csu pilus is not only a functional component of mature A. baumannii biofilms but also a major virulence factor promoting the initiation of disease progression by mediating bacterial adherence to epithelial cells.


Conflict of interest statement

The authors declare no competing interests.

Figures
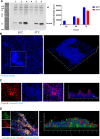
Fig. 1
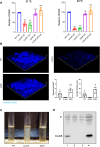
Fig. 1. The expression of Csu pili and poly N-acetyl glucosamine in mountain-like biofilm patches formed by A. baumannii on glass surface.
A Left panel: Representative Western blot of three independent experiments to show CsuA/B expression in biofilms formed by A. baumannii 17978 in glass tubes at different intervals of time. 1–24 h, 2–48 h, 3–72 h, 4–24 h, 5–48 h, 6–72 h. The arrowhead indicates equal distribution of proteins through a nonspecific band used as a loading control. Right panel: Quantification of the blots using image J software. Bars graph indicate mean +/– standard deviation (SD). B A confocal laser microscopic image of Hoechst 33342-labelled biofilm formed by A. baumannii 17978 on the surface of an 18-well chamber glass slide after 72 h. In the left image, a typical patch of biofilm is marked by the square of dotted white lines. The two size bars correspond to 10 µm. The image on the right shows a 3-D stake image of the spotted patch. C A single and multiple staked 2-D view of biofilm patches labelled with Hoechst 33342 and CsuA/B specific antibodies. The CsuA/B positive matrix is shown in red. The size bars correspond to 10 µm. D A single and multiple staked 2-D view of biofilm patches labelled with Hoechst 33342, CsuA/B specific antibody and WGA. The WGA-bound fluorescent matrix representing poly B-acetyl glucosamine is shown in green. The size bars in the images correspond to 10 µm.
Fig. 2
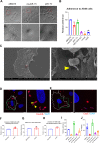
Fig. 2. Csu pili, not type IV pili, are critical in the formation of biofilm patches.
A Biofilm formation by A. baumannii 17978 wild-type (WT) and mutant strains was measured as the optical density of the crystal violet stained matrix of biofilm grown in glass tubes at 37 °C and 30 °C. Error bars show mean ± SD. Statistical significance is indicated by p value that was measured by non-parametric two tailed t test. Two asterisks ** indicate p ≤ 0.01 and “ns” indicates non-significant difference. B Three-dimensional confocal laser microscopic images of biofilm patches formed on glass in an 18-well camber by the wild-type strain and its csuA and pilA mutants. The patch formation was not observed in biofilms of the csuA mutant. The size bars in the images correspond to 10 µm. Histograms in the lower right panel indicate quantification of biomass and average thickness of the biofilm. Data are representative of two independent experiments; bar graphs show mean ± SD. Data points represent the quantification of data from six random fields of view. C Representative images of bacterial cultures grown statically in glass tubes as pellicles formed by A. baumannii wild-type and mutant strains at 30 °C after 72 h. D A representative Western blot image of three independent experiments shows the expression of the CsuA/B in A. baumannii 17978 wild type strain cultivated after the growth at different growth conditions. 1- LB broth after 48 h at 37 °C. 2- LB plates after 48 h at 37 °C, 3- LB agar plate lacking NaCl, 4- pellicle formed within LB without salt broth. The arrowhead indicates an equal distribution of proteins through a nonspecific band used as a loading control.
Fig. 3
Fig. 3. Clinical isolates of A. baumannii form CsuA/B-dependent biofilm patches that can protect bacteria from bactericidal effect of the anti-microbial drug colistin.
A The distribution of intensity of biofilms produced by individual isolates in glass tubes upon the screening of 120 clinical isolates for biofilm production at 30 °C after 72 h. The optical densities shown here were calculated after subtracting the value for the csuA mutant of A. baumannii 17978, which was arbitrarily used as a baseline control. The coloured dots represent the isolates (blue, AB5075; orange, Ab-Pak-Pesh-37; red, Ab-Pak-Lah-14; green, Ab-pak-Pesh-22) selected for additional Western blot and AFM analyses. B Representative Western blot image of three independent experiments to show the CsuA/B expression in selected clinical isolates after 72 h 1- AB5075, 2- Ab-Pak-Pesh-37, 3- Ab-Pak-Lah-14, 4- Ab-Pak-Pesh-22. The arrowhead indicates an equal distribution of proteins through a nonspecific band used as loading control. C AFM images of clinical isolates grown in glass tubes for 72 h 1- AB5075, 2- Ab-Pak-Pesh-37, 3- Ab-Pak-Lah-14, 4- Ab-Pak-Pesh-22. Scale bars = 1 μm. D Confocal laser microscopic image of A. baumannii AB5075 biofilm patches labelled with Hoechst 33342 nuclear (blue) and Propidium Iodide (PI) staining after one hour of treatment with colistin at 5 µg/ml. The PI positive (dead) cells are shown in red. The size bars in the images correspond to 10 µm. E Bar chart diagram representing the number of viable cells (CFU/ml) in a 72-hour old biofilm culture of the wild-type and mutant strains upon colistin treatment. F Bar chart diagram comparing the biofilm formation of wild-type A. baumannii AB5075 to that of the AB5075 mutant strains in glass tubes. Bar graphs show mean ± SD. Statistical significance is indicated by p value that was measured by non-parametric two tailed t test. Two asterisks ** indicate p ≤ 0.01 and ns indicates non-significant difference.
Fig. 4
Fig. 4. A. baumannii adheres to epithelial cells via Csu pili.
A Left: Phase contrast microscopic images of A. baumannii AB5075 wild-type and mutant strains adhered to A549 epithelial cells after 4 h of infection with a MOI of 1:100. The lower row of images shows enlargements of the fields marked by dotted red lines in the upper row of images. B Bar chart diagram used to indicate the comparative analysis of the adherence capability of A. baumannii strains grown in LB broth over night at 30 °C with the epithelial cell line A549. C Left: A representative scanning electron microscopic image of A. baumannii AB5075 attached to A549 epithelial cells. Right: An enlargement of the area marked by dotted red lines. A presumed connection between bacteria and cells mediated by pili is highlighted by the yellow arrowhead. D Confocal laser microscopic images of A. baumannii AB5075 wild-type bacteria attached to epithelial cells labelled with primary antibodies raised against CsuA/B (D) and CsuE (E). The punctate staining spotted by arrow illustrates the expression of CsuA/B and CsuE on the surface of bacteria attached to epithelial cells. The size bars in the images correspond to 10 µm. F Bar chart diagram used to indicate the comparative analysis of the invasion capability of A. baumannii 17978 and csuA mutant strains grown in LB broth overnight at 30 °C to the epithelial cell line A549 (G). Bar chart diagram used to indicate the comparative analysis of the adherence capability of A. baumannii 17978 and csuA mutant strains grown in LB agar plates overnight at 37 °C to the epithelial cell line A549. H Bar chart diagram used to indicate the comparative analysis of the invasion capability of A. baumannii 17978 and csuA mutant strains grown in LB agar plates overnight at 30 °C into epithelial cell line A549. I Bar chart diagram used to indicate the comparative analysis of the adherence capability of A. baumannii strain AB5075 and other selected clinical isolates to the epithelial cell line SW480. J Induction of the cytokine IL-8 in SW480 cells upon infection with different A. baumannni isolates. Error bars show mean ± SD. Statistical significance is indicated by p value that was measured by non-parametric two tailed t test. A single asterisk * indicates p ≤ 0.05, two asterisks ** indicate p ≤ 0.01, four-asterisks **** indicate p ≤ 0.001 and “ns” indicates non-significant difference.
Fig. 5
Fig. 5. GGDEF/EAL protein AIS_2337 is a modulator of Csu-dependent adherence and biofilm formation and affects PilA-dependent motility of A. baumannii 17978.
A Bar chart diagrams illustrating the screening of the individual mutants of 11 GGDEF/EAL proteins of A. baumannii 17978 for adherence to epithelial cells A549. B Adherence of pdeB mutant and trans-complemented strains with epithelial cells A549 in comparison with wild-type 17978 vector control (WT-VC). The statistical significance of the difference between vector control and trans-complemented strains was measured by a non-parametric t test using Graph Pad Prism. C Scanning electron microscopic images of A. baumannii 17978 wild-type (Upper panel) and ΔpdeB mutant (Lower panel) bacteria attached to A549 epithelial cells, highlighting the expression of pili appendages on the ΔpdeB mutant strain. D Bar chart diagram to demonstrate the comparative analysis of the adherence capability of A. baumannii AB5075 and pdeB::Tn mutant strains grown in LB broth over night at 30 °C to the epithelial cell line A549. E Western blot analysis of pdeB mutants in A. baumannii 17978 and AB5075 backgrounds for the expression of CsuA/B. The samples were collected from static cultures grown for 72 h in LB without salt at 30 °C. F Bar chart diagram showing the average integrated density of CsuA/B bands from three blots. G Bar chart diagrams showing relative colonization of bacteria into the lungs of BALBc mice sacrificed after 24 h of internasal infection and measured upon CFU counting of bacterial colonies on LB agar plates. CFU counts shown here represent CFU per millilitre of homogenized tissue. H Bar chart diagram showing relative levels of biofilm formation by the following A. baumannii 17978 strains: the wild-type, the ΔpdeB mutant and the trans-complemented mutant with wild type and catalytic mutant proteins at 30 °C after 72 h of incubation in microtiter plates and measured as the optical density of biofilm matrix stained with crystal violet. I Scanning electron microscopic images of A. baumannii 17978 wild-type (upper panel) and ΔpdeB mutant (lower panel) bacteria from cultures in LB at 30 °C after 72 h of incubation in glass tubes. J Bar chart diagram showing relative levels of biofilm formation by ΔcsuA and ΔpilA mutant strains and effect of the overproduction of PdeB from the plasmid pMBB67 (pPdeB). K Bar chart diagram of surface-associated motility assessed by measurements of the increased zone diameter of A. baumannii 17978 wild type (WT) and ΔpdeB mutant harbouring pMBB67EH vector control after 6 h at 37 °C. L Bar chart diagram of surface motility assessed by measurements of the increase in the zone diameter of ΔcsuA and ΔpilA mutant strains and effects of the overproduction of PdeB. Statistical significance of the difference shown as p value that was measured by non-parametric two tailed t test. A single asterisk * indicates p ≤ 0.05, two-asterisks ** indicate p ≤ 0.01, three-asterisks *** indicates p ≤ 0.001 and “ns” indicates non-significant difference.
Fig. 6
Fig. 6. Influence of Csu pili, type IV pili, and AIS_2337 on systemic spread of intraperitoneal infection in an experimental mouse model.
A The plotted data show the percentage of mice that survived at different time points after intraperitoneal infection (IP) using the inoculum dose of 107 bacteria per mouse. In total, 6 mice were infected with each isolate. B Bar chart diagram showing total neutrophil count in the blood withdrawn through heart puncturing from mice after 18 h of infection with wild type cells and transposon insertion mutants of the hypervirulent strain AB5075. C Bar chart diagrams showing relative colonization of bacteria into lungs, liver and spleen of mice, sacrificed after 18 h of intraperitoneal infection and measured upon CFU counting of bacterial colonies on LB agar plates. CFU counts shown here represent CFU per millilitre of homogenized tissue. Each experiment was performed with 6 mice. D, E Effect of the ΔpdeB mutation on systemic infection by the low virulent A. baumannii strain 17978 in the BALBc mouse model using an inoculum dose of 107 bacteria per mouse for intraperitoneal infection. D Bar chart diagram showing total neutrophil count in blood of mice infected with A. baumannii 17978 wild type and ΔpdeB mutant, using samples withdrawn after 18 h. E Bar chart diagram showing the relative colonization of bacteria in the lungs, liver, and spleen of mice after 18 h of intraperitoneal infection and measured upon CFU counting of bacterial colonies on LB agar plates. Each experiment was performed with 6 mice. Error bars show mean ± SD. Statistical significance is indicated by p value that was measured by non-parametric two tailed t test. A single asterisk * indicates p ≤ 0.05, two asterisks ** indicate p ≤ 0.01 and “ns” indicates non-significant difference.
Fig. 7
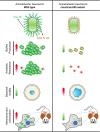
Fig. 7. Schematic diagram to compare A. baumannii wild type with its Csu pili deficient variant (csuA and csuA/B mutants) for different phenotypes.
Csu pili promote biofilm formation, colistin tolerance, adherence to epithelial cells and colonization into the lung, liver, and spleen in a mouse model, whereas it inhibits bacterial motility. Red arrow represents increased activity, whereas green arrow represents reduced activity.

References

    1. Mea HJ, Yong PVC, Wong EH. An overview of Acinetobacter baumannii pathogenesis: Motility, adherence and biofilm formation. Microbiol. Res. 2021;247:126722. doi: 10.1016/j.micres.2021.126722. - DOI - PubMed
    1. Harding CM, Hennon SW, Feldman MF. Uncovering the mechanisms of Acinetobacter baumannii virulence. Nat. Rev. Microbiol. 2018;16:91–102. doi: 10.1038/nrmicro.2017.148. - DOI - PMC - PubMed
    1. Ibrahim S, Al-Saryi N, Al-Kadmy IMS, Aziz SN. Multidrug-resistant Acinetobacter baumannii as an emerging concern in hospitals. Mol. Biol. Rep. 2021;48:6987–6998. doi: 10.1007/s11033-021-06690-6. - DOI - PMC - PubMed
    1. Ayoub Moubareck, C. & Hammoudi Halat, D. Insights into Acinetobacter baumannii: A review of microbiological, virulence, and resistance traits in a threatening nosocomial pathogen. Antibiotics9. 10.3390/antibiotics9030119 (2020). - PMC - PubMed
    1. Dijkshoorn L, Nemec A, Seifert H. An increasing threat in hospitals: multidrug-resistant Acinetobacter baumannii. Nat. Rev. Microbiol. 2007;5:939–951. doi: 10.1038/nrmicro1789. - DOI - PubMed

Publication types

Substances