. 2023 Dec 14;13(1):22255.
doi: 10.1038/s41598-023-49575-3.

APOBEC-1 deletion enhances cisplatin-induced acute kidney injury

Affiliations

APOBEC-1 deletion enhances cisplatin-induced acute kidney injury

Xiaojia Guo et al. Sci Rep. .

Abstract

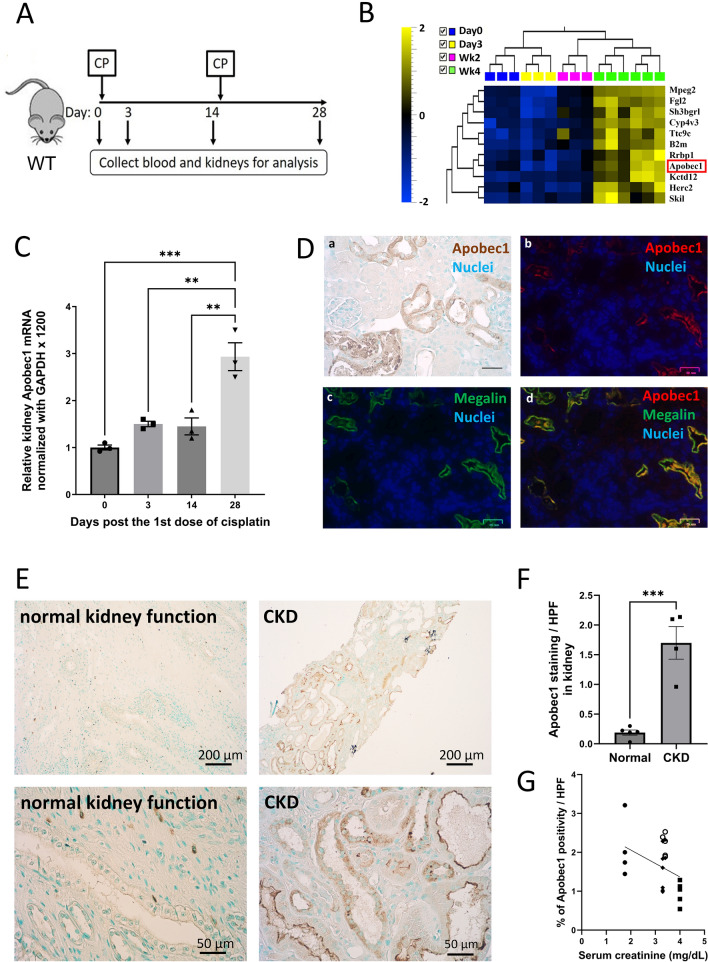
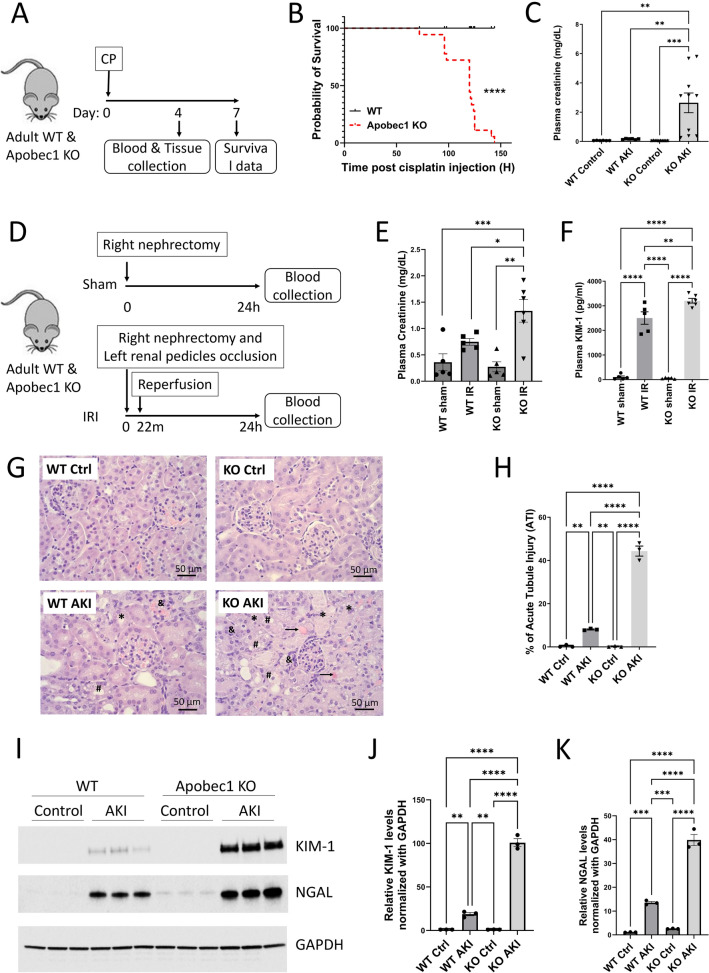
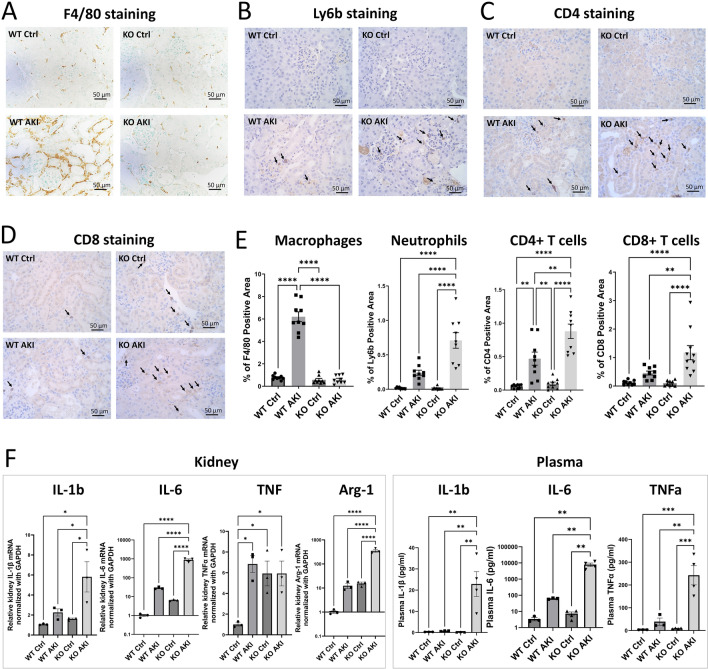
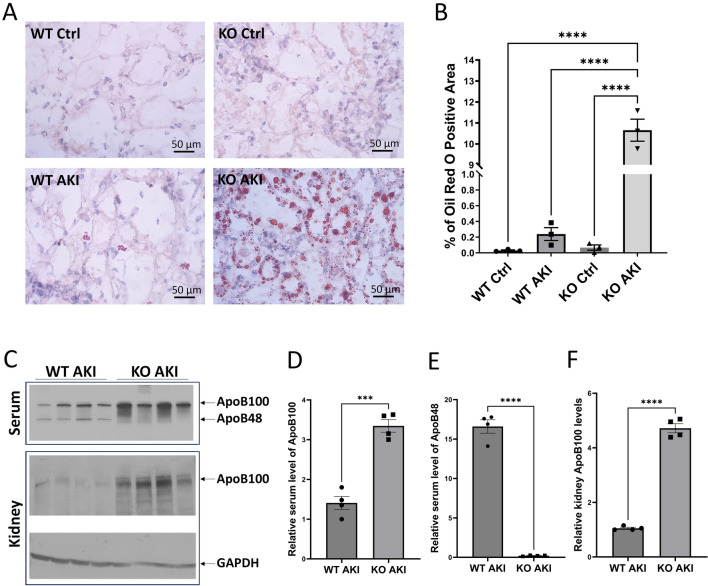
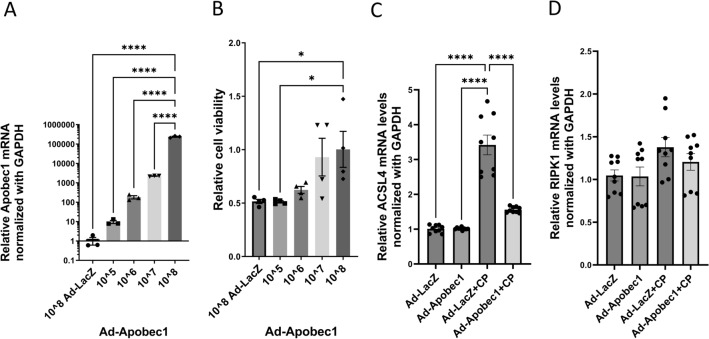
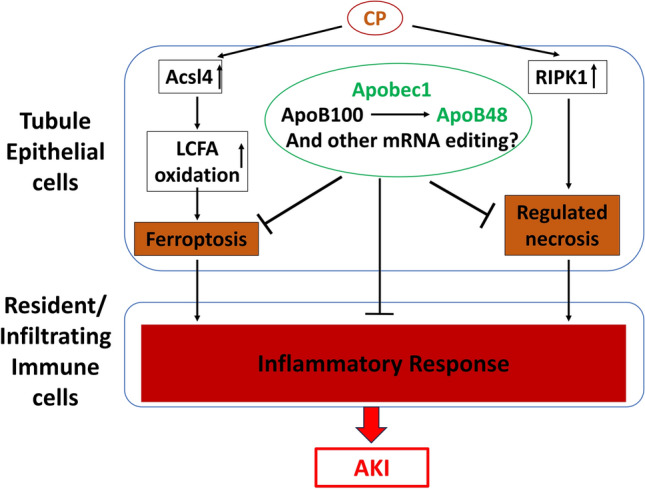
Cisplatin (CP) induces acute kidney injury (AKI) whereby proximal tubules undergo regulated necrosis. Repair is almost complete after a single dose. We now demonstrate a role for Apolipoprotein B mRNA editing enzyme, catalytic polypeptide 1 (Apobec-1) that is prominently expressed at the interface between acute and chronic kidney injury (CKD), in the recovery from AKI. Apobec-1 knockout (KO) mice exhibited greater mortality than in wild type (WT) and more severe AKI in both CP- and unilateral ischemia reperfusion (IR) with nephrectomy. Specifically, plasma creatinine (pCr) 2.6 ± 0.70 mg/dL for KO, n = 10 and 0.16 ± 0.02 for WT, n = 6, p < 0.0001 in CP model and 1.34 ± 0.22 mg/dL vs 0.75 ± 0.06, n = 5, p < 0.05 in IR model. The kidneys of Apobec-1 KO mice showed increased necrosis, increased expression of KIM-1, NGAL, RIPK1, ASCL4 and increased lipid accumulation compared to WT kidneys (p < 0.01). Neutrophils and activated T cells were both increased, while macrophages were reduced in kidneys of Apobec-1 KO animals. Overexpression of Apobec-1 in mouse proximal tubule cells protected against CP-induced cytotoxicity. These findings suggest that Apobec-1 mediates critical pro-survival responses to renal injury and increasing Apobec-1 expression could be an effective strategy to mitigate AKI.


Conflict of interest statement

DGM is named a co-inventor on pending patent “Methods and Systems for Diagnosis of Acute Interstitial Nephritis” and the founder of Predict AIN, LLC, a medical diagnostics company.

Figures

Figure 1
Figure 1
Apobec 1 expression is induced in AKI and CKD. (A) Schematic representation of experimental design for mouse model of CKD. (B) Heat map of DNA microarray study showing a cluster of genes, include Apobec1, elevated at the transition from AKI to CKD. (C) Taqman assay of reverse transcribed real time PCR for Apobec1 mRNA levels. The data represented as mean ± SE (n = 3), were subjected to unpaired t test (**p < 0.05, ***p < 0.001 in comparison to negative control). (D) Localization of APOBEC1 expression in mouse kidneys. Representative pictures of immunohistochemistry or immunofluorescence of kidneys from WT treated with cisplatin for 4d for APOBEC1 staining. Uninjured kidneys showed no expression. (a) immunohistochemistry of APOBEC1, nuclei were stained with methyl green; (bd) immunofluorescence co-staining with APOBEC1 and megalin. Nuclei were stained with DAPI (blue). Scale bar is 50 µm. (E) Representative pictures of immunohistochemistry of human kidney biopsy from subjects with normal kidney function (left) or with CKD (right) for APOBEC1, nuclei were stained with methyl green. (F) Quantification of APOBEC1-positive area of human kidney biopsy per high power field (HPF) in CKD, unpaired t test, n = 4, ***p < 0.0005. (G) Correlation between serum creatinine and expression of APOBEC1 in 4 individual CKD patients’ kidney biopsy. Pearson correlation was used to measure the linear relationship between serum creatinine level and Apobec1 expression, R squared = 0.5.
Figure 2
Figure 2
Deletion of Apobec1 leads to severe cisplatin-induced and ischemia reperfusion-induced AKI. (A) Schematic representation of experimental design for mouse model of AKI. (B) Survival of WT versus KO mice after cisplatin treatments. Data from (B) were analyzed using Kaplan–Meier curves and a log-rank test, n = 18, ***p < 0.0001. (C) Plasma creatinine level at Day 4 post CP injection, one way ANOVA multiple comparison, n = 10, **p < 0.001, ***p < 0.0005 ****p < 0.0001. (D) Schematic representation of experimental design for mouse model of IR. (E) Plasma creatinine level 24 h after IR surgery, one way ANOVA multiple comparison, n = 5 in control and WT AKI groups and n = 6 in KO AKI group, *p < 0.05, **p < 0.01. (F) Plasma KIM-1 level 24 h after IR surgery, one way ANOVA multiple comparison, n = 5 in control and WT AKI groups and n = 6 in KO AKI group, **p < 0.01, ****p < 0.0001. (G) Representative figures of hematoxylin and eosin staining from different groups of CP-AKI mouse model. Renal damage indicators are represented: → : accumulation of protein casts in the renal tubules. & region: tubule swelling. *loss of brush border membrane. #cell debris detachment. (H) Acute kidney injury scores revealed by hematoxylin and eosin staining from different groups of CP-AKI mouse model. (I) Immunoblotting of kidney injury markers KIM-1 and NGAL in total kidney lysate from WT and KO mice treated with CP for 4 days, n = 3 from each group. GAPDH was used as a loading control. Note that cropped blots are displayed, uncropped blots are included in the supplemental information file. Quantification of KIM-1 (J) and NGAL (K) from immunobotting, one way ANOVA multiple comparison, n = 3, **p < 0.01, ***p < 0.0005, ****p < 0.0001.
Figure 3
Figure 3
Decreased macrophage infiltration and elevated neutrophil and activated T cells in KO AKI kidneys. (AD) Representative pictures of immunohistochemistry of formalin-fixed paraffin-embedded kidney tissues with F4/80 (A), anti-Ly6b (B), anti-CD4 (C), and anti-CD8 (D) from each group of mice in CP-AKI model. (E) Quantification of immune cell-positive area per high power field, one way ANOVA multiple comparison, n = 3, *p < 0.05, **p < 0.01, ****p < 0.0001. (F) Plasma and renal expression of IL-1β, IL-6, TNFα and renal expression of Arg-1 were assessed by one way ANOVA multiple comparison, n = 3, *p < 0.05, **p < 0.01, ***p < 0.005, ****p < 0.0001.
Figure 4
Figure 4
Changes in kidney transcriptional profile among Apobec1 KO and WT with or without AKI. (A) Principal component analysis of the multi-group analysis of variance comparison illustrating the significant variation between the gene expression profiles of the WT control (purple), WT AKI (green), KO control (blue) and KO AKI (red) animals. (B) Heat map and hierarchical clustering of transcripts, q = 0.001. (C) Volcano plot of Apobec1 KO AKI vs WT AKI, p < 0.001, fold change > 2 or -2. Green dots on left side represent genes downregulated in KO AKI and red dots on the right side represent genes upregulated in KO AKI as compared with WT AKI samples. (D) Heat map of the microarray study showing Acsl4, Acsl5, Lpl, and Fabp3.
Figure 5
Figure 5
Increased lipid accumulation and ApoB in Apobec1 KO of CP-AKI. (A) Representative pictures of Oil Red O staining of frozen kidney Sects. (40 × magnification). (B) Quantification of the Oil Red O-positive area per high power field, one way ANOVA multiple comparison, n = 3, ****p < 0.0001. (C) A representative immunoblot for ApoB in serum (upper panel), in kidney (middle panel) and GAPDH in kidney (lower panel). Note that cropped ApoB and GAPDH blots are displayed, uncropped blots are included in the supplemental information file. (DF) Quantification of serum ApoB100, ApoB48, and kidney ApoB100 detected by immunoblotting, respectively, one way ANOVA multiple comparison, n = 4, *p < 0.05, **p < 0.01, ****p < 0.0001.
Figure 6
Figure 6
Expression of Acsl4, phosphorylation of RIPK1 as marker of ferroptosis, lipotoxicity, and regulated necrosis, respectively, after cisplatin administration. (A) Immunoblotting analysis of protein isolated from kidneys at day 4 after cisplatin administration. Three individual mice per treatment group were analyzed on the blots. Note that cropped blots of Acsl4 and phosphorylated RIPK1 (p-RIPK1) are displayed, uncropped blots are included in the supplemental information file. (B and C) Quantifications of immunoblots shown in (A), GAPDH was used as loading control. Differences were analyzed for significance using one way ANOVA corrected for multiple comparisons. *p < 0.05; **p < 0.001, ***p < 0.0005, ****p < 0.0001. (D) Correlations between plasma creatinine levels and expression levels of Acsl4.
Figure 7
Figure 7
Overexpression of apobec1 protected proximal tubule cells from CP-induced cytotoxicity. Mouse proximal tubular cells TKPTS were transduced with adenovirus overexpression lacZ (Ad-LacZ) or Apobec1 (Ad-Apobec1) for 16 h, followed by 24-h treatment with or without 25 µM cisplatin. (A) Relative Apobec1 mRNA levels in TKPTS cells transduced with Ad-Apobec1 or Ad-LacZ 40 h after transduction. n = 4, **p < 0.01, ****p < 0.0001. (B) A representative WST-1 assay: the relative cell viability is expressed as mean ± SEM, n = 4, differences were analyzed for significance using one way ANOVA corrected for multiple comparisons. *p < 0.05. (C and D) Taqman assays of reverse transcribed real time PCR for Acsl4 and RIPK1 mRNA levels. The data represented as mean ± SE (n = 9), differences were analyzed for significance using one way ANOVA corrected for multiple comparisons, ****p < 0.0001.
Figure 8
Figure 8
Proposed mechanism mediating the protective action of APOBEC1 against cisplatin-induced AKI. APOBEC1 is crucial to mitigate cisplatin-induced renal injury possibly through inhibiting lipotoxicity, ferroptosis, regulated necrosis, and the inflammatory response to cisplatin.

References

    1. Khan SF. Peritoneal dialysis as a renal replacement therapy modality for patients with acute kidney injury. J. Clin. Med. 2022 doi: 10.3390/jcm11123270. - DOI - PMC - PubMed
    1. Ferenbach DA, Bonventre JV. Acute kidney injury and chronic kidney disease: From the laboratory to the clinic. Nephrol. Ther. 2016;12(Suppl 1):S41–48. doi: 10.1016/j.nephro.2016.02.005. - DOI - PMC - PubMed
    1. Guo X, et al. Inhibition of renalase expression and signaling has antitumor activity in pancreatic cancer. Sci. Rep. 2016;6:22996–22996. doi: 10.1038/srep22996. - DOI - PMC - PubMed
    1. Tonnus W, Belavgeni A, Xu Y, Linkermann A. Don’t trick me twice! Kidney Int. 2019;95:736–738. doi: 10.1016/j.kint.2018.12.004. - DOI - PubMed
    1. Moreno-Gordaliza E, et al. Elemental bioimaging in kidney by LA-ICP-MS as a tool to study nephrotoxicity and renal protective strategies in cisplatin therapies. Anal. Chem. 2011;83:7933–7940. doi: 10.1021/ac201933x. - DOI - PubMed