. 2023 Dec;5(12):2111-2130.
doi: 10.1038/s42255-023-00928-2. Epub 2023 Dec 14.

Iron accumulation drives fibrosis, senescence and the senescence-associated secretory phenotype

Affiliations

Iron accumulation drives fibrosis, senescence and the senescence-associated secretory phenotype

Mate Maus et al. Nat Metab. 2023 Dec.

Abstract

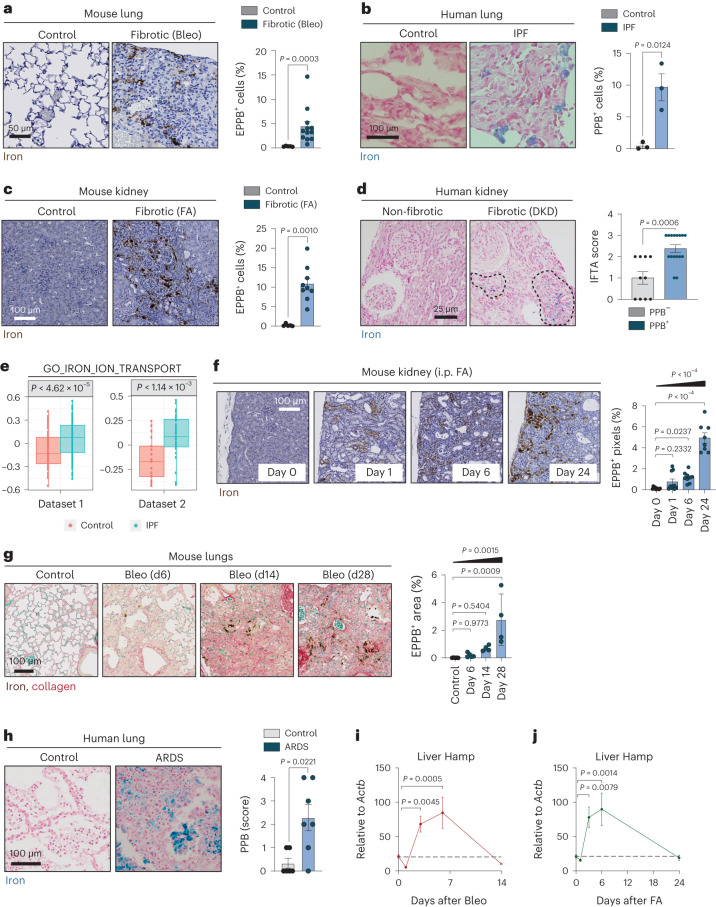
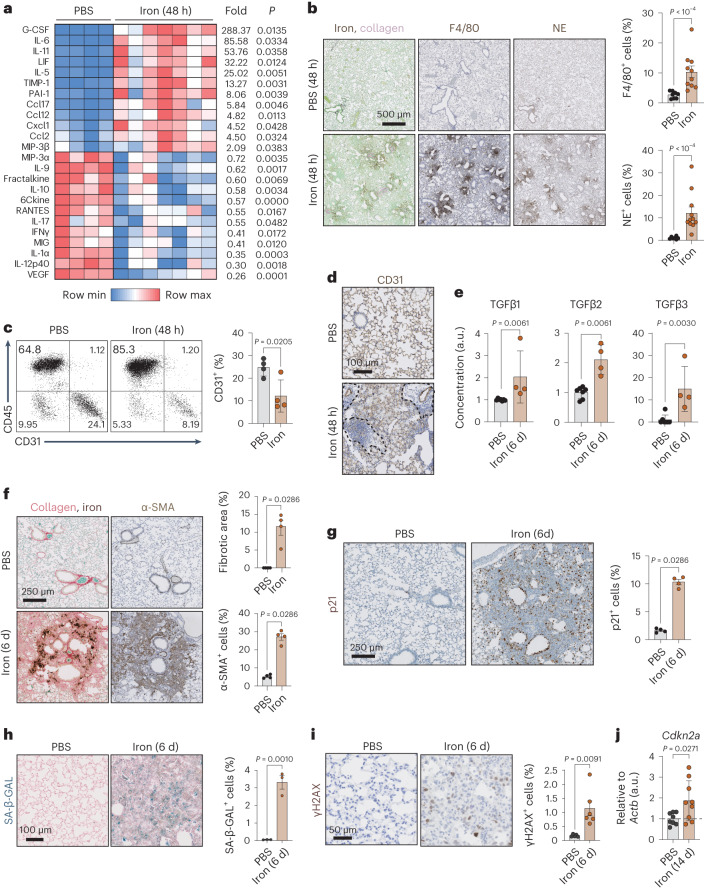
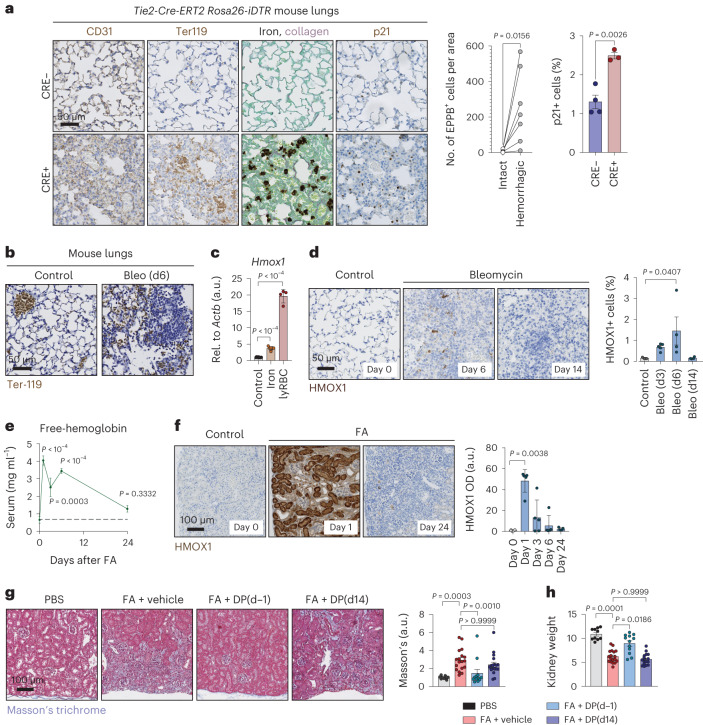
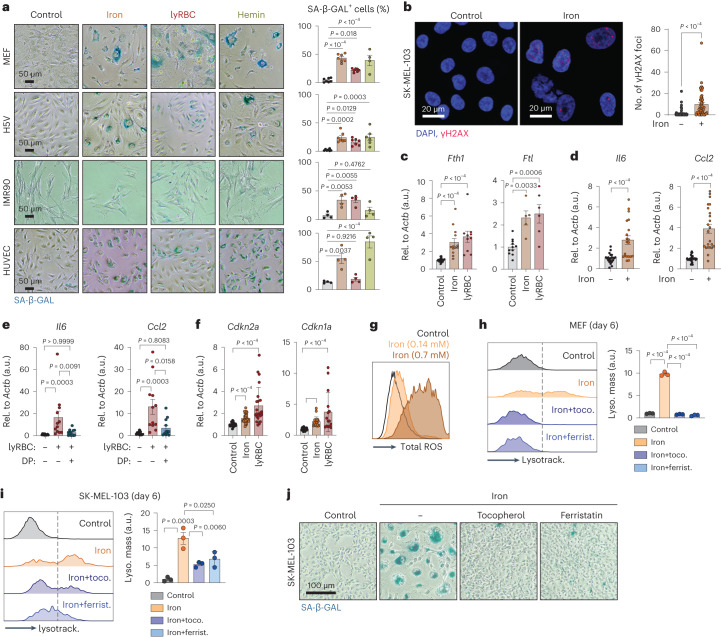
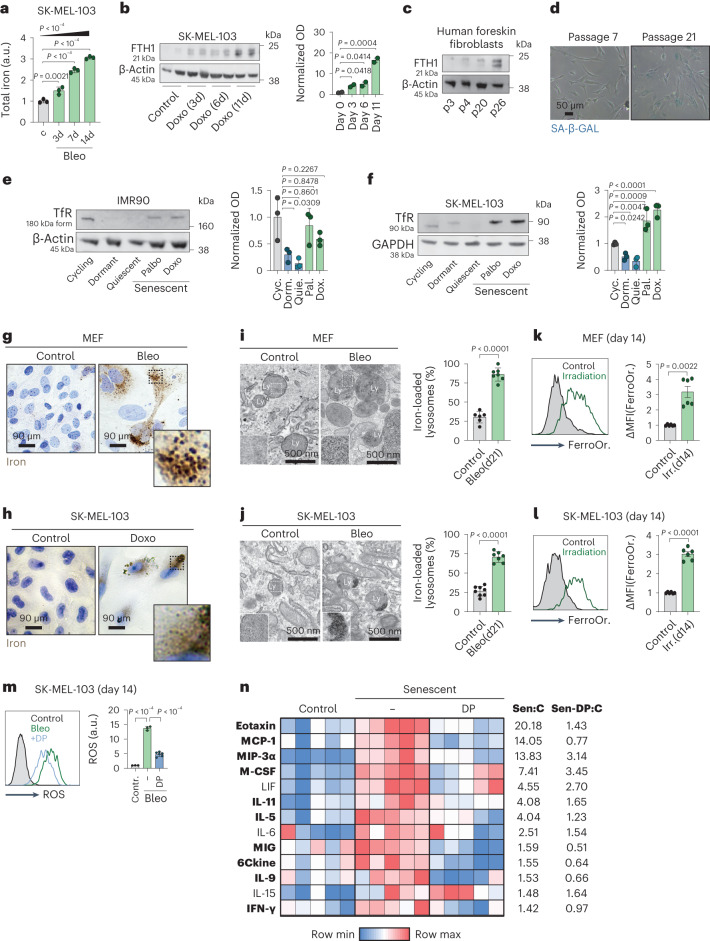
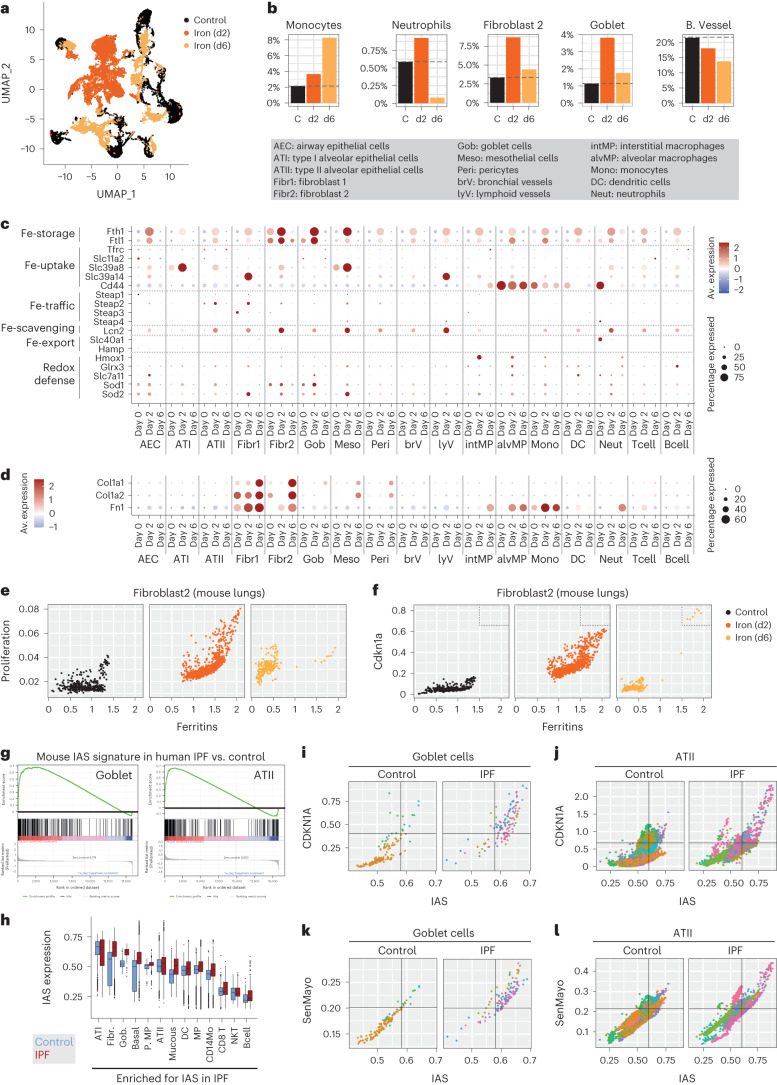
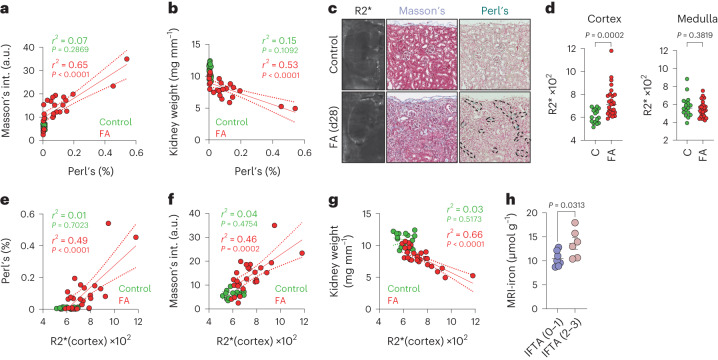
Fibrogenesis is part of a normal protective response to tissue injury that can become irreversible and progressive, leading to fatal diseases. Senescent cells are a main driver of fibrotic diseases through their secretome, known as senescence-associated secretory phenotype (SASP). Here, we report that cellular senescence, and multiple types of fibrotic diseases in mice and humans are characterized by the accumulation of iron. We show that vascular and hemolytic injuries are efficient in triggering iron accumulation, which in turn can cause senescence and promote fibrosis. Notably, we find that senescent cells persistently accumulate iron, even when the surge of extracellular iron has subdued. Indeed, under normal conditions of extracellular iron, cells exposed to different types of senescence-inducing insults accumulate abundant ferritin-bound iron, mostly within lysosomes, and present high levels of labile iron, which fuels the generation of reactive oxygen species and the SASP. Finally, we demonstrate that detection of iron by magnetic resonance imaging might allow non-invasive assessment of fibrotic burden in the kidneys of mice and in patients with renal fibrosis. Our findings suggest that iron accumulation plays a central role in senescence and fibrosis, even when the initiating events may be independent of iron, and identify iron metabolism as a potential therapeutic target for senescence-associated diseases.


Conflict of interest statement

M. Serrano is a shareholder of Senolytic Therapeutics, Life Biosciences, Rejuveron Senescence Therapeutics and Altos Labs and is an advisor to Rejuveron Senescence Therapeutics and Altos Labs. M. Serrano has been a consultant, until the end of 2022, for Rejuveron Senescence Therapeutics and Altos Labs. The funders had no role in the study design, data collection and analysis, decision to publish or manuscript preparation. The remaining authors declare no competing interests.

Figures

Fig. 1
Fig. 1. Fibrogenic injuries provoke progressive iron accumulation.
a, Histochemistry for iron by enhanced Perl’s Prussian blue (EPPB) staining. Representative images of mouse lung sections 14 days post-intratracheal PBS (control; n = 5) or bleomycin (Bleo) (fibrotic; n = 12) and quantification. Scale bar, 50 μm. b, Histochemistry for iron by regular Perl’s Prussian blue (PPB) staining. Representative images of human lung sections from control non-cancerous lung tissue (control; n = 3) and patients with IPF (IPF; n = 3) and quantification. Scale bar, 100 μm. c, Histochemistry for iron by EPPB. Representative images of mouse kidney sections 28 days post-PBS (control; n = 5) or FA (fibrotic; n = 9) and quantification. Scale bar, 100 μm. d, Histochemistry for iron by regular PPB staining. Representative images of human kidney biopsies from patients with DKD without (non-fibrotic) or with interstitial fibrosis (fibrotic). Dashed lines delineate Perl’s-positive cells. Scale bar, 25 μm. Quantification shows IFTA scores (0, n = 4; 1, n = 4; 2, n = 10; and 3, n = 8) in patients with Perl’s-negative or Perl’s-positive kidney biopsies. e, Box plots of gene set variation analysis relative expression scores of GO_IRON_ION_TRANSPORT:0006826 pathway (n = 59 genes) computed on two different lung transcriptomes from controls (dataset 1, n = 78; and dataset 2, n = 17) and patients with IPF (dataset 1, n = 122; and dataset 2, n = 38). Boxes represent the median and 25th and 75th percentiles of data. The whiskers extend to the largest upper and lower values no further than 1.5 × interquartile range. Outlier points are plotted individually. We used the Kruskal–Wallis test. f, Histochemistry for iron by EPPB staining. Representative images of mouse kidneys from before (n = 10) and 1 day (n = 10), 6 days (n = 9) or 24 d (n = 8) post-FA and quantification. g, Histochemistry for iron and collagen by combining EPPB and Sirius Red/Fast Green (SRFG) staining. Representative images of mouse lung sections from before (n = 5) and 6 days (n = 5), 14 days (n = 4) or 28 days (n = 4) post-bleomycin and quantification. h, Histochemistry for iron by regular PPB staining. Representative images of human lung sections collected postmortem from control patients (no ARDS; n = 6) and patients with ARDS (n = 7) and quantification. i,j, mRNA levels of hepcidin (Hamp) relative to Actb in the livers of mice from before (n = 6) or 1 day (n = 5), 3 days (n = 5), 6 days (n = 4) or 14 days (n = 6) post-bleomycin (i) or from before (n = 6) and 1 day (n = 5), 3 days (n = 5), 6 days (n = 5) or 24 days (n = 6) post-FA (j). When bar graphs are shown, they represent mean ± s.e.m. Dots represent individual mice or human donors; all mouse experiments were performed at least three times with similar results; unless stated otherwise, we used a two-tailed Mann–Whitney U-test or, for multiple comparisons, a one-way analysis of variance (ANOVA); we analyzed for linear trends between the column means from left to right (f,g). Source data
Fig. 2
Fig. 2. Iron accumulation promotes fibrogenesis and senescence.
a, Heat map showing the protein levels of cytokines and chemokines significantly altered 2 d post-iron (500 nM; n = 7), when compared to controls (PBS; n = 4) in the lungs lysates of mice tested by a multiplex protein assay. b, Histochemistry for iron and collagen, by combining EPPB and SRFG staining, immunohistochemistry for the macrophage marker F4/80 and for the neutrophil marker, neutrophil elastase (NE). Representative images of mouse lung sections 2 d post-PBS (n = 8 for F4/80; n = 7 for NE) or iron (500 nM; n = 10 for F4/80; n = 11 for NE) and quantification. Scale bar, 500 μm. c, Flow-cytometric analysis of CD31 and CD45 in lung cells from mice 2 d post-PBS (n = 4) or iron (500 nM; n = 4) and quantification. d, Representative images showing immunohistochemical detection of CD31+ endothelial cells in lung sections of mice 2 d post-PBS (n = 4) or iron (500 nM; n = 5). Dashed lines delineate regions where CD31 staining gets lost. Scale bar, 100 μm. e, Protein levels of TGF-β family members in the lungs of mice 6 days post-PBS (n = 7) or iron (500 nM; n = 4) detected by a multiplex protein assay. f, Histochemistry for iron and collagen, by combining EPPB and SRFG staining and immunohistochemistry for the myofibroblast marker α-SMA. Representative images of mouse lung sections 6 days post-PBS (n = 4) or iron (500 nM; n = 4) and quantification. Scale bar, 250 μm. g, Immunohistochemistry for the senescence marker p21. Representative images of mouse lung sections 6 days post-PBS (n = 4) or iron (500 nM; n = 4) and quantification. Scale bar, 250 μm. h, SA-β-GAL staining of mouse lung sections 6 days post-PBS (n = 3) or iron (500 nM; n = 3). Representative images and quantification. Scale bar, 100 μm. i, Immunohistochemistry for the DNA-damage marker γH2AX. Representative images of mouse lung sections 6 days post-PBS (n = 5) or iron (500 nM; n = 6) and quantification. Scale bar, 50 μm. j, mRNA levels of Cdkn2a (p16) relative to Actb in mouse lungs 14 d post-PBS (control; n = 8) or iron (500 nM; n = 9). When bar graphs are shown, they represent mean ± s.e.m.; dots represent individual mice. All experiments were performed at least three times with similar results. Data were analyzed by a two-tailed unpaired t-test (a,c,hj) and a two-tailed Mann–Whitney U-test (all remaining panels) or for multiple comparisons, a one-way ANOVA. Source data
Fig. 3
Fig. 3. Vascular insults provoke iron accumulation.
a, Histochemistry for iron and collagen, by combining EPPB and SRFG staining, and immunohistochemistry for CD31, Ter-119 and p21. Representative images of mouse lung sections from Tie2-Cre-ERT2 (n = 4) and Tie2-Cre-ERT2+ (n = 3) Rosa26-iDTR mice after 2 weeks of treatment with tamoxifen and diphtheria toxin (left). Scale bar, 50 μm. Number of EPPB-positive cells per unit area in foci with or without microhemorrhages (middle). We used the Wilcoxon matched-pairs signed-rank test. Percentage of p21+ cells in Tie2-Cre-ERT2 (n = 4) and Tie2-Cre-ERT2+ (n = 3) Rosa26-DTR mice. b, Immunohistochemistry for Ter-119. Representative images of mouse lung sections 6 d post-PBS (control) or bleomycin (1.5 U kg−1 body weight). Scale bar, 50 μm. c, mRNA levels of Hmox1 relative to Actb in MEFs after 3 d of culture in control conditions (n = 10), or in the presence of iron (660 μM; n = 6) or lysed RBCs (25-fold dilution; n = 4). Values represented are normalized to the average of the controls (a.u.). d, Immunohistochemistry for HMOX1. Representative images of mouse lung sections 0 d (control; n = 3), 6 d (n = 4), 14 d (n = 4) post-bleomycin (1.5 U kg−1 body weight) and quantification. Scale bar, 50 μm. e, Free-hemoglobin levels, measured by ELISA, in the sera of mice 0 d (n = 7), 1 d (n = 5), 3 d (n = 5), 6 d (n = 5) and 24 d (n = 5) post-FA. f, Immunohistochemistry for HMOX1. Representative images of mouse kidney sections 0 d (n = 4), 1 d (n = 5), 3 d, 6 d and 24 d (n = 5) post-FA and quantification of optical density (OD). Scale bar, 100 μm for all images. g,h, Analysis of kidneys from control mice (PBS injected; n = 10) and FA-treated mice, which either received vehicle (n = 18), daily deferiprone starting 1 d before (DP(d − 1); n = 16) or 14 d after (DP(d14); n = 18) disease induction by FA. Mice were analyzed 28 d post-FA. g, Representative images of Masson’s trichrome staining and quantification. Scale bar, 100 μm. h, Kidney weight relative to tibia length. When bar graphs are shown, they represent mean ± s.e.m.; dots represent individual mice; all experiments were performed at least three times with similar results. Unless stated otherwise, we compared distributions using a two-tailed unpaired t-test or, for multiple comparisons, we used a one-way ANOVA (ce) or a Kruskal–Wallis test (fh). Source data
Fig. 4
Fig. 4. Iron and lysed erythrocytes cause cellular senescence in vitro.
a, SA-β-GAL staining of H5V cells, IMR90 fibroblasts, HUVEC cells and MEFs 14 d after culture in control conditions (control; nMEF = 7; nH5V = 7; nIMR90 = 4; nHUVEC = 4) or in the presence of iron (660 μM; nMEF = 7; nH5V = 7; nIMR90 = 4; nHUVEC = 4), lysed RBCs (25-fold dilution; nMEF = 7; nH5V = 7; nIMR90 = 4; nHUVEC = 4) or hemin (10 μM; nMEF = 4; nH5V = 6; nIMR90 = 4; nHUVEC = 4). Representative images and quantification. Scale bar, 50 μm. b, Immunofluorescent staining for γH2AX in SK-MEL-103 cells cultured with vehicle control (n = 44) or iron (660 μM; n = 51) for 2 d. Scale bar, 20 μm. Representative images and quantification of γH2AX foci per nuclei. Nuclei were stained with DAPI. c, mRNA levels of Fth1 (ncontrol = 23; niron = 13; nlyRBC = 10) and Ftl (ncontrol = 11; niron = 5; nlyRBC = 6) relative to Actb in MEFs, which were cultured for 3 d in the presence of vehicle (control), iron (660 μM) or lysed RBCs (25-fold dilution). d, mRNA levels of Il6 (ncontrol=22; niron = 20) and Ccl2 (ncontrol = 2; niron = 23) relative to Actb in MEFs, which were cultured for 3 d with vehicle (control) or iron (660 μM). e, mRNA levels of Il6 (ncontrol = 12; nlyRBC = 12; nlyRBC+DP = 12) and Ccl2 (ncontrol = 12; nlyRBC = 12; nlyRBC+DP = 12) relative to Actb in MEFs, which were cultured for 3 d with vehicle (control) or lysed RBCs (25-fold dilution) with or without DP (1 mM). f, mRNA levels of Cdkn2a (ncontrol = 30; niron = 31; nlyRBC = 23), Cdkn1a (ncontrol = 26; niron = 26; nlyRBC = 21) relative to Actb in MEFs, which were cultured for 7 d with vehicle (control), iron (660 μM) or lysed RBCs (25-fold dilution). g, Flow-cytometric analysis of total ROS levels in MEFs after 7 d with vehicle or iron (140 μM or 660 μM). h,i, Flow-cytometric analysis of lysosomal mass by LysoTracker staining of MEFs (h) and SK-MEL-103 cells (i) after culturing cells for 7 d with vehicle (nMEF = 3; nSKMEL = 3) or in the presence of iron (660 μM; nMEF = 3; nSKMEL = 3) with or without the ROS scavengers tocopherol (50 μM; nMEF = 3; nSKMEL = 3) and ferristatin (1 μM; nMEF = 3; nSKMEL = 3). Representative histograms and quantification of lysosomal mass. j, SA-β-GAL staining of SK-MEL-103 after 14 d in culture in control conditions or in the presence of iron (140 μM) with or without tocopherol (50 μM) or ferristatin (1 μM). Scale bar, 100 μM. When bar graphs are shown, they represent mean ± s.e.m.; dots represent experimental replicates; experiments were performed at least three times with similar results. Data were analyzed by a Mann–Whitney U-test (b); two-tailed unpaired t-test (d); one-way ANOVA for multiple comparisons (a,c,h,i) and a Kruskal–Wallis test (e,f). Source data
Fig. 5
Fig. 5. Iron accumulation in senescent cells drives the SASP.
a, Total iron levels in SK-MEL-103 cells before (n = 3) and 3 d (n = 3), 7 d (n = 3) and 14 d (n = 3) post-damage by bleomycin. b, Ferritin heavy chain (FTH1) levels in SK-MEL-103 cells before (n = 2) and 3 d (n = 2), 6 d (n = 2) and 11 d (n = 2) post-doxorubicin (Doxo) (100 nM). Densitometric quantification (right). c, FTH1 levels in human foreskin fibroblasts undergoing replicative senescence with passaging. Passage numbers (p). d, Representative images of SA-β-GAL staining of human primary foreskin fibroblasts at passage 7 and at passage 21. Scale bar, 50 μm. e,f, TfR levels in cycling, dormant (INK128; 200 nM for 7 d), quiescent (serum starvation for 7 d) and senescent (induced by doxorubicin (100 nM) or palbociclib (1 µM)) IMR90 human fibroblasts (e) and SK-MEL-103 human melanoma cells (f) (n = 3 for each condition). Densitometric quantification (right). g,h, EPPB staining of MEFs (g) and SK-MEL-103 cells (h), controls and 21 d post-bleomycin (10 mU ml−1) or post-doxorubicin (100 nM). Insets show punctate accumulation of iron. i,j, Transmission electron microscopical images of MEFs (i) and SK-MEL-103 cells (j), control (nMEF = 6; nSKMEL-103 = 8) and 21 d post-bleomycin (10 mU ml−1) (nMEF = 7; nSKMEL-103 = 7). Insets show accumulation of electron-dense material in the lysosomes compatible in size and organization with ferritin-bound iron. Ly, lysosomes; M, mitochondria. Quantification of iron-loaded lysosomes (right). k,l, Levels of labile iron (Fe2+) in control and senescent (irradiation-induced) MEFs (k) and SK-MEL-103 cells (l), measured by flow cytometry using the dye FerroOrange (n = 6 for each condition). Representative histograms and quantification. m, Levels of total ROS in control (n = 3) and senescent (bleomycin-induced; 10 mU ml−1) SK-MEL-103 cells, which received vehicle (n = 3) or DP (200 μM; n = 6) 30 min before measurement. Representative histograms and quantification. n, Heat map showing the protein levels of SASP factors in control MEF (n = 5) and irradiated senescent MEFs (n = 5) cultured for 3 d with vehicle or DP (100 μM; n = 5). SASP factors in bold were suppressed by DP. Fold change relative to the controls for senescent MEFs (Sen:C), and for senescent MEFs treated with deferiprone (Sen-DP:C). When bar graphs are shown, they represent mean ± s.e.m. Dots represent experimental replicates. Experiments were performed at least three times with similar results; we used a two-tailed unpaired t-test, (j,k,m) and a Mann–Whitney U-test (l); for multiple comparisons we used one-way ANOVA; we analyzed for linear trends between the column means from left to right (a). Source data
Fig. 6
Fig. 6. Single-cell dynamics of iron accumulation in lung fibrosis.
af, snRNA-seq analysis of cells from lungs of control mice receiving intratracheal administration of PBS (6 d; n = 1) and mice receiving iron intratracheally (500 nM) 2 d (n = 1) or 6 d (n = 1) before analysis. UMAP visualization of cells (a). Percentages of cell types with robust change in abundance in response to iron (b). Average expression and percentage of cells expressing genes regulating iron homeostasis (c), type I collagens (d) and fibronectin in individual cell types. Dot plot showing the scaled average expression of an individual gene across all cell types and conditions. Percentage expressed shows the percentage of cells that showed detectable expression of the analyzed gene within a specific cell type at a specific condition. Scatter-plots showing the expression of a cell proliferation signature (e) and Cdkn1a (f) with respect to ferritin expression in fibroblast 2 cells from control lung and lungs 2 d or 6 d post-iron. gl, Analysis of human lung scRNA-seq meta-analysis from controls and patients with IPF. Data were generated by analyzing a meta-analysis of human single-cell lung transcriptome that compared 26 control individuals to 19 patients with IPF. Enrichment plot of the gene set enrichment analysis of the IAS in goblet cells and type II alveolar epithelial cells (ATII) in a human lung scRNA-seq meta-analysis comparing control (n = 26) individuals to patients with IPF (n = 19) (g). Expression of the mouse IAS in cell types which show a significant enrichment of IAS genes in the comparison between control and IPF lung cells in a human scRNA-seq meta-analysis (h). Boxes represent the median and 25th and 75th percentiles of the data. The whiskers extend to the largest upper and lower values no further than 1.5 × interquartile range. Outlier points are plotted individually. Scatter-plots showing the expression of CDKN1A (i,j) and the SenMayo senescence signature (k,l) with respect to the expression of the IAS in goblet cells (i,k) and in type II alveolar epithelial cells (ATII) (j,l) in a human lung scRNA-seq meta-analysis from control individuals (n = 5 for goblet cells; n = 25 for ATII) and patients with IPF (n = 6 for goblet cells: n = 19 for ATII). Each color represents cells from an individual donor.
Fig. 7
Fig. 7. Iron detected by MRI as a biomarker of kidney fibrosis.
a,b, Correlation analysis between Perl’s and Masson’s trichrome staining intensity (a) and Perl’s staining intensity (b) and kidney weight in mice. Each dot represents a mouse kidney from mice 28 d post-i.p. PBS (green; n = 16) or i.p. FA (red; n = 26). c, Representative images of R2* map acquired by MRI, Masson’s trichrome staining and Perl’s staining of kidneys from mice 28 d after injection with PBS or FA. d, Mean R2* value in the kidney cortex and in the kidney medulla of mice 28 d after treatment with i.p. injection of PBS or FA. Data were analyzed by Mann–Whitney U-test. eg, Correlation analysis between the mean R2* value measured in the kidney cortex and intensity of Perl’s staining in the kidney cortex (e), intensity of Masson’s staining in the kidney cortex (f) and kidney weight (g). Each dot represents a mouse kidney from mice receiving i.p. PBS (green; n = 16) or i.p. FA (red; n = 26) analyzed 28 d after injection. h, R2* values in the kidney cortex were measured in kidney allograft recipient patients (n = 13). We compared R2* values obtained in patients with no or moderate fibrosis (IFTA (0–1); n = 7) to patients with pronounced fibrosis (IFTA (2–3); n = 6). Bar graphs represent mean ± s.e.m.; data were analyzed by a two-tailed unpaired t-test. In all panels, when bar graphs are shown, they represent mean ± s.e.m.; when linear regression is shown, dashed lines represent the 95% confidence interval; dots represent individual animals or humans. Unless stated otherwise, we compared distributions using two-tailed unpaired t-test. Source data
Extended Data Fig. 1
Extended Data Fig. 1. Fibrogenic injuries provoke progressive iron accumulation.
a, Histochemistry for iron and collagen by combining enhanced Perl’s Prussian blue (PPB) and Sirius Red/Fast Green (SRFG) staining. Representative images of mouse lung sections 14 days post-PBS or bleomycin (1.5 U/kg of body weight). Scale bar, 100 μm. b, Histochemistry for iron by regular PPB staining. Representative images of mouse hearts from wild-type mice (control) and mice with transgenic overexpression of adrenergic receptor beta (fibrotic, TGADRB1). Scale bar, 50 μm. c, Histochemistry for iron and collagen by combining enhanced PPB and SRFG staining. Representative images of mouse heart sections undergoing sham surgery (control), and from mice in which fibrosis was provoked by ischemic coronary artery ligation. Scale bar, 100 μm. d-e, Histochemistry for ferric (Fe3+) and ferrous iron (Fe2+) by enhanced Perl’s Prussian blue (EPPB) and enhanced Turnbull (ETB) staining respectively, in control and fibrotic mouse kidneys, where fibrosis was induced by d, folic acid (ncontrol = 10; nFA = 16), or by e, unilateral ureteral obstruction (UUO) (ncontrol = 4; nFA = 4). Representative images acquired by high magnification (scale bar, 50 μm) and low magnification (scale bar, 1 mm) and quantification. f-g, mRNA levels of Fth1 and Ftl relative to Actb. f, in mouse lungs 14 days post- PBS (control; n = 8) or bleomycin (fibrotic, BLEO; n = 8), and g, in mouse kidneys 28 days post-PBS (control; n = 8) or folic acid (fibrotic, FA; n = 8). We used a two-sided, unpaired t-test. h-i, mRNA levels of Il6 relative to Actb. h, in mouse lungs 14 days post-PBS (control; n = 9) or bleomycin (fibrotic, BLEO; n = 9), and i, in mouse kidneys 28 days post-PBS (control; n = 8) or folic acid (fibrotic, FA; n = 8). j, Comparison of RNA transcript levels of key iron homeostasis genes in the peripheral blood transcriptome of hospitalized COVID-19 patients separated into two groups: patients with clear symptoms of COVID-induced ARDS (hospitalized at the ICU; n = 56); and patients with no clear symptoms of ARDS (hospitalized at the ward; n = 31). Boxes represent the median and 25th and 75th percentiles of the data. The whiskers extend to the largest upper and lower values no further than 1.5 times the interquartile range. Outlier points are plotted individually. Means were compared by Wilcoxon signed-rank test. Where it is not stated otherwise, bar graphs represent mean ± SEM; individual values for each mouse or each individual are represented as points; mouse experiments were at least performed three times with similar results; unless stated otherwise, we used the Mann–Whitney test. Source data
Extended Data Fig. 2
Extended Data Fig. 2. Iron accumulation promotes fibrogenesis and senescence.
a-b, Flow-cytometric analysis of dissociated lung tissues for the a, macrophage markers CD11b and F4/80, and b, the neutrophil markers CD11b and Ly6G. Representative dot plots of lung cells from mice 2 days post-in PBS (n = 4) or iron (500 nM; n = 4), and quantification. c-d, mRNA levels of c, Pecam-1 (CD31) and d, Vegfa relative to Actb in mouse lungs 2 days post-PBS (n = 8) or 2 days (n = 8-10) and 14 days (n = 6-8) post-iron (500 nM). e, Heat map showing protein expression of significantly altered matrix metalloproteinases (MMP) in the lungs of mice 2 days post-PBS (n = 4) or iron (500 nM; n = 7), measured by a multiplex protein assay; fold change to the right. f, mRNA levels of Col1a1, Col1a2, and Fn1 relative to Actb in mouse lungs 14 days post-PBS (n = 8) or iron (500 nM; n = 9). g, Histochemistry for iron and collagen, by combining enhanced Perl’s Prussian blue and Sirius Red/Fast Green staining. Representative images of mouse lung sections from male mice 2 days post-intratracheal administration of PBS (control; n = 5) or 6 days (n = 4), 14 days (n = 8), and 28 days (n = 4) after intratracheal administration of iron (500 nM; n = 4), and quantification of fibrotic area. Scale bar 2.5 mm for low magnification, and 500 μm for high magnification images. Dashed lines delineate iron and collagen-rich areas. We used the Kruskal–Wallis test. h-j, Histochemistry for iron by enhanced Perl’s Prussian blue staining, and immunohistochemistry for F4/80, p21, γH2AX, and histochemical detection of collagen by Sirius red/Fast green staining. h, High magnification (scale bar, 100 μm) and i, low magnification (scale bar, 2.5 mm) representative images of mouse lung sections from female mice 6 days post-PBS (control; n = 3) or iron (500 nM; n = 3), and j, quantification. Where it is not stated otherwise, bar graphs represent mean ± SEM; individual values for each mouse are represented as points; mouse experiments were at least performed three times with similar results; unless stated otherwise, compared distributions using two-tailed unpaired t-test, for multiple comparisons, we used one-way ANOVA. Source data
Extended Data Fig. 3
Extended Data Fig. 3. Vascular insults provoke iron accumulation.
a-c, Histological analysis of mouse lung sections from Tie2-Cre-ERT2- and Tie2-Cre-ERT2+ Rosa26-iDTR mice after two weeks of treatment with tamoxifen and diphtheria toxin. a, Histochemistry for iron and collagen by Perl’s Prussian blue (PPB) and Sirius Red/Fast Green (SRFG) staining, and immunohistochemistry for CD31, Ter-119, and p21. Dashed line indicates area with reduced CD31 expression associated with accumulation of microhemorrhagic RBCs. Scale bar, 250 μm. b, Histochemistry for iron and collagen by enhanced PPB and SRFG staining, and by Masson’s Trichrome staining. Representative images to the left. Scale bar, 100 μm. Quantification of Masson’s Trichrome intensity in Tie2-Cre-ERT2- (n = 4) and Tie2-Cre-ERT2+ (n = 3) Rosa26-iDTR mice to the right. c, Histochemistry for iron and collagen, by enhanced PPB and SRFG staining, and immunohistochemistry for γH2AX. Representative images and quantification of percentage of γH2AX cells in lung sections of in Tie2-Cre-ERT2- (n = 4) and Tie2-Cre-ERT2+ (n = 3) Rosa26-iDTR mice. Scale bar, 50 μm. d, Representative images of H&E staining of mouse lungs 6 days post-PBS or bleomycin (1.5 U/kg of body weight). Scale bar, 50 μm. e, Ex vivo RBC hemolysis assay with different doses of folic acid, with triton X-100 (TX) and PBS. f-g, mRNA levels of f, haptoglobin (Hp) and g, hemopexin (Hpx) relative to Actb in the livers of mice from before (n = 6), and 1 day (n = 5), 3 days (n = 5), 6 days (n = 5), or 24 days (n = 5) post-folic acid. We used one-way ANOVA. h, Immunohistochemistry for HMOX1. Representative images of mouse kidney sections 0 days, 1 day, 3 days, and 24 days post-folic acid. Scale bar, 5 mm. i, Histochemical staining for iron by enhanced PPB, and H&E staining of kidneys from control mice (PBS injected; n = 10), and mice in which kidney fibrosis was induced by folic acid. Mice in the folic acid group either received vehicle (n = 18) or deferiprone injected daily starting 1 day before (DP(d-1); n = 16) or 14 days after (DP(d14); n = 18) disease induction by folic acid. Mice were analyzed on 28 post-FA. Scale bar, 100 μm for upper panels, and 2.5 mm for lower panels. j, Quantification of enhanced PPB positive cells of kidneys from panel j. Where it is not stated otherwise, bar graphs represent mean ± SEM; individual values for each mouse is represented as points; experiments were at least performed three times with similar results; unless stated otherwise, we compared distributions using two-tailed unpaired t-test; for multiple-comparisons, we used the Kruskal–Wallis test. Source data
Extended Data Fig. 4
Extended Data Fig. 4. Iron and lysed erythrocytes cause cellular senescence in vitro.
a, Representative images of cell culture plate wells confluent with MEFs that were cultured in control conditions or in the presence of iron (660 μM) in normoxia or hypoxia, and subsequently stained for SA-β-GAL (n = 6 for each condition). Quantification of SA-β-GAL intensity in wells to the right. Bar graphs represent mean ± SEM; we used one-way ANOVA. Source data
Extended Data Fig. 5
Extended Data Fig. 5. Iron accumulation in senescent cells drives the SASP.
a-b, FTH1 levels in SK-MEL-103 cells before and 3, 6, and 11 days post-damage (n = 2 for each condition) by a, palbociclib (1 µM) and b, bleomycin (10mU/ml), and after 3 days of culture in the presence of deferiprone (DP; 100 μM) or iron (140 μM). Densitometric analysis to the right. c, ZIP14 levels in SK-MEL-103 cells before (n = 2) and 3 days after culture in the presence of iron (140 μM) or deferiprone (DP; 100 μM), or 3, 6, 11 and 21 days post-damage by bleomycin (10mU/ml; n = 2 for each condition), doxorubicin (100 nM; n = 2 for each condition) or palbociclib (1 µM; nday3 = 2; n = 1 for all other conditions). Representative images and densitometric analysis. d-e, Enhanced Perl’s Prussian blue staining of SK-MEL-103, IMR90, and MEF control or senescent cells. Senescence was induced by d, overexpression of mutant RasG12V in IMR90 cells, or by e, bleomycin (10mU/ml), doxorubicin (100 nM) or palbociclib (1 µM) followed by culture for 21 days. f-g, Total ROS levels measured by flow cytometry in control (ndoxo=3; npalbo = 3) and senescent SK-MEL-103 cells, which received 30 minutes prior to the measurement vehicle (ndoxo=3; npalbo = 3) or deferiprone (DP; 200 μM; ndoxo = 6; npalbo = 6). Senescence was induced by f, doxorubicin (100 nM), or g, palbociclib (1 µM). Representative histograms and quantification. h, Representative plots and quantification of cell viability analyzed by flow cytometry by annexin-V and propidium iodide (PI) staining in senescent MEFs cultured with deferiprone (200 µM; n = 3) or vehicle (water; n = 3) for 4 days. i, Representative images and quantification of SA- β-GAL staining in control (untreated) and senescent (doxorubicin, c = 100 nM; or Palbociclib, c = 1 µM) SK-MEL-103 cells. Senescence was induced in the presence of the iron chelator deferiprone (DP; c = 200 μM) for 4 days followed by 3 additional days of culture (n = 3 for each condition). Scale bar, 100 μm. j, Representative images and quantification of BrdU staining, and SA-β-GAL staining of control and senescent (doxorubicin; c = 100 nM) SK-MEL-103 cells. 7 days post-senescence induction, cells were treated with the iron chelator deferiprone (DP; 100 μM) or vehicle (water) for 4 days. Scale bar, 50 μm (upper panel), and 100 μm (lower panel), (n = 3 for each condition). Where it is not stated otherwise, bar graphs represent mean ± SEM; experimental replicates are represented as points; experiments were at least performed three times with similar results; we compared distributions using two-tailed unpaired t-test; for multiple-comparisons, we used one-way ANOVA. Source data
Extended Data Fig. 6
Extended Data Fig. 6. Single-cell dynamics of iron accumulation in lung fibrosis.
a-e, snRNA-seq analysis of cells from lungs of control mouse receiving intratracheal administration of PBS (6 days; n = 1), and mice receiving intratracheal iron (500 nM) 2 days (n = 1) or 6 days (n = 1) prior to analysis. a, UMAP visualization of the merged dataset. Cell types are distinguished by color. b, UMAP visualization of cells after using an anchors-based integration. Cell types are distinguished by color. c, Percentages of cell types that changed in abundance in response to intratracheal iron. d, Violin plots showing changes in the expression of Cdkn1a (p21), and the SenMayo senescence signature in individual cell types in response to intratracheal iron delivery. e, Expression of prominent secreted factors involved in fibrogenesis, and associated with inflammation, chemoattraction, and tissue remodeling across cell types and conditions. Dot plot showing the average scaled expression of an individual gene across all cells and conditions. % expressed shows the percentage of cells that showed detectable expression of the analyzed gene within a specific cell type at a specific condition. Source data
Extended Data Fig. 7
Extended Data Fig. 7. Single-cell dynamics of iron accumulation in lung fibrosis.
a-b, Scatter plots showing the expression of a, a cell proliferation signature in goblet cells and b, Col1a1 in fibroblast 2 cells from control lung, and mouse lungs 2 days or 6 days post-iron with respect to ferritin expression. c-e, Analysis of human lung scRNA-seq meta-analysis from control patients and patients with IPF. c, GSEA of the IAS in the comparison between control and IPF lung tissues. d-e, ratio of cells positive both for the IAS and d, for CDKN1A or e, the SenMayo senescence signature in total lung cells and in individual cell types. Highlighted cell types presented with double positive cells significantly more frequently in IPF donors (n = 19) than control donors (n = 26). Bar plots represent mean ± SEM of the percentage of double positive cells. Each dot corresponds to a donor.
Extended Data Fig. 8
Extended Data Fig. 8. Iron detected by MRI as a biomarker of kidney fibrosis.
a, Representative images of histochemistry for iron and collagen by combining enhanced Perl’s Prussian blue and Sirius Red/Fast Green staining in kidney sections from mice 28 days after intraperitoneal injection of vehicle (control) or folic acid (FA).

References

    1. Wynn, T. A. Cellular and molecular mechanisms of fibrosis. J. Pathol.214, 199–210 (2008). - PMC - PubMed
    1. Kong P, Christia P, Frangogiannis NG. The pathogenesis of cardiac fibrosis. Cell. Mol. Life Sci. 2013;71:549–574. doi: 10.1007/s00018-013-1349-6. - DOI - PMC - PubMed
    1. Selman M, Pardo A. When things go wrong: exploring possible mechanisms driving the progressive fibrosis phenotype in interstitial lung diseases. Eur. Respir. J. 2021;58:2004507. doi: 10.1183/13993003.04507-2020. - DOI - PubMed
    1. Panizo S, et al. Fibrosis in chronic kidney disease: pathogenesis and consequences. Int. J. Mol. Sci. 2021;22:408. doi: 10.3390/ijms22010408. - DOI - PMC - PubMed
    1. Wynn TA. Fibrotic disease and the T(H)1/T(H)2 paradigm. Nat. Rev. Immunol. 2004;4:583–594. doi: 10.1038/nri1412. - DOI - PMC - PubMed