. 2024 Aug;8(8):992-1003.
doi: 10.1038/s41551-023-01153-8. Epub 2023 Dec 14.

Restoration of sensory feedback from the foot and reduction of phantom limb pain via closed-loop spinal cord stimulation

Affiliations

Restoration of sensory feedback from the foot and reduction of phantom limb pain via closed-loop spinal cord stimulation

Ameya C Nanivadekar et al. Nat Biomed Eng. 2024 Aug.

Erratum in

Abstract

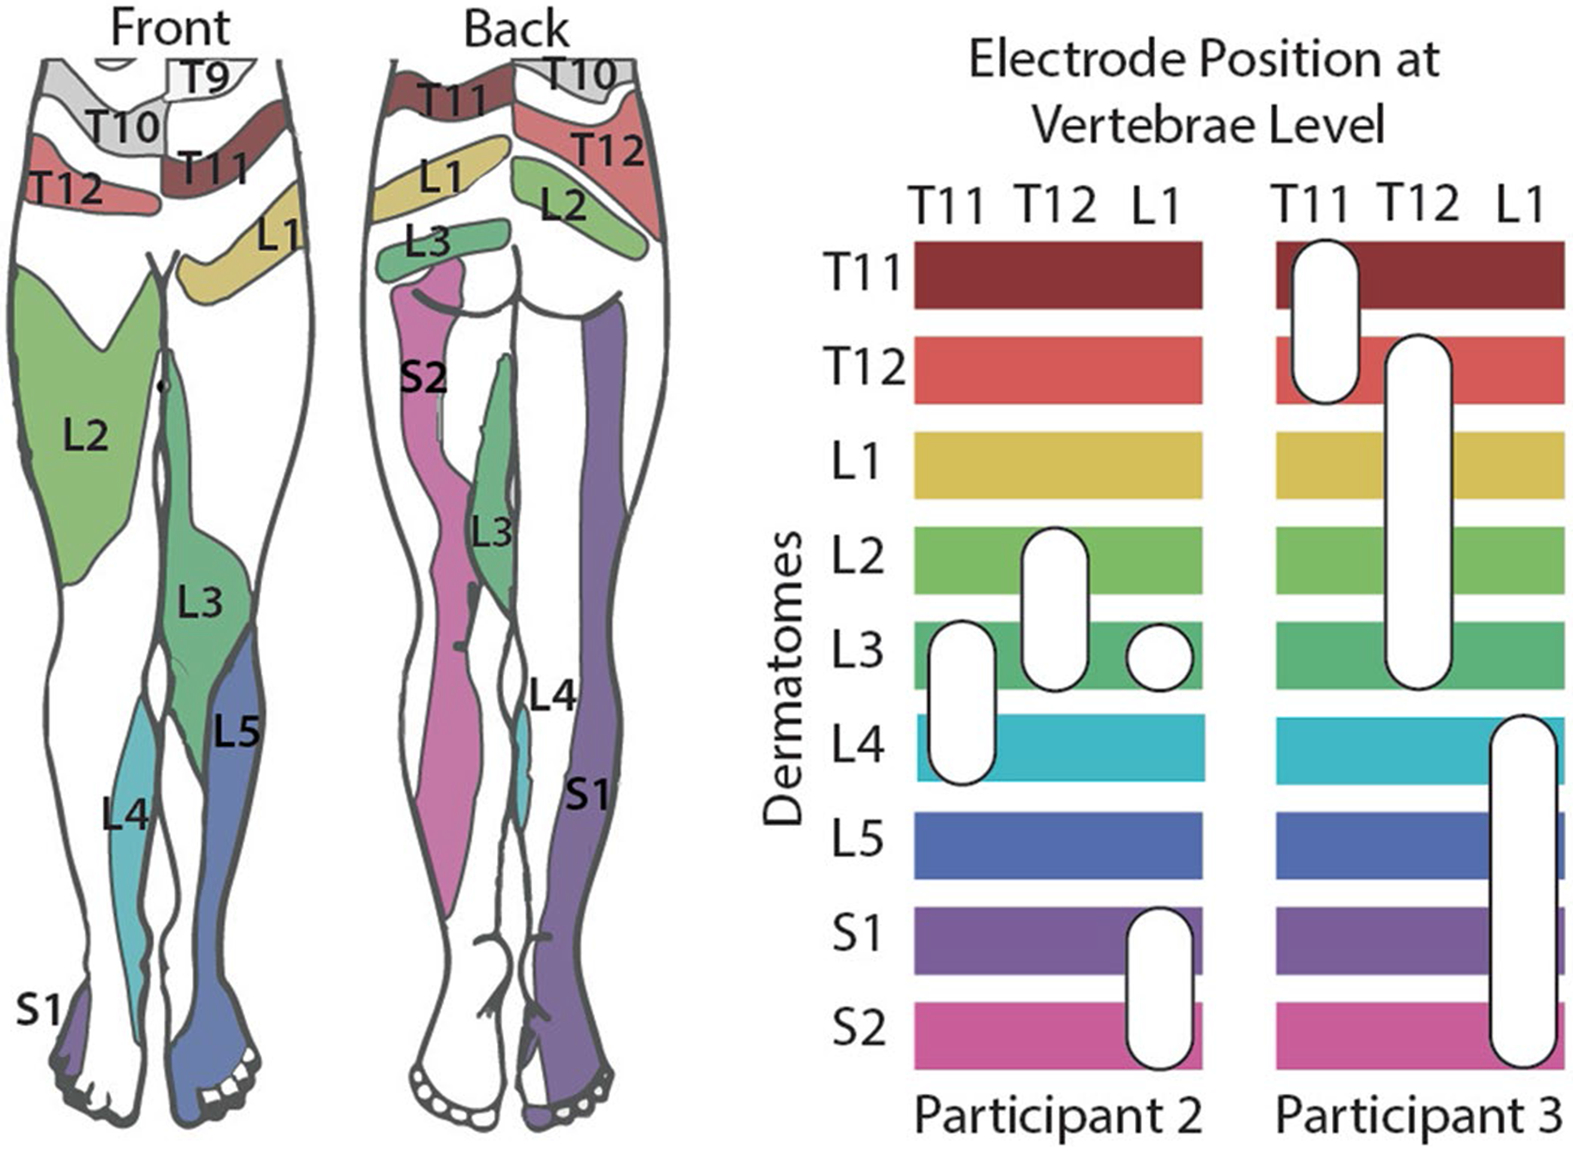
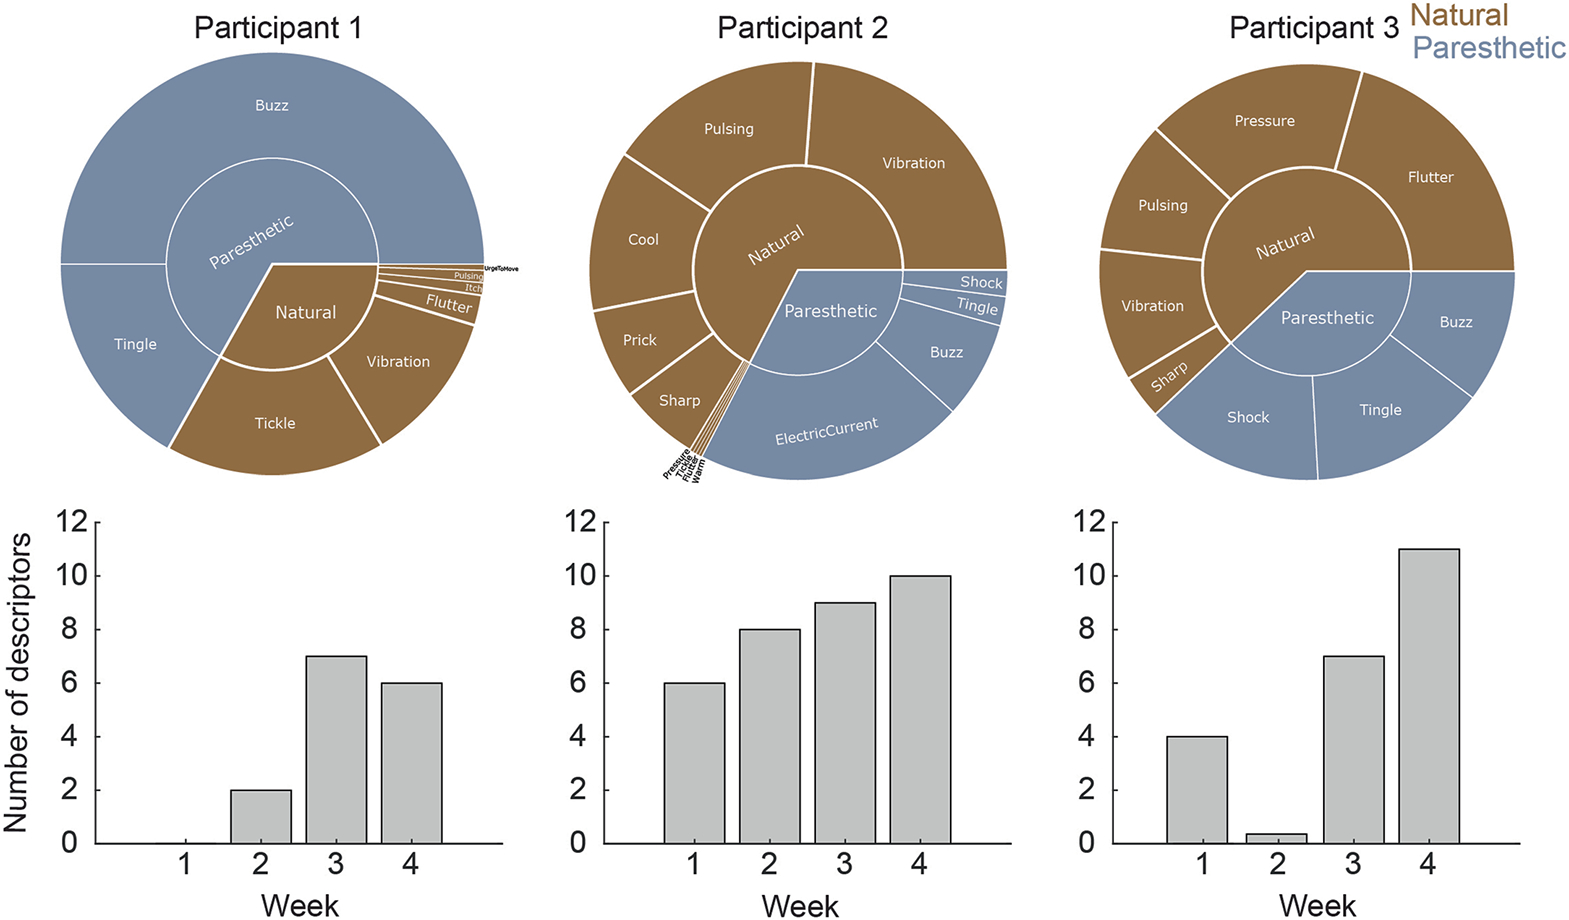
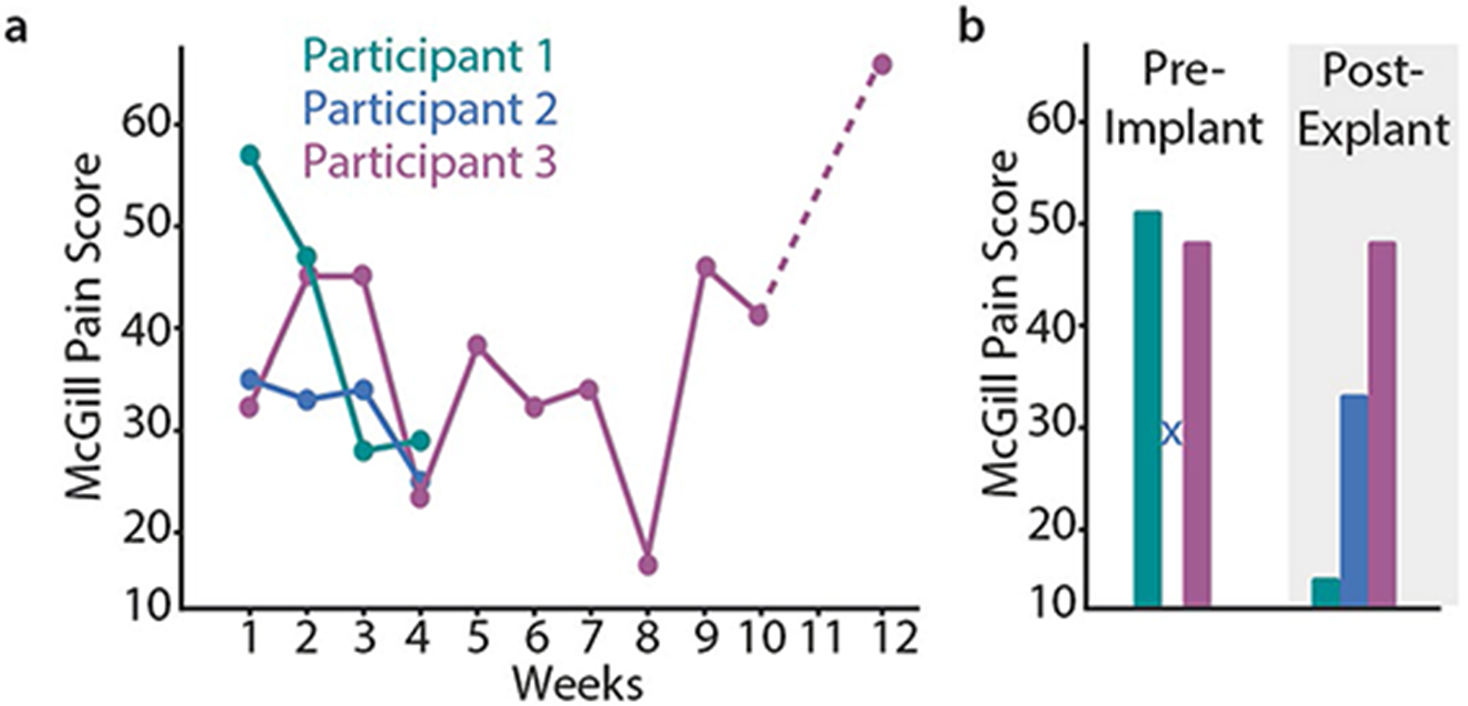
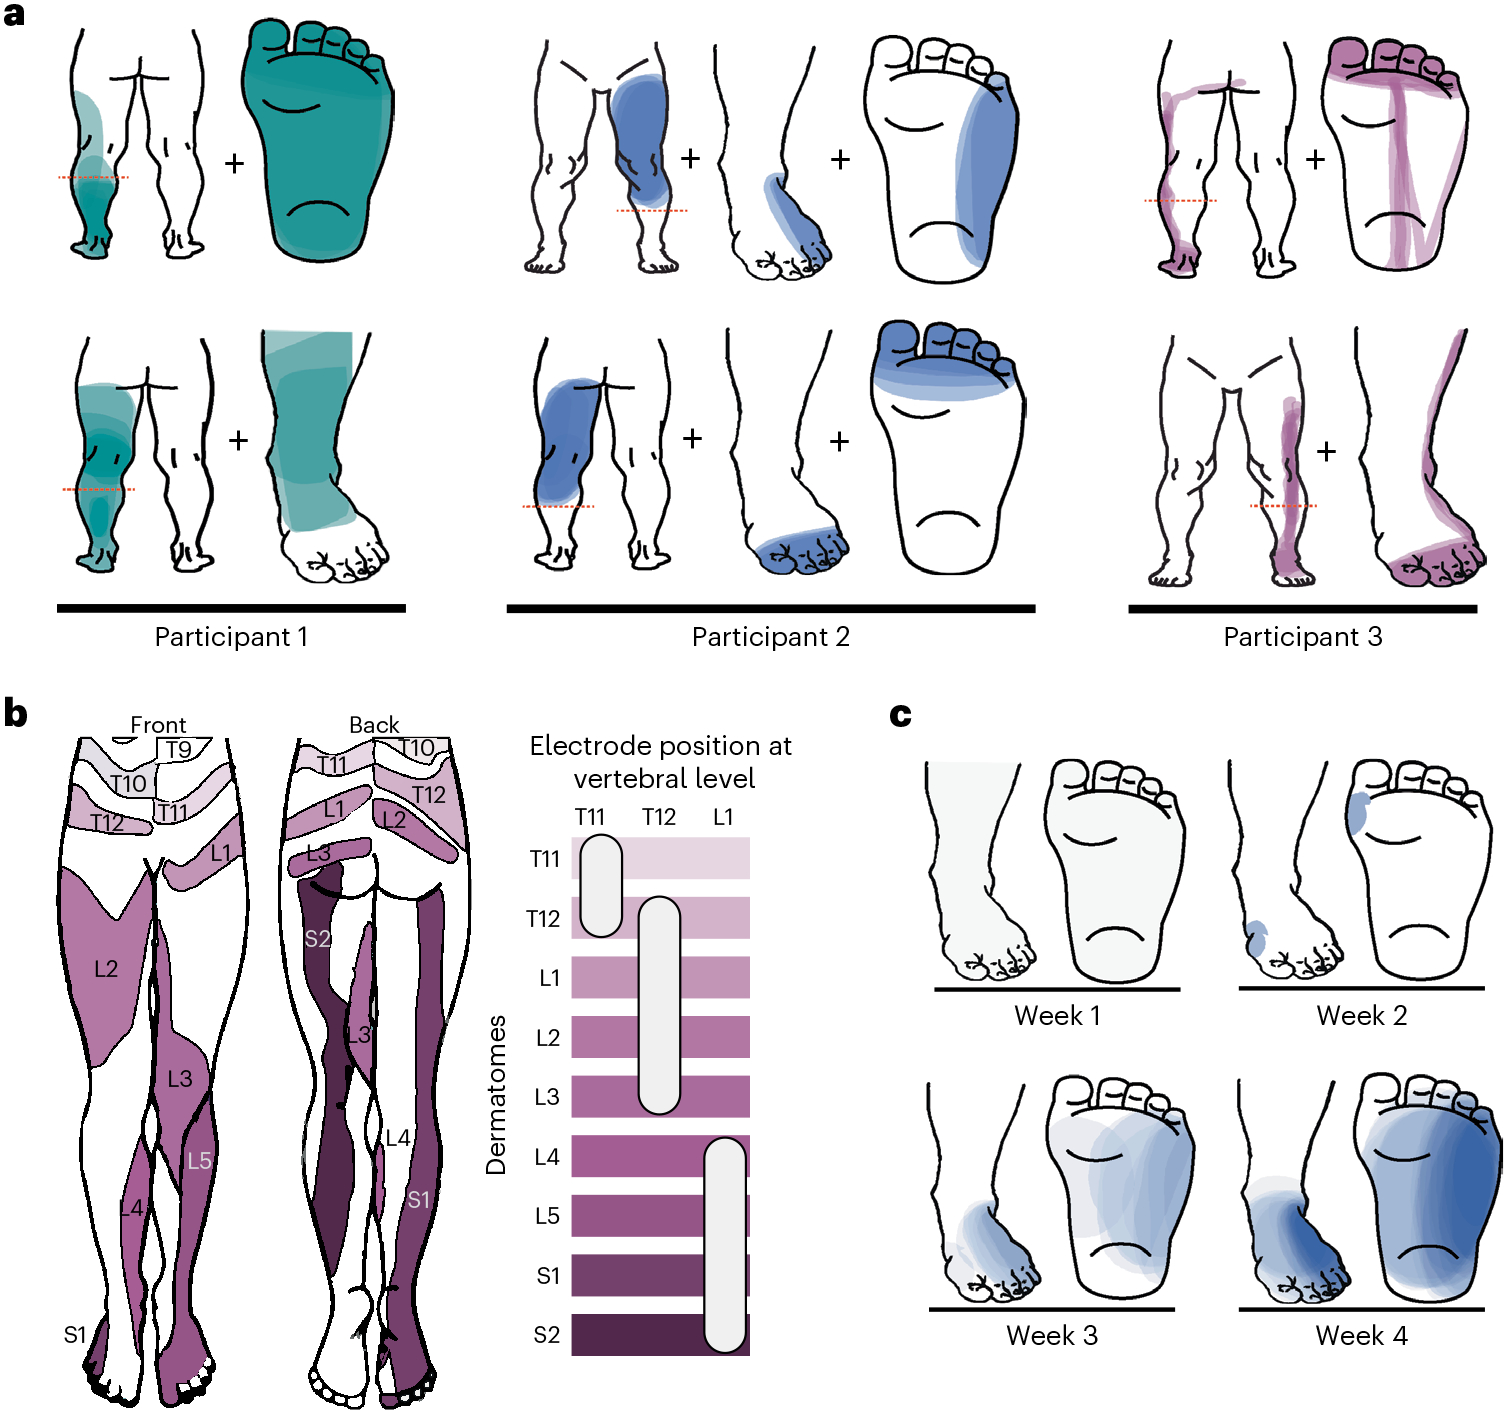
Restoring somatosensory feedback in individuals with lower-limb amputations would reduce the risk of falls and alleviate phantom limb pain. Here we show, in three individuals with transtibial amputation (one traumatic and two owing to diabetic peripheral neuropathy), that sensations from the missing foot, with control over their location and intensity, can be evoked via lateral lumbosacral spinal cord stimulation with commercially available electrodes and by modulating the intensity of stimulation in real time on the basis of signals from a wireless pressure-sensitive shoe insole. The restored somatosensation via closed-loop stimulation improved balance control (with a 19-point improvement in the composite score of the Sensory Organization Test in one individual) and gait stability (with a 5-point improvement in the Functional Gait Assessment in one individual). And over the implantation period of the stimulation leads, the three individuals experienced a clinically meaningful decrease in phantom limb pain (with an average reduction of nearly 70% on a visual analogue scale). Our findings support the further clinical assessment of lower-limb neuroprostheses providing somatosensory feedback.


Figures

Extended Data Fig. 1 ∣
Extended Data Fig. 1 ∣. Sensory integrity and impairments for each participant.
Shaded regions indicate areas with either impaired (light) or absent (dark) light touch sensation as determined by clinical neurological testing.
Extended Data Fig. 2 ∣
Extended Data Fig. 2 ∣. Heatmaps showing the rate of occurrence ofsensations in the missing limb across weeks.
Darker shades indicate higher rate of occurrence of sensations in that location. No testing was done on week 11 for Participant 3.
Extended Data Fig. 3 ∣
Extended Data Fig. 3 ∣. Comparison of the threshold amplitude that evoked sensation in the missing limb (with co-activation in the residual limb) and the threshold amplitude that evoked sensation only in the residual limb.
The threshold amplitude for each testing day was determined by increasing the stimulation amplitude in 0.5 or 1 mA steps and asking the participants to report the location where they perceived the evoked sensation. Error bars show the mean ± standard deviation across multiple days (N = 4 for Participant 1, N = 13 for Participant 2 and N = 8 for Participant 3).
Extended Data Fig. 4 ∣
Extended Data Fig. 4 ∣. Dermatomal activation by electrodes located at different vertebrae levels for Participant 2 and Participant 3.
The left image shows the expected dermatomal innervation in the leg. In the right, the horizontal bars indicate different dermatomes and the white ovals indicate the approximate electrode position that evoked sensations in that dermatome with respect to the vertebrae level. Participant 1 had substantial lead migration across weeks, making it challenging to precisely define the location of the electrodes with respect to vertebrae levels, so we have not included those results.
Extended Data Fig. 5 ∣
Extended Data Fig. 5 ∣. Percept quality of evoked sensations in the missing limb.
The participants were given a list of 13 natural descriptors and 5 paresthetic descriptors to describe the quality of the sensation. The top panel shows the frequency of each descriptor for the two evoked sensations for each participant shown in Fig. 2a. For all reported sensations, we stimulated via each electrode with a 1-sec long pulse train. The bottom panel shows the total number of descriptors used to describe the sensations each week.
Extended Data Fig. 6 ∣
Extended Data Fig. 6 ∣. Additional results from psychophysical discrimination assessment.
a, Variation of Weber fraction for different electrodes In Participant 1 and 2 as a function of the reference amplitude in the discrimination task. b, Variation of JND for the same electrodes in Participants 1 and 2 as a function of the reference amplitude. Participant 3 was discarded from these analyses due to insufficient data points.
Extended Data Fig. 7 ∣
Extended Data Fig. 7 ∣. Full results of Sensory Organization Test (SOT).
a, Participant 2 performed the SOT without stimulation (light blue) with sham stimulation (that is, stimulation in the residual limb only, gray) and with stimulation (stimulation in the prosthetic foot, dark blue). Sham stimulation substantially decreased performance for three of six conditions (with greater than minimum detectable change [MDC, 3.98]), suggesting that stimulation on the residual limb alone was not sufficient to improve performance. b, Participant 3 performed the SOT without stimulation (light magenta) and with stimulation (dark magenta). Both Participant 2 and Participant 3 exhibited improved performance on conditions with platform sway and eyes closed (+5.12 Participant 2, +9.60 Participant 3) and with visual surround sway (+4.04 Participant 2, +13.39 Participant 3). Both participants, however, exhibited decreased performance with stimulation during static standing with eyes closed (−6.25 Participant 2, −4.32 Participant 3). Additionally, Participant 3 had worse performance on static standing with eyes open with stimulation (−4.13). Change in median values reported. * represents a MDC, ** represents a clinically meaningful difference (>8.0).
Extended Data Fig. 8 ∣
Extended Data Fig. 8 ∣. McGill Pain Questionnaire results.
a, Weekly McGill Pain Questionnaire results. b, McGill Pain Questionnaire score before the implant and 1-month post-explant. The pre-implant score for Participant 2 was not recorded and we did not perform testing on week 11 for Participant 3 (indicated by the dashed line).
Fig. 1 ∣
Fig. 1 ∣. Schematic of the closed-loop SCS system used in this study.
Electrical stimulation was delivered to the spinal cord via two or three 8- or 16-contact leads implanted percutaneously near the lateral lumbosacral spinal cord. The leads were tunnelled through the skin and connected to an external stimulation system. A sensorized insole was inserted into the shoe to measure pressure under the prosthetic foot, the signals from this insole were used to modulate stimulation amplitude for SCS electrodes implanted in the lateral thoracolumbar epidural space, and the stimulation evoked sensations that appeared to emanate from the missing limb. The purple region of the leg and foot shows the location of evoked sensation in one participant, and the red dotted line represents the end of the residual limb for this participant with left trans-tibial amputation.
Fig. 2 ∣
Fig. 2 ∣. SCS evokes percepts in the missing limb.
a, Examples of percepts evoked in the missing and residual limbs from one session for each participant. Two different sensations (corresponding to stimulation through two different electrodes) are shown for each participant (top and bottom). The red dashed line indicates the level of the amputation. The coloured area represents the location of the perceived sensation, with darker colours representing more frequent reports of sensation at that location across trials, normalized within each participant. b, Dermatome activation by electrodes located at different vertebral levels for participant 3. Left: expected dermatomal innervation in the leg, adapted from ref. . Right: horizontal bars indicate different dermatomes, and the white ovals indicate the approximate electrode position that evoked sensations in those dermatomes, with respect to vertebral level. c, Rate of occurrence of sensations in the missing limb across weeks from one electrode in participant 2. Darker shades indicate more frequent reports of evoked sensations in the foot.
Fig. 3 ∣
Fig. 3 ∣. Psychophysical assessment of evoked sensations.
a, Performance of participant 1 on the detection task for one electrode, showing the proportion of times the stimulus interval was correctly selected as a function of stimulus amplitude. The bold line shows a cumulative-normal curve fit to the data. b, Psychometric functions for the subset of electrodes (N = 7 across all participants) in which psychophysical assessment of detection threshold was assessed, colour-coded by participant. Solid lines correspond to monopolar electrode configurations, and dashed lines correspond to multipolar configurations. The vertical black dashed lines indicate the detection threshold for each electrode. c, Performance of participant 3 on the amplitude discrimination task with a standard amplitude of 2 mA for one electrode. The bold line shows the fitted psychometric function, and the dashed lines indicate the range used to compute the JND (in this case 0.08 mA), given by half the distance between the dotted lines. d, Distribution of JNDs across the three participants on a subset of electrodes (N = 10 sessions from 1 electrode for participant 1, N = 14 sessions from 3 electrodes for participant 2 and N = 2 sessions from 2 electrodes for participant 3). Filled circles correspond to monopolar electrode configurations, and filled diamonds correspond to multipolar configurations. e, Average normalized magnitude ratings as a function of stimulus amplitude for one electrode for participant 2 with 6 repetitions of each stimulus amplitude. The bold line indicates the linear fit to the data. The error bar denotes the mean ± standard deviation across repeated presentations of the same stimulus. f, Scatter plot showing predicted magnitude estimated by a linear model for each electrode (N = 3 sessions from 1 electrode for participant 1, N = 11 sessions from 4 electrodes for participant 2 and N = 4 sessions from 3 electrodes for participant 3) and participant versus the actual stimulation magnitude. Points show average magnitude for each presented amplitude for each electrode, colour-coded by participant. Filled circles correspond to monopolar electrode configurations, and filled diamonds correspond to multipolar configurations. The dashed line represents the unity line.
Fig. 4 ∣
Fig. 4 ∣. Closed-loop sensory feedback improves postural stability.
a, The SOT comprises six conditions, defined by whether the visual surround (middle) and/or platform (right) are swaying while participants have their eyes open or closed. b, For analysis, the centre of gravity (COG) is a projection of the pressure trace onto the force plate to indicate their centre of mass (COM) movement throughout a trial. The equilibrium score is an indication of how well participants maintain their COM within a normative 12.5° limit of anteroposterior sway. Beyond these limits, a fall can occur (red). c, Falls occurred only during conditions without stimulation for both participants (left), and both participants exhibited an improvement in composite equilibrium score (right, N = 1 per condition). This improvement was above the MDC for participant 2 (*MDC = 3.98) and above the threshold for a clinically meaningful difference in participant 3 (**clinically meaningful difference = 8.0). d, Both participants showed a decrease in sway area, indicating greater stability, with stimulation.
Fig. 5 ∣
Fig. 5 ∣. Closed-loop sensory feedback improves gait stability.
a, Example of amplitude modulation with plantar pressure throughout the gait cycle. Stimulation was triggered above a threshold for the metatarsals (purple shading), and either it was maintained at a constant amplitude (for participant 2) or amplitude was modulated linearly with pressure signals (for participant 3). b, The FGA score increased in both participants with stimulation and increased beyond the MDC (**MDC > 4 points) for participant 3, who had a lower baseline score. For bar plot, N = 1 for each participant per condition.
Fig. 6 ∣
Fig. 6 ∣. SCS reduces PLP.
PLP intensity as reported weekly on a VAS for participants 1 and 2 (top row, implanted for 4 weeks) and participant 3 (bottom row, implanted for 12 weeks). The dashed line indicates a clinically meaningful decrease in the pain score. For participant 3, no experiments were conducted during week 11 (marked with a grey box).

References

    1. Sexton AT & Fleming LL Lower extremity amputations. In Medical Management of the Surgical Patient: A Textbook of Perioperative Medicine (eds Walker HK, Lubin MF, Spell NO, Smith RB & Dodson TF) 741–743 (Cambridge University Press, 2006).
    1. Viseux FJF The sensory role of the sole of the foot: review and update on clinical perspectives. Neurophysiol. Clin 50, 55–68 (2020). - PubMed
    1. Petersen BA, Nanivadekar AC, Chandrasekaran S & Fisher LE Phantom limb pain: peripheral neuromodulatory and neuroprosthetic approaches to treatment. Muscle Nerve 59, 154–167 (2019). - PubMed
    1. Kuffler DP Origins of phantom limb pain. Mol. Neurobiol 55, 60–69 (2018). - PubMed
    1. Valle G. et al. Mechanisms of neuro-robotic prosthesis operation in leg amputees. Sci. Adv 7, eabd8354 (2021). - PMC - PubMed

LinkOut - more resources