

Shifts in ophthalmic care utilization during the COVID-19 pandemic in the US
- PMID: 38097811
- PMCID: PMC10721809
- DOI: 10.1038/s43856-023-00416-4
Shifts in ophthalmic care utilization during the COVID-19 pandemic in the US
Abstract
Background: Healthcare restrictions during the COVID-19 pandemic, particularly in ophthalmology, led to a differential underutilization of care. An analytic approach is needed to characterize pandemic health services usage across many conditions.
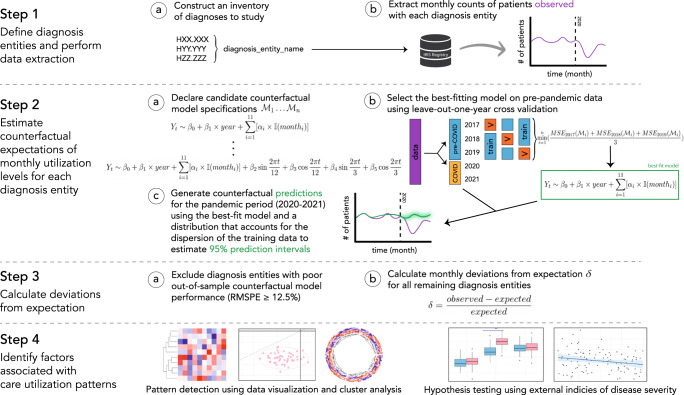
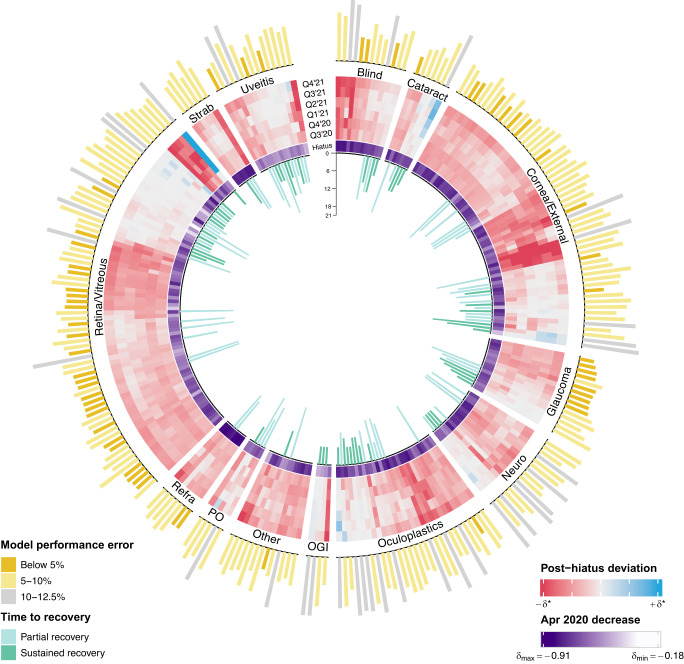
Methods: A common analytical framework identified pandemic care utilization patterns across 261 ophthalmic diagnoses. Using a United States eye care registry, predictions of utilization expected without the pandemic were established for each diagnosis via models trained on pre-pandemic data. Pandemic effects on utilization were estimated by calculating deviations between observed and expected patient volumes from January 2020 to December 2021, with two sub-periods of focus: the hiatus (March-May 2020) and post-hiatus (June 2020-December 2021). Deviation patterns were analyzed using cluster analyses, data visualizations, and hypothesis testing.
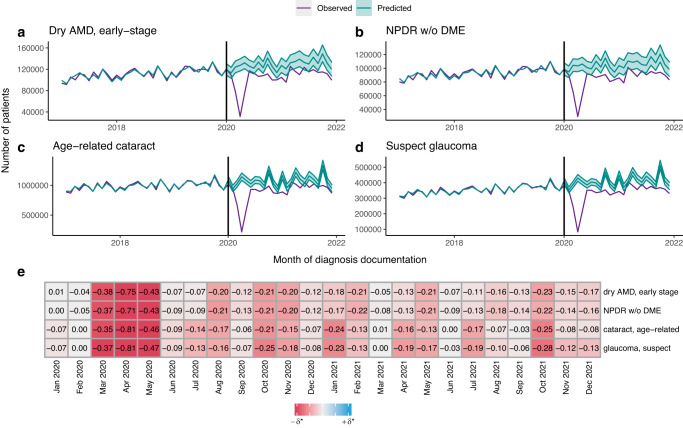
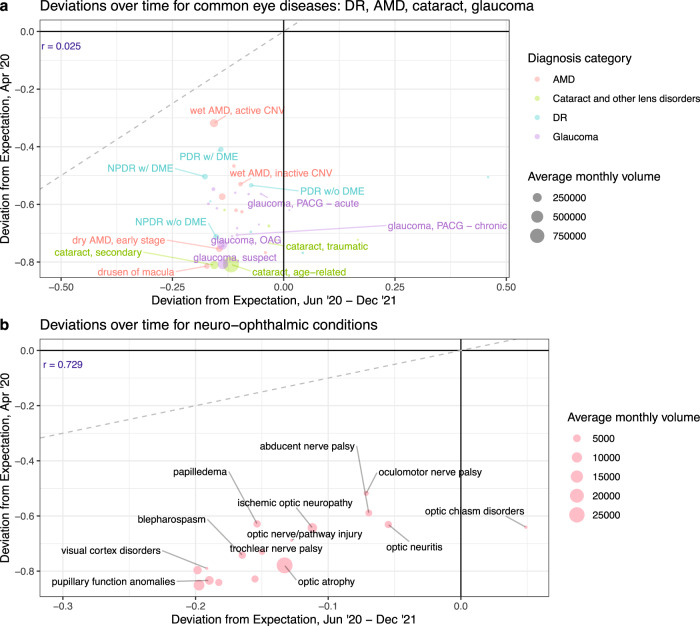
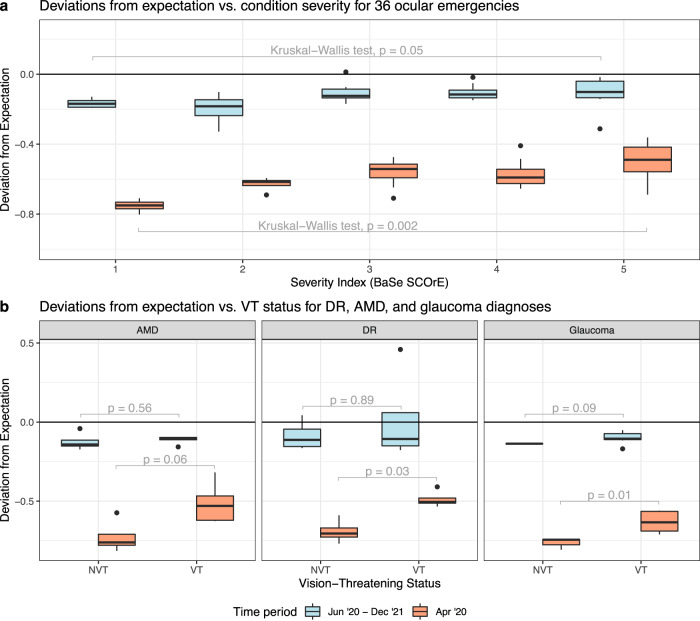
Results: Records from 44.62 million patients and 2455 practices show lasting reductions in ophthalmic care utilization, including visits for leading causes of visual impairment (age-related macular degeneration, diabetic retinopathy, cataract, glaucoma). Mean deviations among all diagnoses are 67% below expectation during the hiatus peak, and 13% post-hiatus. Less severe conditions experience greater utilization reductions, with heterogeneities across diagnosis categories and pandemic phases. Intense post-hiatus reductions occur among non-vision-threatening conditions or asymptomatic precursors of vision-threatening diseases. Many conditions with above-average post-hiatus utilization pose a risk for irreversible morbidity, such as emergent pediatric, retinal, or uveitic diseases.
Conclusions: We derive high-resolution insights on pandemic care utilization in the US from high-dimensional data using an analytical framework that can be applied to study healthcare disruptions in other settings and inform efforts to pinpoint unmet clinical needs.
Plain language summary
The COVID-19 pandemic disrupted healthcare services globally, including eye care in the United States. Using a US eye disease database, we measured how the pandemic impacted patient visits for 261 eye diagnoses by comparing actual visit volumes for each diagnosis with what would have been expected without the pandemic. We identified groups of conditions with similar changes in visit levels and examined whether these shifts were related to characteristics of the diagnoses studied. We found extended decreases in patient presentations for most eye conditions, with greater reductions for less severe diagnoses, and with anomalies and differences in this trend across diagnosis categories and pandemic sub-periods. This highlights areas of potentially unmet need in vision care arising from the pandemic.
© 2023. The Author(s).
Conflict of interest statement
The authors declare no competing interests.
Figures

Similar articles
-
Optic Neuritis and Cranial Neuropathies Diagnosis Rates before Coronavirus Disease 2019, in the Initial Pandemic Phase, and Post-Vaccine Introduction.Ophthalmology. 2024 Jan;131(1):78-86. doi: 10.1016/j.ophtha.2023.08.021. Epub 2023 Aug 25. Ophthalmology. 2024. PMID: 37634758
-
Visits to the Pediatric Emergency Department for Eye Conditions Before and During the COVID-19 Pandemic.West J Emerg Med. 2022 Mar 24;23(3):424-431. doi: 10.5811/westjem.2022.1.53392. West J Emerg Med. 2022. PMID: 35679502 Free PMC article.
-
Patient Perceptions of SARS-CoV-2 Exposure Risk and Association With Continuity of Ophthalmic Care.JAMA Ophthalmol. 2021 May 1;139(5):508-515. doi: 10.1001/jamaophthalmol.2021.0114. JAMA Ophthalmol. 2021. PMID: 33704358 Free PMC article.
-
COVID-19: The regional impact of COVID-19 on the certification of vision impairment in Northern Ireland.Ophthalmic Physiol Opt. 2021 Jan;41(1):136-143. doi: 10.1111/opo.12757. Epub 2020 Nov 9. Ophthalmic Physiol Opt. 2021. PMID: 33165967
-
Eye health literacy across the world and in Australia.Clin Exp Optom. 2025 May 4:1-12. doi: 10.1080/08164622.2025.2492768. Online ahead of print. Clin Exp Optom. 2025. PMID: 40320376 Review.
Cited by
-
Detection Rate of Diabetic Retinopathy Before and After Implementation of Autonomous AI-based Fundus Photograph Analysis in a Resource-Limited Area in Belize.Clin Ophthalmol. 2025 Mar 21;19:993-1006. doi: 10.2147/OPTH.S490473. eCollection 2025. Clin Ophthalmol. 2025. PMID: 40144136 Free PMC article.
-
Impact of the Coronavirus Disease 2019 Pandemic on Initiation Therapy for Noninfectious Uveitis.Ophthalmol Sci. 2025 Jan 27;5(4):100718. doi: 10.1016/j.xops.2025.100718. eCollection 2025 Jul-Aug. Ophthalmol Sci. 2025. PMID: 40212929 Free PMC article.
References
-
- World Health Organization. Third round of the global pulse survey on continuity of essential health services during the COVID-19 pandemic: November–December 2021. 2022. (https://www.who.int/publications/i/item/WHO-2019-nCoV-EHS_continuity-sur... accessed 23 Aug 2022).
-
- McGough, M., Amin, K. & Cox, C. How has healthcare utilization changed since the pandemic? [Internet]. Peterson-KFF Health System Tracker. [cited 2023 Apr 8]; Available from: https://www.healthsystemtracker.org/chart-collection/how-has-healthcare-... (2023).
-
- Mehrotra, A. et al. The impact of COVID-19 on outpatient visits in 2020: visits remained stable, despite a late surge in cases [Internet]. The Commonwealth Fund. Available from: https://www.commonwealthfund.org/publications/2021/feb/impact-covid-19-o... (2021).
-
- Gillis, K. Impacts of the COVID-19 pandemic on 2020 medicare physician spending [Internet]. American Medical Association. Available from: https://www.ama-assn.org/system/files/2020-prp-covid-impact-medicare-phy... (2021).
-
- Gallagher, K., Gerhart, J., Amin, K., Rae, M. & Cox, C. Early 2021 data show no rebound in health care utilization [Internet]. Peterson-KFF Health System Tracker. [cited 2022 Mar 29]; Available from: https://www.healthsystemtracker.org/brief/early-2021-data-show-no-reboun... (2021).
LinkOut - more resources
Full Text Sources
