Meta-Analysis
. 2023 Dec 14;24(1):287.
doi: 10.1186/s13059-023-03120-7.

A time-resolved meta-analysis of consensus gene expression profiles during human T-cell activation

Affiliations
Meta-Analysis

A time-resolved meta-analysis of consensus gene expression profiles during human T-cell activation

Michael Rade et al. Genome Biol. .

Abstract

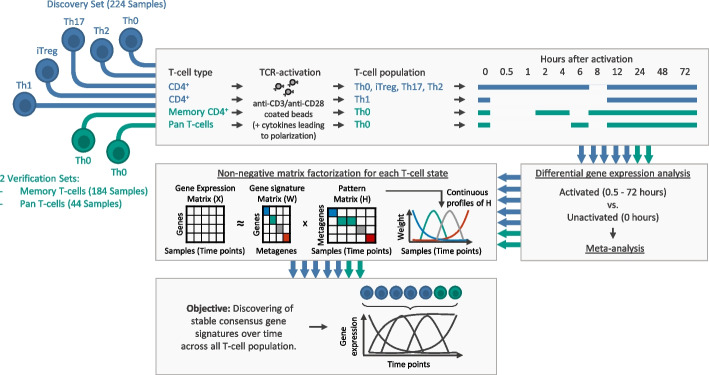
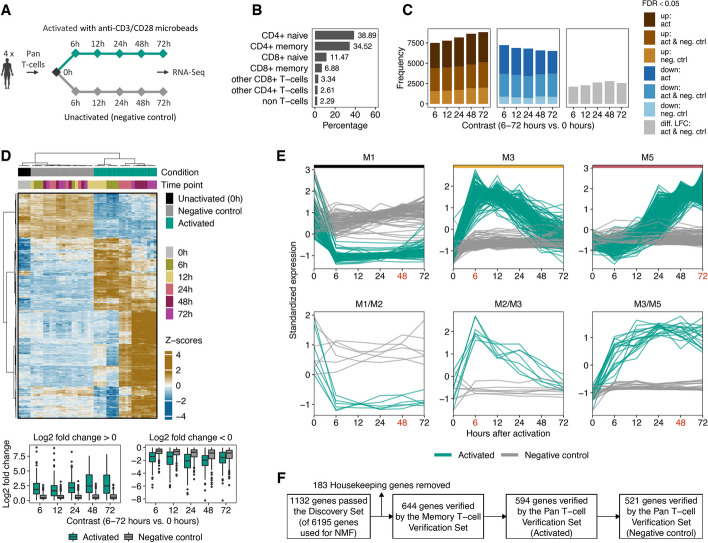
Background: The coordinated transcriptional regulation of activated T-cells is based on a complex dynamic behavior of signaling networks. Given an external stimulus, T-cell gene expression is characterized by impulse and sustained patterns over the course. Here, we analyze the temporal pattern of activation across different T-cell populations to develop consensus gene signatures for T-cell activation.

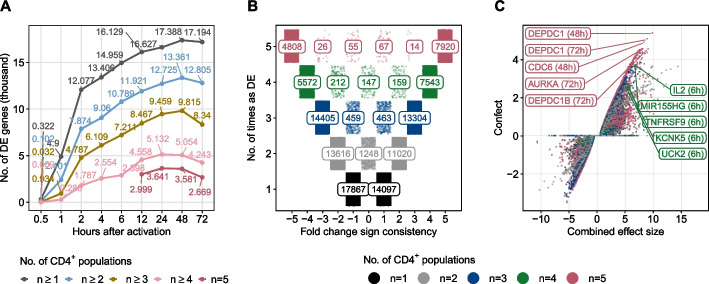
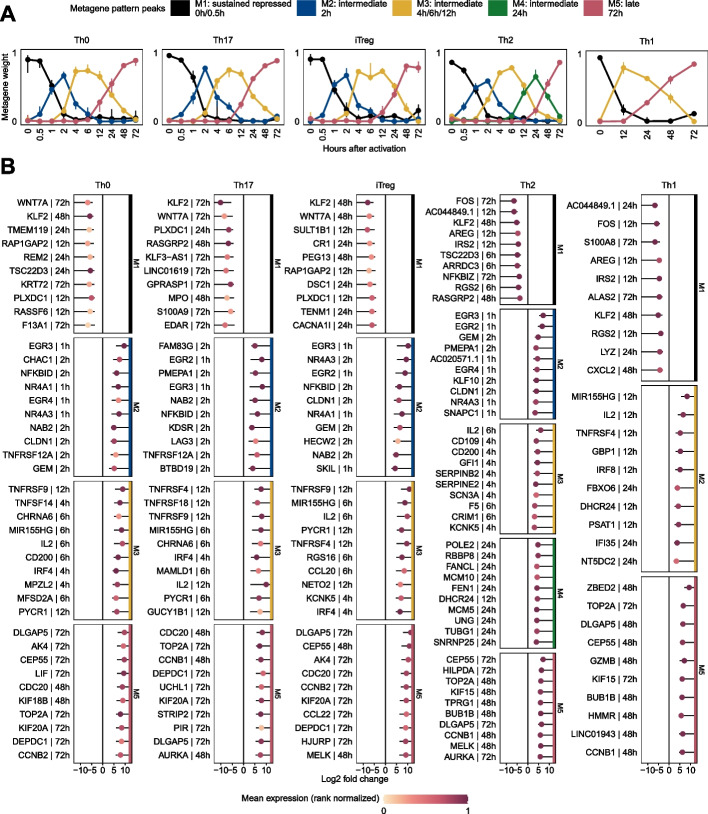
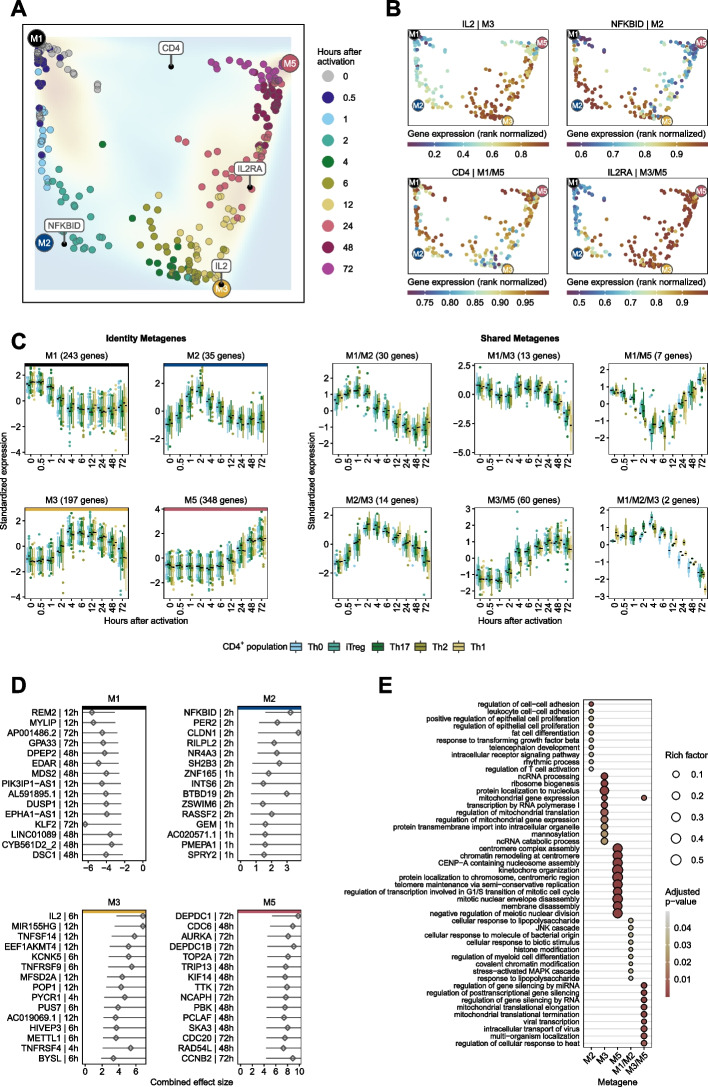
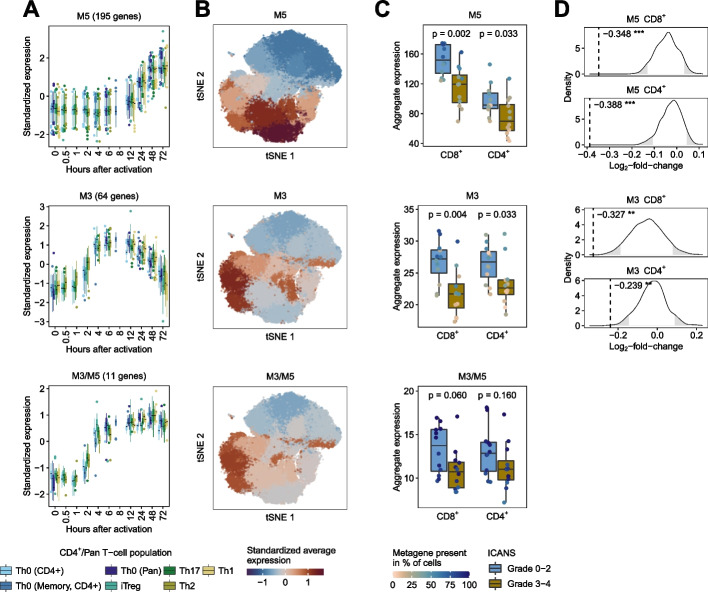
Results: Here, we identify and verify general biomarker signatures robustly evaluating T-cell activation in a time-resolved manner. We identify time-resolved gene expression profiles comprising 521 genes of up to 10 disjunct time points during activation and different polarization conditions. The gene signatures include central transcriptional regulators of T-cell activation, representing successive waves as well as sustained patterns of induction. They cover sustained repressed, intermediate, and late response expression rates across multiple T-cell populations, thus defining consensus biomarker signatures for T-cell activation. In addition, intermediate and late response activation signatures in CAR T-cell infusion products are correlated to immune effector cell-associated neurotoxicity syndrome.

Conclusion: This study is the first to describe temporally resolved gene expression patterns across T-cell populations. These biomarker signatures are a valuable source, e.g., monitoring transcriptional changes during T-cell activation with a reasonable number of genes, annotating T-cell states in single-cell transcriptome studies, or assessing dysregulated functions of human T-cell immunity.

Keywords: Biomarkers; Gene expression; Non-negative matrix factorization; T-cell activation; Temporal gene profiles; Time series; Transcriptome.


Conflict of interest statement

The authors declare that they have no competing interests.

Figures

Fig. 1
Fig. 1
Workflow for discovering and verifying of temporal consensus gene expression signatures of T-cells. We analyzed transcriptome data from T-cells after in vitro activation with anti-CD3/anti-CD28 coated beads (Th0) or in the presence of stimulation beads and differentiating cytokines (polarization towards Th1, Th2, Th17, and iTreg T-cell fates). For each T-cell population, we performed DGEA to find DE (FDR < 0.05) genes of activated T-cell populations at different analysis time points compared to unactivated T-cell populations (time series of gene expression arrays and RNA-seq data). To find DE genes with a significant combined effect size (FDR < 0.05) across CD4+ T-cell populations from the Discovery Set (highlighted in blue), we conducted a meta-analysis. Only DE genes with a significant combined effect size in at least one contrast (0.5 to 72 h vs. 0 h) across the available populations (4 populations for time course 0.5 to 6 h of activation, 5 populations for time course 12 to 72 h of activation) were used for NMF. We conducted NMF to infer expression changes over time and to discover stable continuous metagenes (i.e., sets of genes with similar expression patterns across the analysis time points) across all T-cell populations. For verification of the temporal consensus gene signature, we analyzed 2 independent RNA-Seq datasets (highlighted in green). The Discovery- and Memory T-cell Verification Set are based on publicly available datasets
Fig. 2
Fig. 2
Common trends across CD4+ T-cell populations from the Discovery Set. A Inverse cumulative distributions of DE genes (FDR < 0.05) in the Discovery Set for each time point during activation compared to unactivated CD4+ T-cells. The colored curves represent the number of DE genes in at least n T-cell populations. Analysis time points 12 to 72 h were available for all 5 CD4+ T-cell populations. B Depicting the number of T-cell populations in which genes were identified as DE (y-axis) and the number of genes with consistent fold changes across T-cell populations (x-axis). For example, a gene that is significantly differentially expressed in 3 T-cell populations after 12 h of activation, of which it is down-regulated in 2 populations, will get a fold change sign consistency of 1 + (− 2) =  − 1 (x-axis). An example of how to read the numbers: 7920 genes (top right) were identified as DE in all 5 T-cell populations. These DE genes were also upregulated in all 5 T-cell populations at the same time point of activation. Colors represent the number of T-cell populations in which genes were significantly differentially expressed. C Shown are DE genes with a combined effect size identified in the meta-analysis using a random effect model in at least 2 T-cell populations. The x-axis represents the combined effect size, the y-axis the “confect” value, a confident inner bound of the calculated combined effect size (see the “Methods” sction). Genes that do not show a significant combined effect size (FDR > 0.05) have a “confect” value of 0
Fig. 3
Fig. 3
Temporal profiles obtained from NMF. A The pattern matrix for each CD4+ T-cell population from the Discovery Set is shown as continuous profiles, with samples assigned to time points of activation. We scaled each column in the pattern matrix to sum up to one. Dots depict median weights for all samples from identical analysis time points. Vertical lines represent interquartile ranges. We annotated and colored the metagenes based on their maximum median values across all analysis time points. The time point with the maximum median value is depicted in the legend. B Top 10 genes associated with metagenes for each T-cell population. For each CD4+ T-cell population and gene used for NMF, we used the highest absolute “confect” value estimated in the DGEA across all contrasts (e.g., 12 h vs. 0 h). Genes are ranked by “confect” values. Dots represent log2 fold changes for contrasts with the highest absolute “confect” value. The time point to the right of the gene represents the contrast with the highest absolute “confect” value. For example, “12 h” represents the following contrast: a sample group activated for 12 h compared to unactivated samples of the same group. The color of the dots corresponds to rank normalized average expression values of the activation group in contrast with the highest absolute “confect.” The inner end of the horizontal line shows the “confect” value (inner confidence bound). NFKBID denotes NF-κB
Fig. 4
Fig. 4
Consensus gene expression profiles for CD4+ T-cells from the Discovery Set. A Metagene landscape. We embedded all samples relative to temporally coherent metagenes using the pattern matrix. All genes that we used for NMF were embedded relative to the temporally coherent metagenes using the gene signature matrix and depicted as a density map. For IL2, IL2RA, CD4, and NF-κB (NFKBID) we calculated the average metagene weights across the CD4+ T-cell populations and depicted them as dots in the metagene landscape. B Each sample is colored by the rank normalized gene expression of the corresponding gene. C We grouped the consensus expression profiles over the course by genes associated with identity and shared metagenes. Each boxplot represents one CD4+ T-cell population from the Discovery Set. The y-axis depicts the standardized median expression of genes from samples with identical analysis time points. The number in parentheses represents the number of genes for the corresponding metagene. D Top 15 genes associated with identity metagenes. For each gene belonging to the consistent metagenes, we used the highest absolute “confect” value estimated in the meta-analysis. Genes were ranked according to their absolute highest “confect” value. Diamonds represent the combined effect size from the meta-analysis for the activation time point with the highest absolute “confect” value. The time point to the right of the gene represents the time point of the highest absolute “confect” value. The inner end of the horizontal line shows the “confect” value (inner confidence bound). E The top 10 (sorted by rich factor) significantly enriched GO terms of biological processes (FDR < 0.05) of metagene-associated genes identified by enrichment analysis. The dot size indicates the rich factor, which is the number of metagene-associated genes in the GO term divided by the number of background genes of the term. Colors indicate adjusted p-values of significantly enriched GO terms
Fig. 5
Fig. 5
Verification of consensus temporal gene signature. A Experimental design for the Pan T-cell Verification Set. We performed RNA Sequencing of Pan T-cells from 4 healthy donors at 5 different time points after anti-CD3/anti-CD28 activation (6 to 72 h) and of unactivated (0 h) T-cells. In addition, we sequenced Pan T-cells for the same time points without activation as negative controls. B Depicted are the fractions of Pan T-cell populations before activation. 200,000 cells were analyzed using seven human blood donors (see Additional file 1 for details). C For each contrast (6 to 72 h of activation and without activation vs. 0 h), we performed a DGEA. The brown and blue bar plots depict the number of DE genes (FDR < 0.05) for each contrast that is up- (brown) or down-regulated (blue) under activated (act), unactivated (neg. ctrl) conditions, or both (act and neg. ctrl). Gray bar plots show the number of DE genes under activated and unactivated conditions without consistent log2 fold change. D Hierarchical clustering of DE genes from the Pan T-cell Verification Set in activated and unactivated conditions. Only genes from the consensus signatures that passed the activation kinetics of both Verification Sets are shown. Euclidean distance with Ward clustering was applied to visualize the similarity between samples. Each column represents a sample, each row represents a gene. The y-axis depicts the standardized median CPM expression values of genes from samples with identical analysis time points. Bottom panel: For each contrast and condition, boxplots of log2 fold changes are shown. E For the Pan T-cell Verification Set the temporal expression pattern of genes from the consensus signatures that passed the 2 Verification Sets (activation and negative control kinetics) are shown. CPM values were z-score standardized. Identity metagenes are highlighted with colored horizontal bars (M1, M3, and M5). The red-colored time points indicate the maximum centroid threshold (see the “Methods” section). Only metagenes with more than 10 genes are shown. F Flowchart depicting the number of genes passing each filter step
Fig. 6
Fig. 6
Re-analysis of data scRNA-Seq data of autologous anti-CD19 CAR T-cell infusion products from 24 patients with LBCL. AC Metagenes with at least 10 genes among the most highly variable genes in the scRNA-Seq dataset were analyzed. A The boxplots in the left panel show grouped consensus expression profiles over the course by genes associated with identity and shared metagenes. Each boxplot represents one T-cell population from the Discovery and Verification Sets. The y-axis depicts the standardized median expression of genes from samples with identical analysis time points. The number in brackets above the boxplots indicates the number of highly variable genes of the metagene present in the scRNA-Seq data. B We embedded CD8+CD4 and CD8CD4+ T-cells from 24 patients into a two-dimensional space by the t-distributed stochastic neighbor embedding (tSNE) method. The colors indicate the standardized average expression of the metagenes for each cluster (the same value is assigned to all cells in a cluster). C For each metagene and patient, we calculated aggregated expression (summed average expression) for CD8+CD4 and CD8CD4.+ cells. Differences in aggregated expression between patients with low- and high-grade ICANS were evaluated using the Wilcoxon rank-sum test. The colors of the dots in the boxplots indicate the percentage of cells for each patient in which the corresponding metagene is present. We considered a metagene as present in a cell if at least 25% of all associated genes had at least one UMI count. D For each metagene and T-cell population that was significant (p < 0.05) in the Wilcoxon rank-sum test, we generated a null distribution in order to confirm the results (see the “Methods” section). Dashed vertical lines indicate median log2 fold change of aggregated expression between low- and high-grade ICANS patients of the metagene. Rejection regions (empirical p-value < 0.05) are highlighted in grey (* p < 0.05, ** p < 0.01, *** p < 0.001)

References

    1. Smith-Garvin JE, Koretzky GA, Jordan MS. T cell activation. Annu Rev Immunol. 2009;27:591–619. doi: 10.1146/annurev.immunol.021908.132706. - DOI - PMC - PubMed
    1. Malissen B, Grégoire C, Malissen M, Roncagalli R. Integrative biology of T cell activation. Nat Immunol. 2014;15:790–797. doi: 10.1038/ni.2959. - DOI - PubMed
    1. Chapman NM, Boothby MR, Chi H. Metabolic coordination of T cell quiescence and activation. Nat Rev Immunol. 2020;20:55–70. doi: 10.1038/s41577-019-0203-y. - DOI - PubMed
    1. Liu JO. The yins of T cell activation. Sci. STKE. 2005;2005:re1. doi: 10.1126/stke.2652005re1. - DOI - PubMed
    1. Sprent J, Surh CD. Normal T cell homeostasis: the conversion of naive cells into memory-phenotype cells. Nat Immunol. 2011;12:478–484. doi: 10.1038/ni.2018. - DOI - PMC - PubMed

Publication types