

Sustained spike-specific IgG antibodies following CoronaVac (Sinovac) vaccination in sub-Saharan Africa, but increased breakthrough infections in baseline spike-naive individuals
- PMID: 38098482
- PMCID: PMC10720323
- DOI: 10.3389/fimmu.2023.1255676
Sustained spike-specific IgG antibodies following CoronaVac (Sinovac) vaccination in sub-Saharan Africa, but increased breakthrough infections in baseline spike-naive individuals
Abstract
Introduction: This study investigated the antibody responses to the inactivated COVID-19 vaccine, CoronaVac (Sinovac Biotech) in the African population to provide valuable insights into long-term immunity and breakthrough infections against SARS-CoV-2 in individuals with varying prior IgG seropositivity.
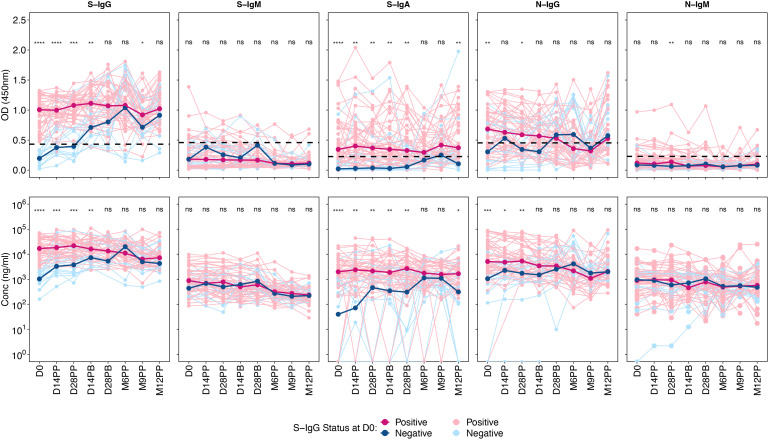
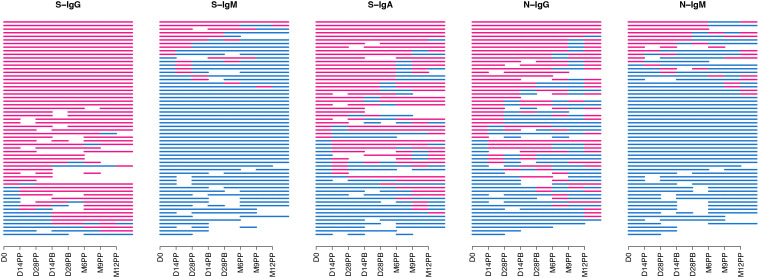
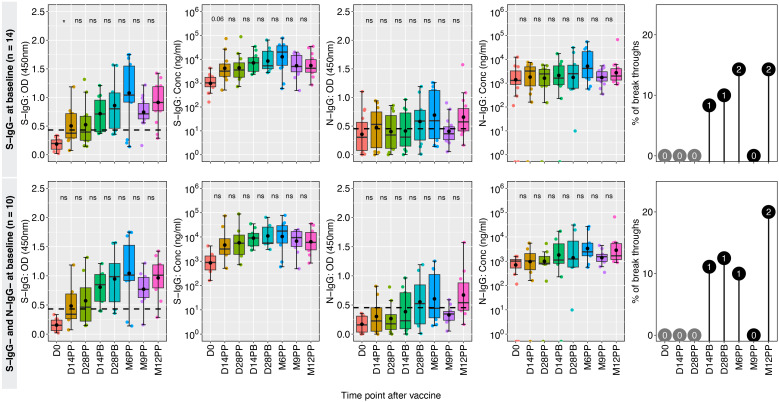
Methods: Real-life cohorts were used to longitudinally track antibody levels against the SARS-CoV-2 spike and nucleoprotein in 60 participants over 12 months to examine the levels of multiple antibody isotypes (S-IgG, S-IgM, S-IgA, N-IgG, and N-IgM).
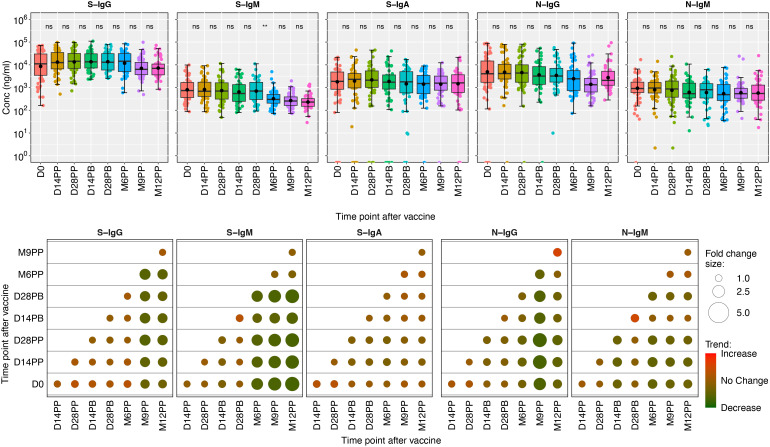
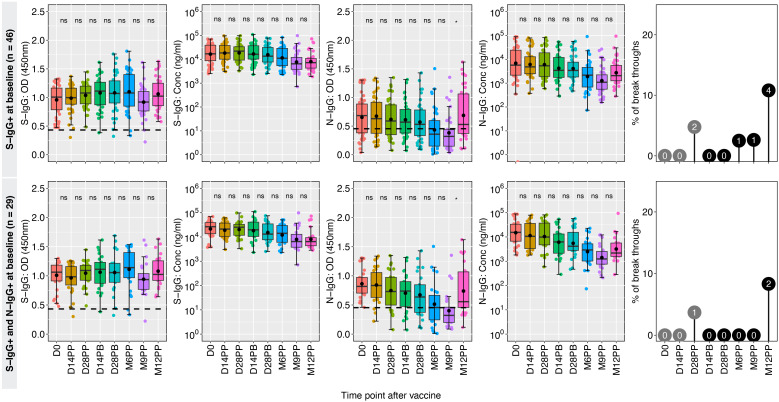
Results: Throughout the 12 months, we observed consistently high and stable seropositivity rates for spike-IgG antibodies, spike-IgM antibodies showed a decline in frequencies over time, and spike-IgA levels remained moderate and stable. Vaccinated individuals previously positive for spike-IgG antibodies demonstrated strong and persistent seropositivity, while those initially negative experienced a gradual and delayed increase in seropositivity rates. The fold change analysis of S- and N- antibody responses demonstrated a consistently stable and comparable profile over time, indicating that vaccine-induced antibody responses remain constant and lack significant fluctuations beyond the initial boost. The study emphasized that individuals lacking previous IgG positivity showed reduced vaccine-induced spike-IgG antibodies and were more susceptible to breakthrough infections, highlighting their higher vulnerability. All cases of breakthrough infections were asymptomatic, indicating the conferred protection to the vaccinated individuals.
Discussion: The findings corroborated earlier studies on the effectiveness of the CoronaVac vaccine and emphasized the significance of accounting for pre-existing seropositivity in vaccine assessments. This study effectively demonstrated durable antibody responses against SARS-CoV-2 in the African population following the CoronaVac vaccination, providing crucial insights for informing vaccination strategies and safeguarding vulnerable populations. Continuous surveillance is imperative for tracking breakthrough infections and monitoring waning immunity. The insights gained offer crucial direction for public health strategies and enhance comprehension of vaccine effectiveness in sub-Saharan Africa. Further research should explore functional outcomes, cellular immune responses, and the vaccine's effectiveness against different variants to enhance our understanding and optimize vaccine strategies.
Keywords: COVID-19; CoronaVac; antibody concentrations; antibody persistence; breakthrough infections; seropositivity; spike protein; sub-Saharan Africa.
Copyright © 2023 Sembera, Baine, Ankunda, Katende, Oluka, Akoli, Kato, Odoch, Ejou, Opio, Musenero, The COVID-19 Immunoprofiling Team, Kaleebu and Serwanga.
Conflict of interest statement
The authors declare that the research was conducted in the absence of any commercial or financial relationships that could be construed as a potential conflict of interest.
Figures
Similar articles
-
The single-dose Janssen Ad26.COV2.S COVID-19 vaccine elicited robust and persistent anti-spike IgG antibody responses in a 12-month Ugandan cohort.Front Immunol. 2024 May 8;15:1384668. doi: 10.3389/fimmu.2024.1384668. eCollection 2024. Front Immunol. 2024. PMID: 38779677 Free PMC article.
-
Sustained S-IgG and S-IgA antibodies to Moderna's mRNA-1273 vaccine in a Sub-Saharan African cohort suggests need for booster timing reconsiderations.Front Immunol. 2024 Jan 31;15:1348905. doi: 10.3389/fimmu.2024.1348905. eCollection 2024. Front Immunol. 2024. PMID: 38357547 Free PMC article.
-
Seroprevalence and durability of antibody responses to AstraZeneca vaccination in Ugandans with prior mild or asymptomatic COVID-19: implications for vaccine policy.Front Immunol. 2023 May 2;14:1183983. doi: 10.3389/fimmu.2023.1183983. eCollection 2023. Front Immunol. 2023. PMID: 37205095 Free PMC article.
-
COVID-19 lateral flow IgG seropositivity and serum neutralising antibody responses after primary and booster vaccinations in Chile: a cross-sectional study.Lancet Microbe. 2023 Mar;4(3):e149-e158. doi: 10.1016/S2666-5247(22)00290-7. Epub 2023 Jan 27. Lancet Microbe. 2023. PMID: 36716754 Free PMC article.
-
Eleven-month longitudinal study of antibodies in SARS-CoV-2 exposed and naïve primary health care workers upon COVID-19 vaccination.Immunology. 2022 Dec;167(4):528-543. doi: 10.1111/imm.13551. Epub 2022 Sep 6. Immunology. 2022. PMID: 36065677
Cited by
-
The subdued post-boost spike-directed secondary IgG antibody response in Ugandan recipients of the Pfizer-BioNTech BNT162b2 vaccine has implications for local vaccination policies.Front Immunol. 2024 Feb 16;15:1325387. doi: 10.3389/fimmu.2024.1325387. eCollection 2024. Front Immunol. 2024. PMID: 38469296 Free PMC article.
-
The single-dose Janssen Ad26.COV2.S COVID-19 vaccine elicited robust and persistent anti-spike IgG antibody responses in a 12-month Ugandan cohort.Front Immunol. 2024 May 8;15:1384668. doi: 10.3389/fimmu.2024.1384668. eCollection 2024. Front Immunol. 2024. PMID: 38779677 Free PMC article.
-
Anti-SARS-CoV-2 antibody dynamics after primary vaccination with two-dose inactivated whole-virus vaccine, heterologous mRNA-1273 vaccine booster, and Omicron breakthrough infection in Indonesian health care workers.BMC Infect Dis. 2024 Aug 1;24(1):768. doi: 10.1186/s12879-024-09644-y. BMC Infect Dis. 2024. PMID: 39090537 Free PMC article.
References
-
- Fiolet T, Kherabi Y, MacDonald CJ, Ghosn J, Peiffer-Smadja N. Comparing COVID-19 vaccines for their characteristics, efficacy and effectiveness against SARS-CoV-2 and variants of concern: a narrative review. Clin Microbiol Infect (2022) 28(2):202–21. doi: 10.1016/j.cmi.2021.10.005 - DOI - PMC - PubMed
-
- Costa Clemens SA, Weckx L, Clemens R, Almeida Mendes AV, Ramos Souza A, Silveira MBV, et al. . Heterologous versus homologous COVID-19 booster vaccination in previous recipients of two doses of CoronaVac COVID-19 vaccine in Brazil (RHH-001): a phase 4, non-inferiority, single blind, randomised study. Lancet (2022) 399(10324):521–9. doi: 10.1016/S0140-6736(22)00094-0 - DOI - PMC - PubMed
Publication types
MeSH terms
Substances
Grants and funding
LinkOut - more resources
Full Text Sources
Medical
Miscellaneous