

Factors influencing cranial variation between prehistoric Japanese forager populations
- PMID: 38098511
- PMCID: PMC10716076
- DOI: 10.1007/s12520-023-01901-6
Factors influencing cranial variation between prehistoric Japanese forager populations
Abstract
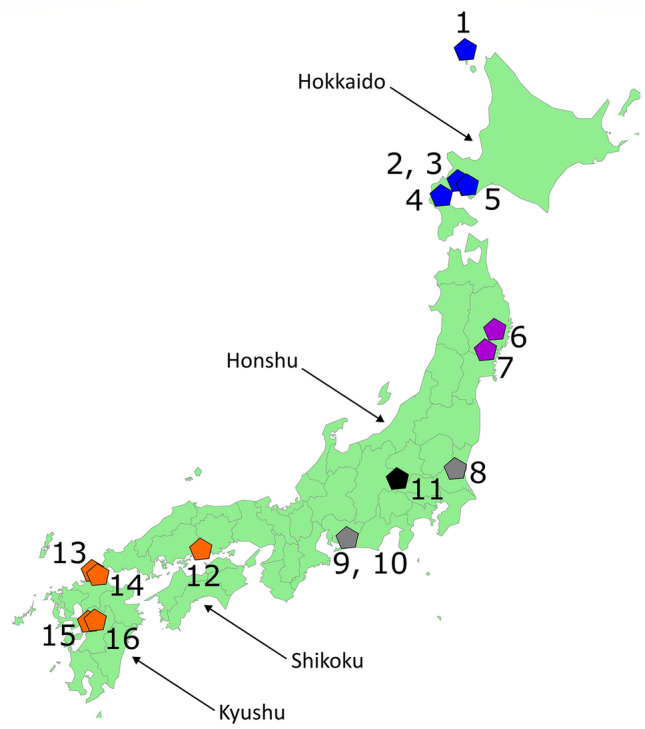
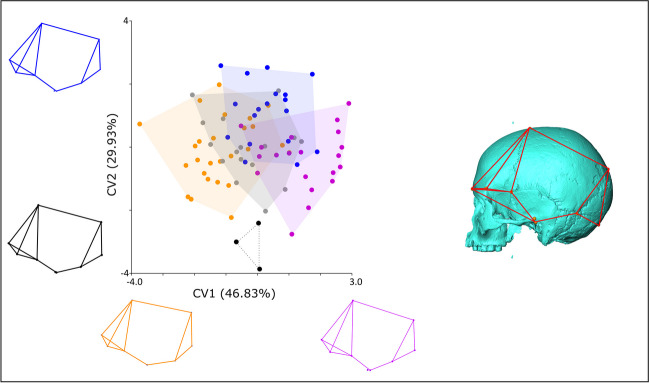
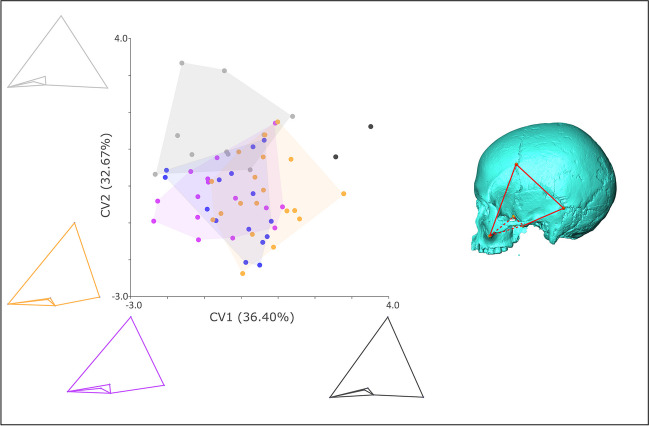
Understanding the factors shaping human crania has long been a goal of biological anthropology, and climate, diet, and population history are three of the most well-established influences. The effects of these factors are, however, rarely compared within a single, variable population, limiting interpretations of their relative contribution to craniofacial form. Jomon prehistoric foragers inhabited Japan throughout its climatic and ecological range and developed correspondingly varied modes of subsistence. We have previously demonstrated that a large sample of Jomon crania showed no clear climatic pattern; here, we examine variation in Jomon crania in more detail to determine if dietary factors and/or population history influence human intrapopulation variation at this scale. Based on well-established archaeological differences, we divide the Jomon into dietary groups and use geometric morphometric methods to analyse relationships between cranial shape, diet, and population history. We find evidence for diet-related influences on the shape of the neurocranium, particularly in the temporalis region. These shape differences may be interpreted in the context of regional variation in the biomechanical requirements of different diets. More experimental biomechanical and nutritional evidence is needed, however, to move suggested links between dietary content and cranial shape from plausible to well-supported. In contrast with the global scale of human variation, where neutral processes are the strongest influence on cranial shape, we find no pattern of population history amongst individuals from these Jomon sites. The determinants of cranial morphology are complex and the effect of diet is likely mediated by factors including sex, social factors, and chronology. Our results underline the subtlety of the effects of dietary variation beyond the forager/farmer dichotomy on cranial morphology and contribute to our understanding of the complexity of selective pressures shaping human phenotypes on different geographic scales.
Supplementary information: The online version contains supplementary material available at 10.1007/s12520-023-01901-6.
Keywords: Diet; Foragers; Jomon; Morphological variation.
© The Author(s) 2023.
Conflict of interest statement
Competing interestsThe authors declare no competing interests.
Figures


References
-
- Adachi N, Sawada J, Yoneda M, Kobayashi K, Itoh S. Mitochondrial DNA analysis of the human skeleton of the initial Jomon phase excavated at the Yugura cave site, Nagano. Japan Anthropological Science. 2013;121:137–143. doi: 10.1537/ase.130313. - DOI
-
- Adachi N, Kanzawa-Kiriyama H, Nara T, Kakuda T, Nishida I, Shinoda K. Ancient genomes from the initial Jomon period: new insights into the genetic history of the Japanese archipelago. Anthropol Sci. 2021;129:13–22. doi: 10.1537/ase.2012132. - DOI
-
- Adams DC, Collyer ML, Kaliontzopoulou A (2020) Geomorph: Software for geometric morphometric analyses. R package version 3.2.1. Retrieved from https://cran.r-project.org/package=geomorph
-
- Aikens CM, Higuchi T. Prehistory of Japan. New York: Academic Press; 1982.
-
- Akazawa T. Jomon people subsistence and settlements: discriminatory analysis of the Later Jomon settlements. J Anthropol Soc Nippon. 1982;90(Supplement):55–76. doi: 10.1537/ase1911.90.Supplement_55. - DOI
LinkOut - more resources
Full Text Sources