. 2023 Nov 30:14:1126481.
doi: 10.3389/fpsyg.2023.1126481. eCollection 2023.

Auditory discomfort in visually sensitive individuals

Affiliations

Auditory discomfort in visually sensitive individuals

Sarah M Haigh et al. Front Psychol. .

Abstract

Introduction: Sensory discomfort occurs in clinical and non-clinical populations. While some of the parameters that evoke visual discomfort have been identified, the parameters of sounds that evoke auditory discomfort are largely unknown.

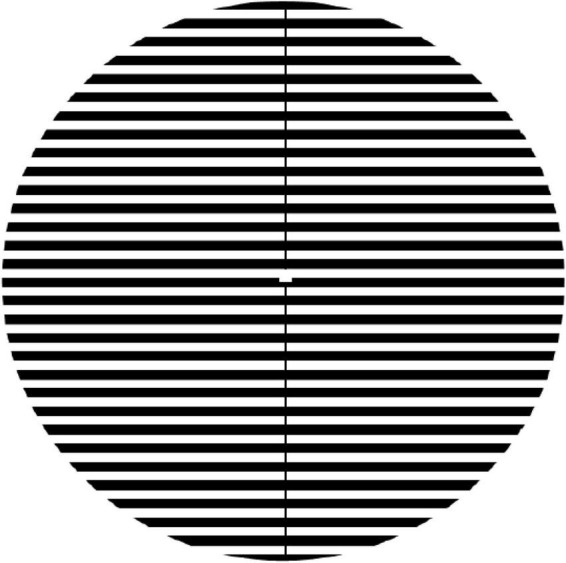
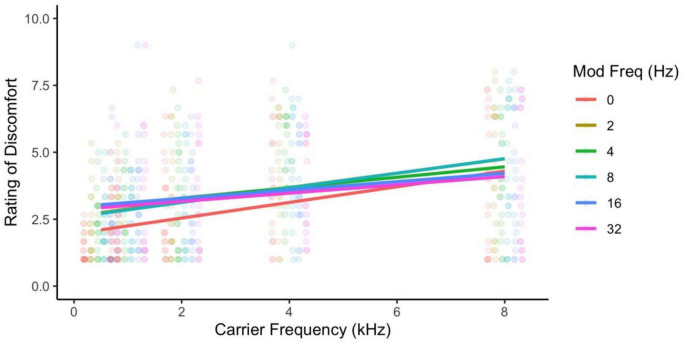
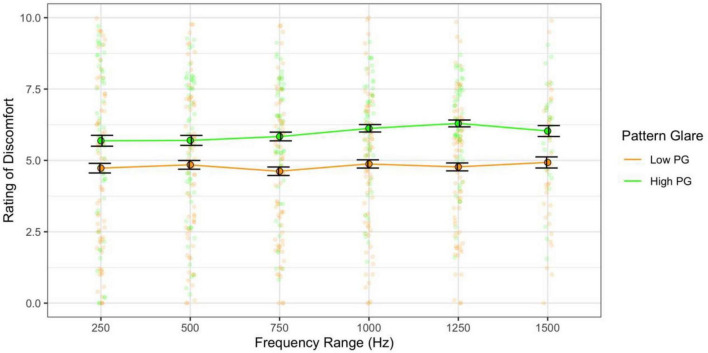
Methods: We presented various sounds and asked participants to rate the discomfort they experienced. In Experiments 1 and 2 tones were presented at frequencies between 0.25-8 kHz and modulated sinusoidally in amplitude at frequencies between 0-32 Hz. In Experiment 3 tones were swept in frequency from 500 Hz-2 kHz at sweep rates of 5-50 per second. In Experiment 4, sweeps varied in frequency range and central frequency.

Results: Discomfort increased with frequency. The effects of the amplitude modulation and sweep rate on discomfort were relatively small and were experienced mainly at low modulation frequencies and high sweep rates. Individuals who experienced visuo-perceptual distortions in the Pattern Glare (PG) Test reported greater auditory discomfort.

Discussion: This suggests that sensory sensitivity in one modality may occur in another.

Keywords: auditory; discomfort; frequency; pattern glare; sensitivity.


Conflict of interest statement

The authors declare that the research was conducted in the absence of any commercial or financial relationships that could be construed as a potential conflict of interest.

Figures

FIGURE 1
FIGURE 1
Ratings of discomfort increased with both carrier and modulation frequency, and the higher carrier frequencies showed the larger effects of higher modulation frequency reducing discomfort. Ratings are from the full sample of participants.
FIGURE 2
FIGURE 2
Rating of discomfort for each modulation frequency shown separately for each carrier frequency. Ratings are from the entire sample. Error bars show 3× standard error so that they are visible. Note that the discomfort is lowest for the 0.25 kHz carrier frequency and highest for the 8 kHz carrier, regardless of modulation frequency. The significant interaction was due to carrier frequencies 3, 4, 6, and 8 kHz showing a reduction in discomfort with increasing modulation frequency (highlighted by asterisk).
FIGURE 3
FIGURE 3
Rating of discomfort for each carrier frequency shown separately for each modulation frequency. Ratings are from the entire sample. Error bars show 3× standard error so that they are visible. Note that the effect of carrier frequency is consistent across all modulation frequencies. The interaction effect is less evident here.
FIGURE 4
FIGURE 4
Ratings of discomfort for migraine and headache-free groups for each carrier (top) and modulation frequency (bottom). Migraine reported nominally greater discomfort and this is consistent across carrier and modulation frequencies; however, was not significant. Error bars show 3× standard error so that they are visible.
FIGURE 5
FIGURE 5
The pattern used for the Pattern Glare Test. For Experiment 2, the pattern was presented at 100% contrast at 3.1cpd. For Experiments 3 and 4, the pattern was presented online (Qualtrics) and so we had no control over the spatial and luminance parameters.
FIGURE 6
FIGURE 6
Ratings of discomfort for carrier and modulation frequency. The interaction shows that modulation frequency increased discomfort for the lower carrier frequencies and decreased discomfort for the higher carrier frequencies.
FIGURE 7
FIGURE 7
Ratings of discomfort as a function of carrier frequency (top) and as a function of modulation frequency (bottom) shown separately for the low and the high pattern glare (PG) groups. Error bars show 1 standard error. The high PG group reported consistently greater discomfort for all carrier and modulation frequencies.
FIGURE 8
FIGURE 8
Ratings of discomfort as a function of sweep frequency for the migraine and headache-free groups (top) and the high and low pattern glare (PG) groups (bottom). Error bars 1 standard error. Higher sweep rates increased discomfort. Ratings of discomfort were nominally higher in migraine compared to headache-free individuals. However, ratings of discomfort were significantly higher in individuals with high PG compared to low PG regardless of sweep rate.
FIGURE 9
FIGURE 9
When the frequency range was fixed, higher central frequency still evoked greater discomfort. The high pattern glare (PG) group reported marginally greater discomfort than the low PG group. Error bars show 1 standard error.
FIGURE 10
FIGURE 10
Frequency range, when the central frequency was fixed, had no consistent effect on discomfort. The high PG group reported greater discomfort than the low PG group. Error bars show 1 standard error.
FIGURE 11
FIGURE 11
Discomfort increased as a function of central sweep frequency (varying frequency range). Those with high pattern glare (PG) reported greater discomfort overall compared to the low PG group. Error bars show 1 standard error.
FIGURE 12
FIGURE 12
Frequency range had a weak effect on discomfort: the 750 Hz range was nominally more comfortable than other ranges, and the high PG group reported slightly greater discomfort for the larger sweep ranges. Error bars show 1 standard error.

References

    1. Áfra J., Proietti Cecchini A., Sándor P. S., Schoenen J. (2000). Comparison of visual and auditory evoked cortical potentials in migraine patients between attacks. Clin. Neurophysiol. 111 1124–1129. 10.1016/S1388-2457(00)00271-6 - DOI - PubMed
    1. Allen P. M., Gilchrist J. M., Hollis J. (2008). Use of visual search in the assessment of Pattern-Related Visual Stress (PRVS) and its alleviation by colored filters. Invest. Ophthalmol. Vis. Sci. 49 4210–4218. 10.1167/iovs.07-1587 - DOI - PubMed
    1. Ambrosini A., Kisialiou A., Coppola G., Finos L., Magis D., Pierelli F., et al. (2016). Visual and auditory cortical evoked potentials in interictal episodic migraine: An audit on 624 patients from three centres. Cephalalgia 37 1126–1134. 10.1177/0333102416665224 - DOI - PubMed
    1. Andersson G., Lindvall N., Hursti T., Carlbring P., Andersson G. (2002). Hypersensitivity to sound (hyperacusis): A prevalence study conducted via the internet and post: Hipersensibilidad al sonido (hiperacusia): Un estudio de prevalencia realizado por internet y por correo. Int. J. Audiol. 41 545–554. 10.3109/14992020209056075 - DOI - PubMed
    1. Axelsson Ö, Nilsson M. E., Berglund B. (2010). A principal components model of soundscape perception. J. Acoust. Soc. Am. 128 2836–2846. 10.1121/1.3493436 - DOI - PubMed

LinkOut - more resources