. 2023 Dec 15;133(24):e163470.
doi: 10.1172/JCI163470.

Foxp3-mediated blockage of ryanodine receptor 2 underlies contact-based suppression by regulatory T cells

Affiliations

Foxp3-mediated blockage of ryanodine receptor 2 underlies contact-based suppression by regulatory T cells

Xiaobo Wang et al. J Clin Invest. .

Abstract

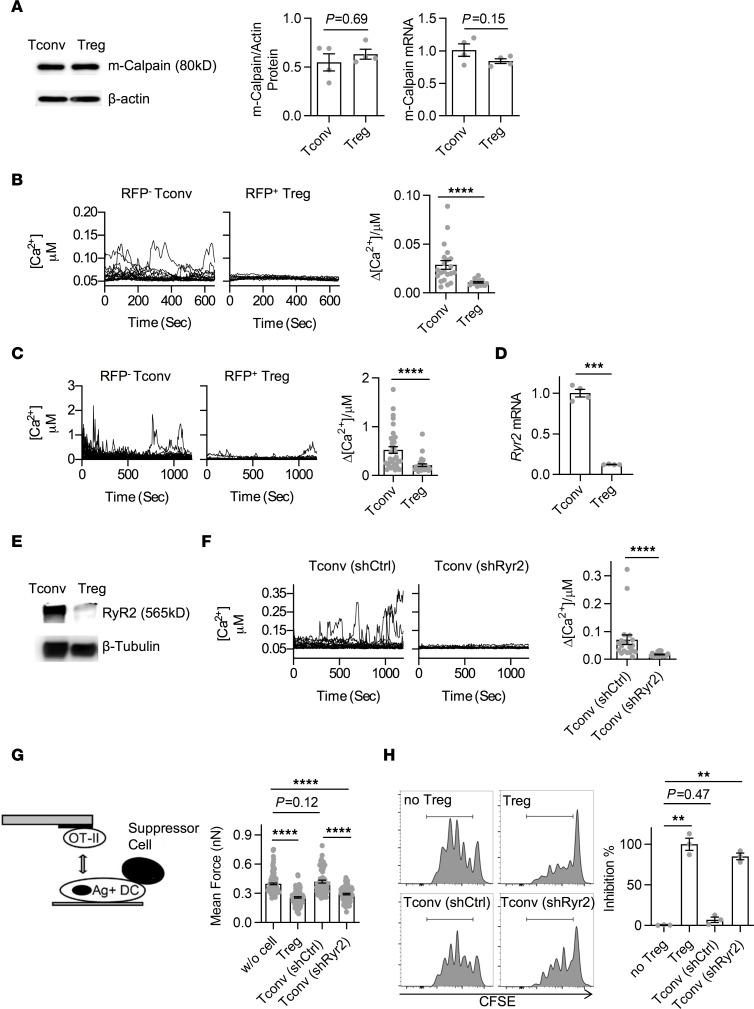
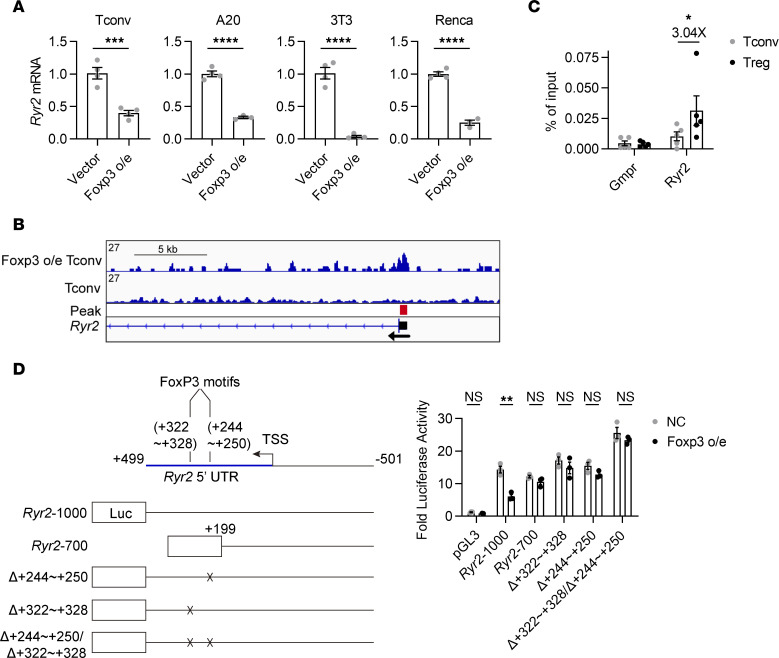
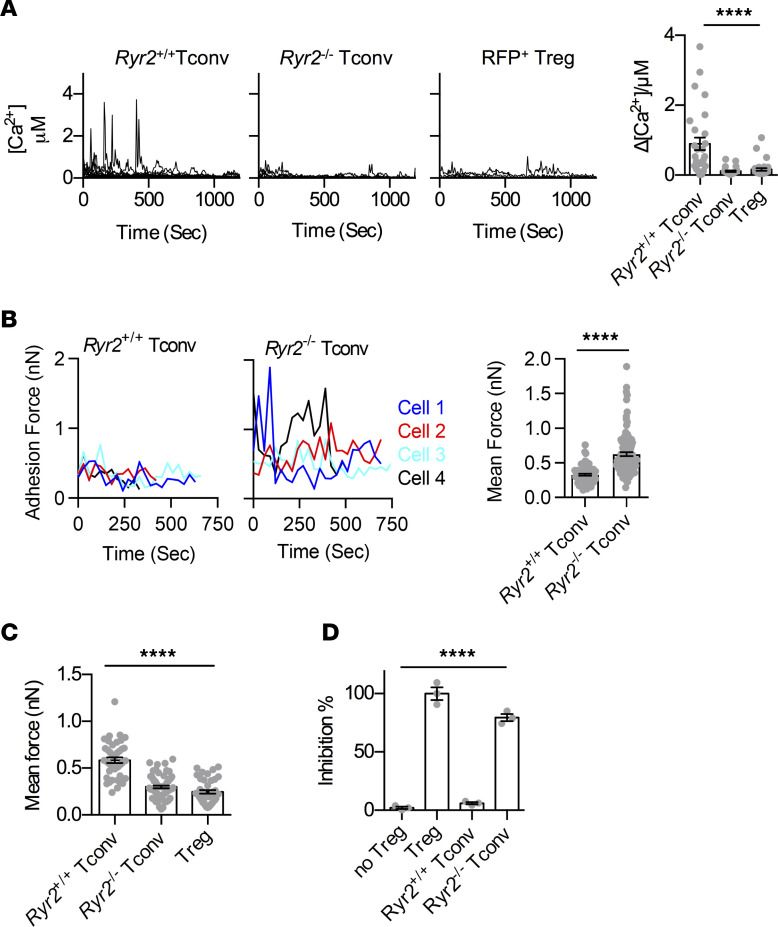
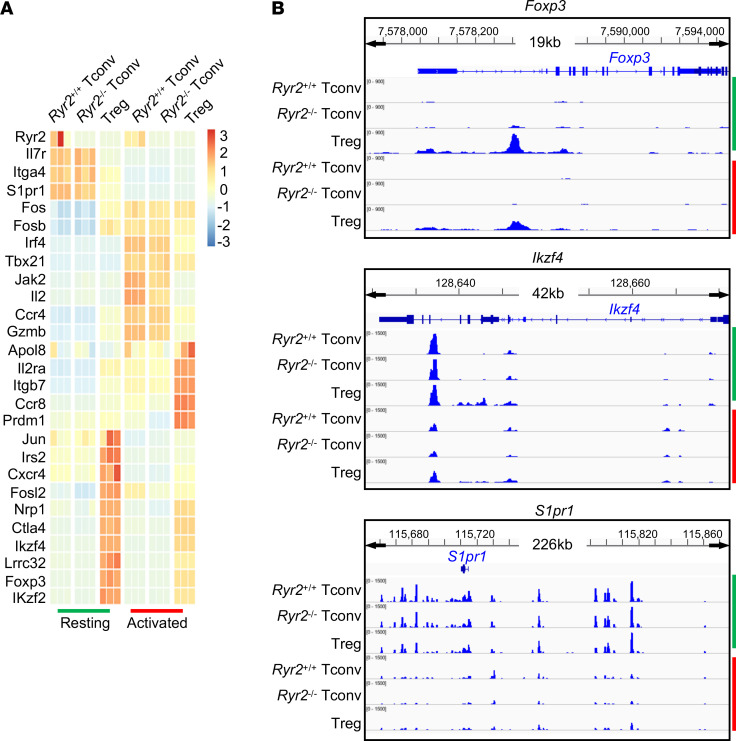
The suppression mechanism of Tregs remains an intensely investigated topic. As our focus has shifted toward a model centered on indirect inhibition of DCs, a universally applicable effector mechanism controlled by the transcription factor forkhead box P3 (Foxp3) expression has not been found. Here, we report that Foxp3 blocked the transcription of ER Ca2+-release channel ryanodine receptor 2 (RyR2). Reduced RyR2 shut down basal Ca2+ oscillation in Tregs, which reduced m-calpain activities that are needed for T cells to disengage from DCs, suggesting a persistent blockage of DC antigen presentation. RyR2 deficiency rendered the CD4+ T cell pool immune suppressive and caused it to behave in the same manner as Foxp3+ Tregs in viral infection, asthma, hypersensitivity, colitis, and tumor development. In the absence of Foxp3, Ryr2-deficient CD4+ T cells rescued the systemic autoimmunity associated with scurfy mice. Therefore, Foxp3-mediated Ca2+ signaling inhibition may be a central effector mechanism of Treg immune suppression.

Keywords: Antigen-presenting cells; Autoimmunity; Immunology; Tolerance.


Figures

Figure 1
Figure 1. Reduced RyR2 activity is the basis of contact-dependent suppression.
(A) Western blot protein (left) and qPCR RNA (right) analyses of m-calpain expression in Tconvs and Tregs isolated from Foxp3GFP mice. Number of independent experiments [N] = 4. (B) The change of intracellular free Ca2+ concentration [Ca2+] over time (left) and corresponding amplitude (right) are shown. Resting RFP Tconvs and RFP+ Tregs were sorted from CD4+ splenocytes of FOXP3-IRES-RFP mice by FACS following CD4 immunomagnetic negative selection (MACS) and loaded with Fluo-4 AM with 1.2 mM Ca2+ after overnight culture. Each line represents 1 cell. Number of biological repeats in 1 group of data points [n] = 20, N = 5. (C) As in B, with ratiometric Ca2+ imaging using Cal Red R525/650. n = 20, N = 3. (D) qPCR analysis of Ryr2 gene expression in FACS- or MACS-purified Tconvs and Tregs cultured overnight. N > 5. (E) Western blot analyses of RyR2 protein expression in overnight-cultured Tconvs and Tregs isolated from Foxp3GFP or FOXP3-IRES-RFP mice by FACS. N = 3. (F) As in B, with the exception that shRNA-knockdown Tconvs were used in place of Tregs. n = 20, N = 3. (G) Adhesion between OT-II T cells and OVA-pulsed DC2.4 cells that were free or engaged by Tregs, Ryr2 KD Tconvs, or control Tconvs on the opposite side of the DC cell bodies was analyzed. Shown are the triple-cell AFM assay setup and adhesion forces. N = 3. (H) DC occupation by Tregs, Ryr2 KD Tconvs, or control KD Tcon-mediated suppression of OT-II T cell division. Left: FACS plots, normalized to mode. Right: Relative efficiency of inhibition using Tregs and no Tregs as 100% and 0%, respectively. N = 3. Two-tailed unpaired Student’s t test. **P < 0.01; ***P < 0.001; ****P < 0.0001. Data are shown as the mean ± SEM where applicable.
Figure 2
Figure 2. Ryr2 is transcriptionally silenced by Foxp3.
(A) Ryr2 mRNA levels in Foxp3-overexpressed Tconvs as well as A20, 3T3, and Renca cells were detected by qPCR. n = 3–4 per group. N = 3. (B) Anti-flag-FOXP3 ChIP-seq data set reanalysis was performed in Tconvs with (top track) or without (bottom track) transduction of flag-FOXP3. Shown is the region around the transcription start site (TSS) of the Ryr2 gene. The red box denotes the position of significant difference identified by the program, which mostly overlaps the promoter region (dark box) of this gene. (C) ChIP-qPCR analysis was performed in Tconvs and Tregs cultured overnight in presence of recombinant IL-2 to examine FOXP3-enriched binding in the Ryr2 promotor region. Gmpr was used as negative control. N = 3. (D) Left: Schematic diagram of the Ryr2 promoter-luciferase reporter constructs, with deleted positions indicted by ×. Right: Analysis of different truncated or FOXP3-binding sequence consensus-deleted Ryr2 promoter-driven transcription responses in Foxp3-overexpressed 3T3 cells. n = 4 per group. N = 4. Two-tailed unpaired Student’s t test. *P < 0.05; **P < 0.01; ***P < 0.001; ****P < 0.0001.
Figure 3
Figure 3. RyR2 deficiency genetically makes Tconvs sticky and suppressive.
(A) Resting Ryr2+/+ Tconvs, Ryr2–/– Tconvs, and Tregs were loaded with Cal Red R525/650-AM, and Ca2+ concentration fluctuations were analyzed. Each line represents one 1 (left). Corresponding amplitude was shown on the right. n = 20 per group, N = 5. One-way ANOVA with nonparametric Kruskal-Wallis test. (B) SCFS force readings for Ryr2+/+ Tconvs and Ryr2–/– Tconvs adhering to DC2.4 and their mean forces. N = 3. Two-tailed unpaired Student’s t test. (C) Mean adhesion forces between OT-II T cells and OVA-pulsed DC2.4 cells that were free or engaged by Tregs, Ryr2+/+ Tconvs, or Ryr2–/– Tconvs on the opposite side of the DC cell bodies. N = 3. One-way ANOVA with nonparametric Kruskal-Wallis test. (D) Ryr2+/+ or Ryr2–/– Tconv-mediated suppression of OT-II T cell division was analyzed. The relative inhibition efficiencies of Tregs, Ryr2+/+ Tconvs, and Ryr2–/– Tconvs are shown. The inhibition efficiency of Tregs and no Tregs was 100% and 0%, respectively. N = 3. One-way ANOVA with nonparametric Kruskal-Wallis test. ****P < 0.0001.
Figure 4
Figure 4. RyR2 deficiency per se mediates contact-dependent suppression.
(A) Transcriptional differences among Ryr2+/+ Tconvs, Ryr2–/– Tconvs, and Tregs before (green) and after (red) anti-CD3/CD28 activation. Differential expressed genes were ranked by z score. Three repeats of each cell were analyzed. (B) Chromatin opening status of representative genes in the 3 cells before (green) and after activation (red).
Figure 5
Figure 5. RyR2 deficiency–mediated suppression operates in the absence of specific antigen.
(A) Contact disruption of responder OT-II cells and DCs by suppressor cells in intravital imaging. WT Tregs and Ryr2–/– Tconvs (CKOs) were analyzed as suppressor cells, and WT Tconvs were used as negative control. Both antigen nonspecific and OVA323–339-specific contacts were analyzed. 100 contacts were analyzed for each group. w/o, OT-II–DC contacts without suppressor cell occupancy; w, OT-II–DC contacts with suppressor cells on the specific DC. N = 3. (B) Calcium signal of OT-II T cells during contacts. OT-II cells preloaded with calcium indicator FuraRed were imaged and analyzed for each condition. 100 cells were analyzed for each group. N = 3. (C and D) Contact disruption of OT-II cells and antigen-loaded DCs by suppressor cells. WT Tregs (nonspecific) and OT-II Tregs (specific) were analyzed in C. Ryr2–/– Tconvs (nonspecific) and OT-II–Ryr2–/– Tconvs (specific) were analyzed in D. 100 contacts were analyzed for each group. 100 cells were analyzed for each group. N = 3. SuperPlots were generated as follows: each dot represents 1 contact or the calcium readout of an individual cell, and each triangle represent 1 batch of an experiment. One-way ANOVA with nonparametric Kruskal-Wallis test. *P < 0.05; **P < 0.01; ***P < 0.001.
Figure 6
Figure 6. RyR2-deficient Tconvs are indistinguishable from Tregs in disease models and scurfy rescue.
(A and B) HSV-1 footpad infection model. On day 7, HSV-1 titer in footpad tissues (A, N = 3) and delayed-type hypersensitivity (DTH) response caused by HSV-1 antigen rechallenge in footpad (B, pooled data, n = 16–21) were analyzed. Footpad thickness without rechallenge was set as 0%. One-way ANOVA with nonparametric Kruskal-Wallis test. (C) OVA-induced asthma model. Total infiltrates, infiltrated lymphocytes, and eosinophils in bronchoalveolar lavage fluid (BALF) were analyzed. N = 3. One-way ANOVA with nonparametric Kruskal-Wallis test. (D) DSS-induced colitis model. Colon length was measured on day 9. Pooled data, n = 11–18 mice/group. One-way ANOVA with nonparametric Kruskal-Wallis test. (E) MC38 tumor model. Tumor volume was measured. Pooled data, n = 10 mice per group. Time point–matched RM 2-way ANOVA. (F and G) Rescue of scurfy mice. (F) Analysis of weight change over time following i.p. transfer of Tregs, Foxp3 Tconvs, or CKO Tconvs into newborn scurfy mice. n = 10, WT littermate; n = 7, scurfy; n = 6, Treg; n = 6, Foxp3 Ryr2+/+ Tconv; n = 6, Ryr2–/– Tconvs. Full 20-week rescue and 4-week weight change of scurfy and Foxp3 Ryr2+/+ Tconv are shown. (G) Kaplan-Meier survival curves for the mice described in F. (H) Proposed working mechanism. In Tregs, Foxp3 expression autonomously suppresses the expression of RyR2, targeting a stretch of sequence roughly 200 bp before Ryr2 start codon, which results in severely depressed basal calcium oscillation in Tregs. The depressed basal Ca2+ level is insufficient to activate m-calpain to cleave LFA-1–anchoring proteins, such as talin, when Tregs contact DCs. This causes Tregs to adhere to DCs with exceedingly strong force, rendering the latter incapable of engaging other Tconvs. **P < 0.01; ***P < 0.001; ****P < 0.0001.

Comment in

References

    1. Romano M, et al. Past, present, and future of regulatory T cell therapy in transplantation and autoimmunity. Front Immunol. 2019;10(43):43. doi: 10.3389/fimmu.2019.00043. - DOI - PMC - PubMed
    1. Chen J, et al. Strong adhesion by regulatory T cells induces dendritic cell cytoskeletal polarization and contact-dependent lethargy. J Exp Med. 2017;214(2):327–338. doi: 10.1084/jem.20160620. - DOI - PMC - PubMed
    1. Matheu MP, et al. Imaging regulatory T cell dynamics and CTLA4-mediated suppression of T cell priming. Nat Commun. 2015;6:6219. doi: 10.1038/ncomms7219. - DOI - PMC - PubMed
    1. Onishi Y, et al. Foxp3+ natural regulatory T cells preferentially form aggregates on dendritic cells in vitro and actively inhibit their maturation. Proc Natl Acad Sci U S A. 2008;105(29):10113–10118. doi: 10.1073/pnas.0711106105. - DOI - PMC - PubMed
    1. Tadokoro CE, et al. Regulatory T cells inhibit stable contacts between CD4+ T cells and dendritic cells in vivo. J Exp Med. 2006;203(3):505–511. doi: 10.1084/jem.20050783. - DOI - PMC - PubMed

Publication types

MeSH terms

Substances