
Rational design of a SOCS1-edited tumor-infiltrating lymphocyte therapy using CRISPR/Cas9 screens

Michael R Schlabach et al. J Clin Invest. .

Abstract

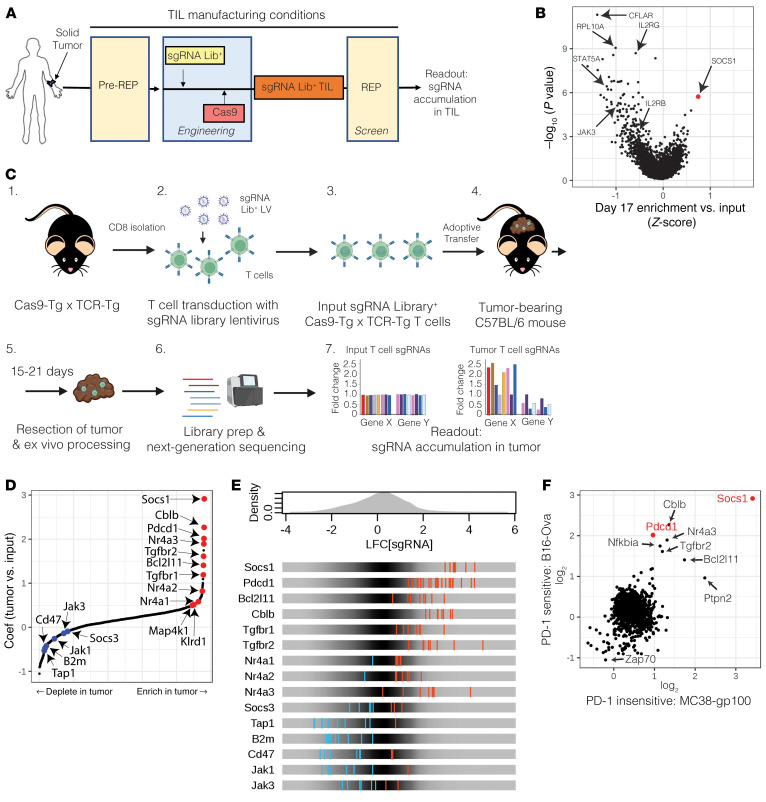
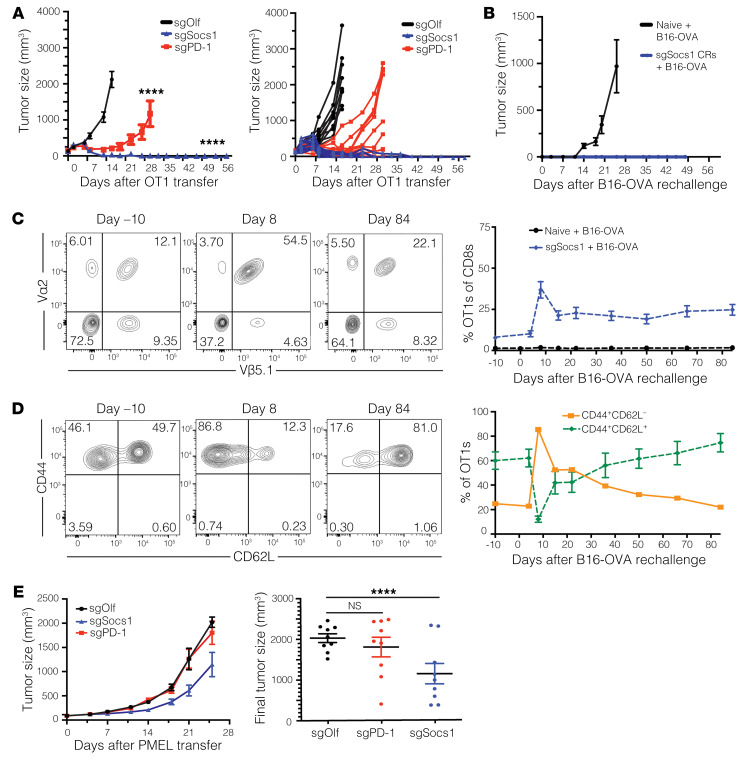
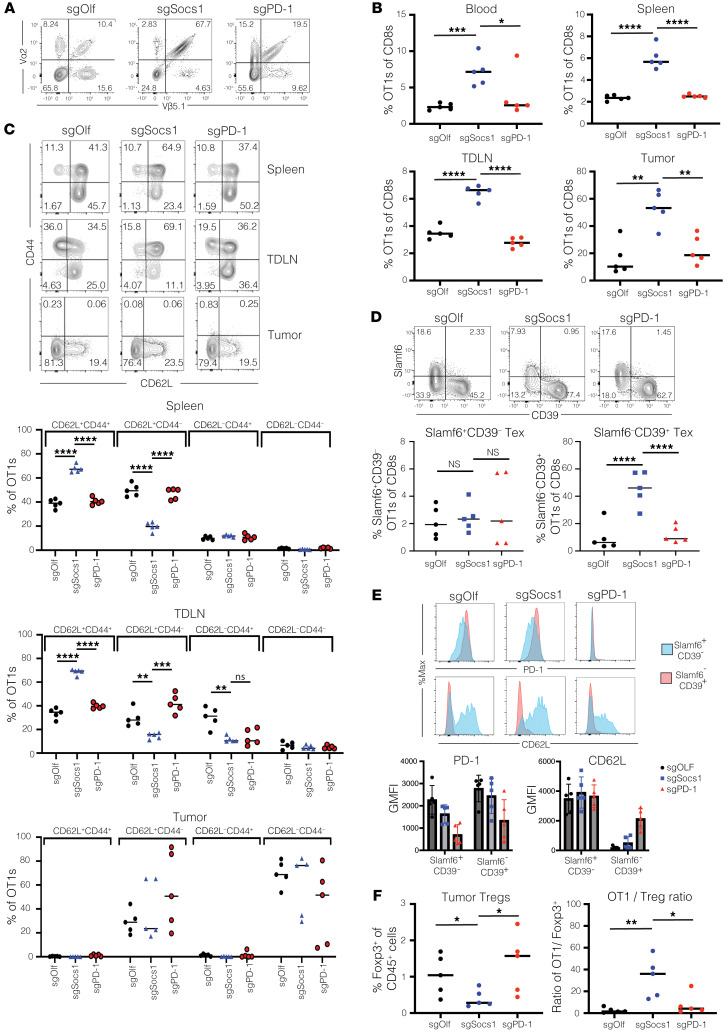
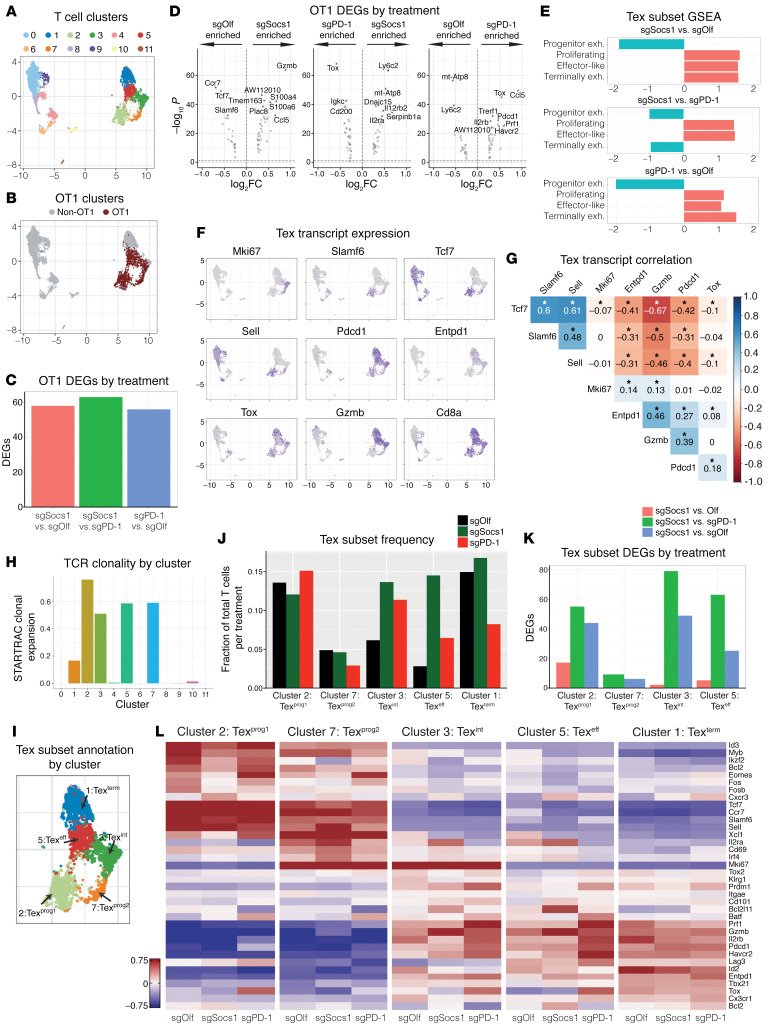
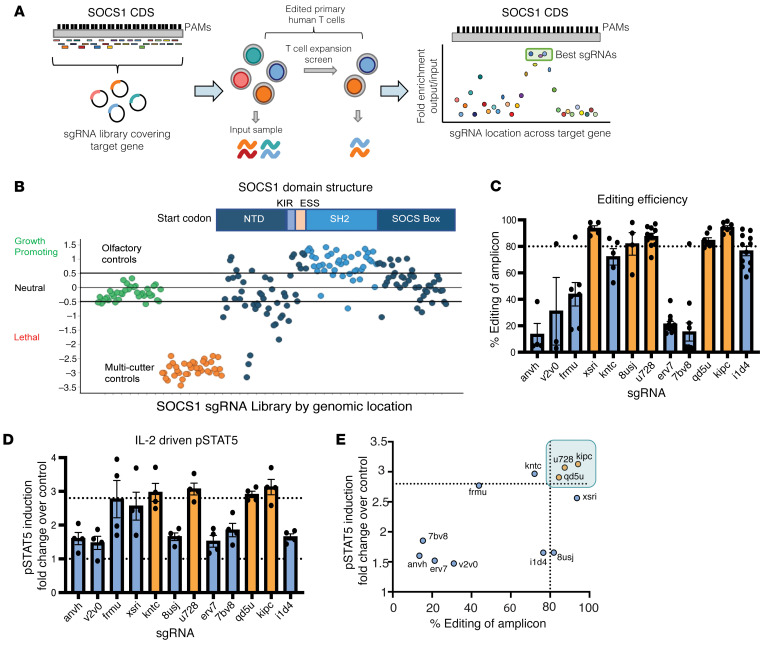
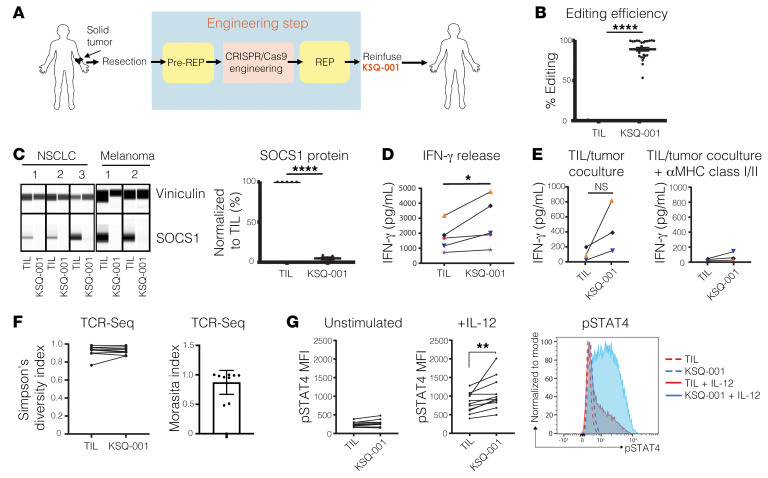
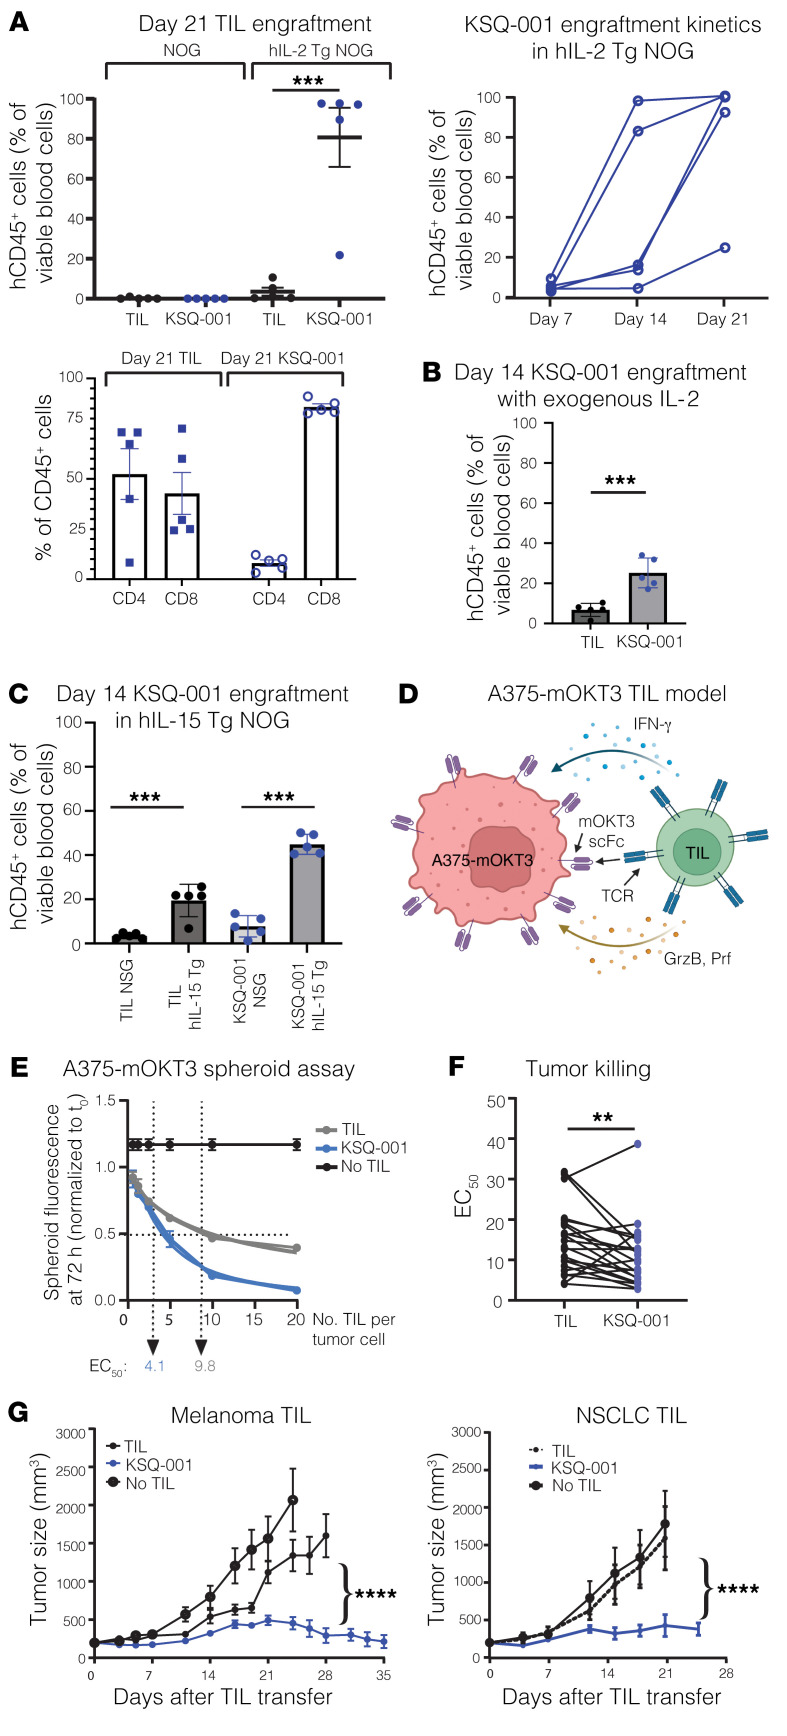
Cell therapies such as tumor-infiltrating lymphocyte (TIL) therapy have shown promise in the treatment of patients with refractory solid tumors, with improvement in response rates and durability of responses nevertheless sought. To identify targets capable of enhancing the antitumor activity of T cell therapies, large-scale in vitro and in vivo clustered regularly interspaced short palindromic repeats (CRISPR)/Cas9 screens were performed, with the SOCS1 gene identified as a top T cell-enhancing target. In murine CD8+ T cell-therapy models, SOCS1 served as a critical checkpoint in restraining the accumulation of central memory T cells in lymphoid organs as well as intermediate (Texint) and effector (Texeff) exhausted T cell subsets derived from progenitor exhausted T cells (Texprog) in tumors. A comprehensive CRISPR tiling screen of the SOCS1-coding region identified sgRNAs targeting the SH2 domain of SOCS1 as the most potent, with an sgRNA with minimal off-target cut sites used to manufacture KSQ-001, an engineered TIL therapy with SOCS1 inactivated by CRISPR/Cas9. KSQ-001 possessed increased responsiveness to cytokine signals and enhanced in vivo antitumor function in mouse models. These data demonstrate the use of CRISPR/Cas9 screens in the rational design of T cell therapies.

Keywords: Cancer immunotherapy; Gene therapy; Immunology; T cells; Therapeutics.


Figures

Figure 1
Figure 1. Functional CRISPR/Cas9 screens identify SOCS1 as a top target constraining in vitro expansion of TILs and in vivo infiltration of transferred CD8+ T cells in syngeneic solid-tumor models.
(A) Experimental schematic depicting a CRISPR screen performed on the in vitro expansion of human melanoma TILs under conditions used to manufacture for therapeutic use. Following pre-REP, a sgRNA library was introduced by lentiviral transduction with TILs, then engineered by introduction of Cas9 by electroporation. A REP was then initiated in the presence of allogeneic iPBMC feeders, OKT3, and IL-2. The distribution of sgRNAs was compared prior to and following the REP to identify targets enhancing TIL accumulation. (B) SOCS1 is the top target enhancing the accumulation of TIL under REP conditions. (C) Experimental schematic depicting the workflow of in vivo CRISPR screens using Cas9-Tg × TCR-Tg (OT1 or pmel) CD8+ T cells. CD8+ T cells were activated and transduced to express a sgRNA library, with Cas9-Tg × TCR-Tg T cells transferred into mice bearing 100 mm3 tumors on the flank. Either 14 or 21 days following transfer, tumors were harvested and the sgRNA distribution of T cells within tumors analyzed and compared with the input population of T cells. (D) MAGeCK-MLE identifies SOCS1 as a top target enhancing OT1 T cell infiltration into B16-OVA tumors 14 days following transfer. (E) Enrichment or depletion patterns of sgRNAs targeting known genes by tumor OT1s in comparison with input OT1s. (F) MAGeCK-MLE identifies SOCS1 as a top target enhancing the infiltration of pmel CD8+ T cells 14 days after transfer into the MC38-gp100 solid-tumor model found to be refractory to inhibition of PD-1.
Figure 2
Figure 2. Inactivation of SOCS1 by CRISPR/Cas9 in transferred CD8+ T cells drives enhanced efficacy in syngeneic mouse models with durable persistence as Tcm cells.
C57BL/6 mice bearing 100 mm3 B16-OVA tumors on the flank were treated with 3 × 10⁶ OT1 CD8+ T cells engineered to inactivate either OLF1 (sgOlf), PD-1 (sgPD-1), or SOCS1 (sgSocs1). Results of statistical analysis depicted between sgOlf versus sgPD-1 and sgOlf versus sgSocs1. (A) Tumor growth curves of each group over time are depicted. (B) Mice treated with sgSocs1 OT1s undergoing complete tumor rejection were rechallenged with B16-OVA tumor cells 61 days following initial transfer, with 10 naive mice included as controls. Tumor growth of the indicated treatment groups is depicted. (C) The frequency of sgSocs1 OT1s as peripheral blood CD8+ T cells prior to (day –10) and following (days 8 through 84) B16-OVA rechallenge. FACS plots are depicted, with OT1s defined as CD8+Va2+Vβ5.1+cells. (D) CD44+CD62L+ and CD44+CD62L phenotypes of sgSocs1 OT1s in C prior to (day –10) and following B16-OVA rechallenge (days 8 and 84) were quantified by FACS and depicted. (E) C57BL/6 mice bearing MC38-gp100 tumors with a median size of 100 mm3 were treated with 7 × 10⁶ pmel CD8+ T cells inactivated with either SOCS1 (sgSocs1), PD1 (sgPD-1), or OLF1 (sgOlf). Tumor growth curves depicted by treatment group on graph on the left, and final tumor size in individual mice depicted on graph on the right. Results of 2-way ANOVA were used to determine statistical significance between treatment groups in A and E. ****P < 0.0001. Data in AD are representative of 2 independent experiments.
Figure 3
Figure 3. Inactivation of SOCS1 in transferred CD8+ T cells enhances their accumulation as CD44+CD62L+ Tcm cells within lymphoid organs and Slamf6CD39+PD-1hi Tex cells in tumors while depleting intratumoral Tregs.
C57BL/6 mice bearing 100 mm3 B16-OVA tumor cells bearing a median size of 100 mm3 were treated with 3 × 10⁶ SOCS1 (sgSocs1), PD1 (sgPD-1), or OLF1 (sgOlf) engineered OT1s. (A) OT1 frequency in tumors 7 days following transfer was determined by quantifying the frequency of CD8+Va2+Vβ5.1+ cells within the CD8+ T cell compartment, with data from representative mouse shown. (B) Frequency of CD8+Va2+Vβ5.1+ cells in the blood, spleen, TDLNs, and tumor between treatment groups. (C) Frequency of OT1s between treatment groups expressing CD62L and/or CD44 are depicted from TDLNs, spleen, and tumor. (D) Expression patterns of Slamf6 and CD39 by OT1s from tumor depicted. (E) Expression of PD-1 or CD62L protein expressed by either Slamf6+CD39 or Slamf6CD39+ intratumoral OT1s from each treatment group is depicted from a representative mouse in the top panel, with compiled data from individual mice shown in the bottom panel. (F) Frequency of CD4+Foxp3+ cells within the TME was quantified in relation to total CD45+ cells (left panel) and as a ratio of OT1s to Tregs (right). Each symbol reflects an individual mouse. *P < 0.05; **P < 0.01; ***P < 0.001; ****P < 0.0001, unpaired, 2-tailed Student’s t test between the indicated comparator groups. For BD and F, P values were adjusted for multiple testing correction using the Benjamini-Hochberg method.
Figure 4
Figure 4. SOCS1 is a key checkpoint in the accumulation of Texint and Texeff cells from Texprog subsets within tumors with mechanisms distinct from PD-1.
C57BL/6 mice bearing 100 mm3 B16-OVA tumor cells with a median size of 100 mm3 were treated with 3 × 10⁶ SOCS1 (sgSocs1), PD1 (sgPD-1), or OLF1 (sgOlf) engineered OT1s, with editing efficiencies for target genes 82% for sgPD-1, 95% for sgSocs1, and 80% for sgOlf. scRNA-Seq was performed on CD45+ cells isolated from the TME from each treatment group. (A) UMAP visualization of T cell clusters. (B) Projection of OT1s onto T cell clusters based on TCR sequencing. (C) Bar plot of treatment DEGs between treatment-group OT1s, adjusted P < 0.1, abs(avg_log2FC ≥ 0.25). (D) Pseudobulk analysis on OT1s, with DEGs between treatment groups depicted. (E) GSEA by projecting pseudobulk DEGs from between indicated treatment groups in D onto Miller et al. Tex subset gene signatures (41). (F) UMAP visualization depicting the expression of indicated transcripts by T cell clusters (G) Correlogram between indicated transcripts (*P < 0.001). (H) STARTRAC TCR clonal expansion by T cell cluster. (I) Tex subset annotation by cluster. CD8, terminally differentiated Tex subsets. (J) Tex subset frequency by treatment group. Clusters 2, 7, 3 and 5 reflect OT1 frequencies, with cluster 1 containing non-OT1 cells and included for reference. (K) Number of DEGs within each Tex subset as indicated and between depicted treatment groups. (L) Heatmap of Tex subset–defining transcripts by subset and by treatment group.
Figure 5
Figure 5. A CRISPR tiling screen in primary human T cells identifies highly potent sgRNAs for therapeutic use targeting the SH2 domain of SOCS1.
(A) Experimental schematic of the CRISPR tiling screen for discovering potent SOCS1 sgRNAs. Following in silico removal of sgRNAs predicted to target multiple sites in the genome, a sgRNA library targeting every possible Cas9 cut site of the SOCS1 CDS based on the trinucleotide NGG PAM sequence together with controls was introduced by lentiviral transduction into activated primary human T cells with IL-2. Following introduction of Cas9, sgRNA Lib+ T cells were expanded in the presence of IL-2, with the distribution of sgRNAs following expansion evaluated and compared with input. (B) SOCS1 CRISPR tiling screen results. sgRNAs targeting the olfactory genes are in green, genome multicutters in orange, and sgRNAs targeting the SOCS1 CDS are blue. The SOCS1 protein domain structure is depicted above, with the SH2 and SOCS box domains labeled. NTD, N-terminal domain. sgRNAs targeting the SH2 domain of SOCS1 are depicted in light blue. (C) Editing efficiency of top sgRNAs identified in B was assessed by electroporation of Cas9/sgRNA RNPs into activated primary human T cells in an arrayed format, with editing efficiency of the cut site quantified by Amp-Seq. sgRNAs are labeled along the x axis, with dotted line depicting the threshold of SOCS1 sgRNAs achieving the targeted IL-2–mediated increase in pSTAT5. (D) Activated human primary T cells were edited with Cas9/sgRNA RNPs targeting either SOCS1 or olfactory genes in an arrayed format, with edited T cells stimulated with IL-2 and pSTAT5 signals quantified by FACS and depicted as fold change over sgOlf control. sgRNAs are labeled along the x axis, with dotted line depicting SOCS1 sgRNAs achieving the targeted IL-2–mediated increase in pSTAT5. (E) A comparison between editing efficiency (x axis) and pSTAT induction fold-change (y axis) of evaluated sgRNAs, with the u728, kipc, and qd5u sgRNAs identified as the most potent sgRNAs targeting SOCS1 based on editing efficiency and functional potency.
Figure 6
Figure 6. CRISPR/Cas9 inactivation of the SOCS1 gene in human TILs drives enhanced functionality and pSTAT4 sensitivity to IL-12.
(A) Schematic of the process for manufacturing KSQ-001, a CRISPR/Cas9-eTIL containing inactivation of SOCS1. Solid tumors are surgically resected from patients, with TIL extracted from fragmented tumor by culturing in the presence of IL-2 in a pre-REP. Following the pre-REP, u728/Cas9 protein RNPs are introduced into the TIL by electroporation, followed by expansion in a REP in the presence of irradiated PBMC feeders IL-2 and OKT3. KSQ-001 is then harvested and cryopreserved for transport to a patient for infusion (B) Sequencing of PCR amplicons from the u728 cut site is displayed from 15 independent donors and 26 independent data sets. (C) Capillary immunoassay (Wes) detection of SOCS1 protein in TIL and KSQ-001 samples from the indicated tumor type. SOCS1 protein was detected as a single band at approximately 33 kd. Vinculin (117 kd) was used as loading control. (D) IFN-γ release by donor-paired TILs and KSQ-001 following cryopreservation and thaw and activation with anti-CD3 tetramers. (E) TIL reactivity to autologous tumor digests was assessed by coculture, with IFN-γ production quantified in the absence (left) or presence (right) of anti–MHC class I and class II blocking antibodies. (F) Diversity and overlap of donor-paired TILs and KSQ-001 CDR3 TCR repertoire results as quantified by FR3AK-U-Seq are displayed as Simpson’s diversity index and Morisita index, respectively. (G) TILs or KSQ-001 was stimulated by IL-12 for 1 hour (middle) in comparison with an unstimulated control (left). pSTAT4 MFI gated on donor-paired CD3+ TILs and KSQ-001 is displayed. A representative pSTAT4 FACS plot from a single donor is depicted (right). For BG, each dot represents individual donor. Statistical analyses were performed using unpaired, 2-tailed Students’ t test. *P < 0.05; **P < 0.01; ****P < 0.0001.
Figure 7
Figure 7. Enhanced IL-2–dependent engraftment and antitumor activity by SOCS1-edited TIL following transfer into a solid-tumor model.
(A) TILs or KSQ-001 was adoptively transferred into NOG or hIL-2–Tg NOG mice, with engraftment evaluated over time by quantifying the frequency of human CD45+ cells present within the peripheral blood. Top row: left, frequency of human CD45+ cells by mouse strain and treatment group on day 21; right, frequency of KSQ-001 in hIL-2–Tg NOG mice over time. Bottom row: frequency of CD4+ and CD8+ T cells from TILs or KSQ-001 on day 21 in hIL-2–Tg mice. (B) TILs or KSQ-001 was adoptively transferred into NOG with 45,000 U of human IL-2 administered i.p. daily, with engraftment evaluated at day 14. (C) TILs or KSQ-001 was adoptively transferred into hIL-15–Tg NOG mice with 45,000 U of human IL-2 administered i.p. daily for 3 days, with engraftment evaluated at day 14 and NSG mice used as a comparator (D) Schematic of the mOKT3-A375/TIL model. A375 melanoma cells were engineered to express either high- or low-affinity membrane–associated OKT3 scFv binding domains that bind and agonize CD3 expressed by TILs. TILs generate an antitumor cytolytic response through production of IFN-γ and release of cytolytic granules. (E) TILs were cocultured with low-affinity A375-mOKT3 spheroids at various effector to target (E:T) ratios, with tumor killing assessed by Incucyte assay over time. EC50 kill curve at 72 hours from a representative donor is shown. (F) EC50 values from 17 donors and 22 independent paired TIL and KSQ-001 samples are shown, with each dot representing an individual paired donor. Statistical analysis was done using 2-tailed, paired t test. (G) hIL-2–Tg NOG mice bearing high-affinity A375-mOKT3 tumors approximately 100 mm3 in size were treated with donor-paired sgOlf-edited melanoma TILs or unengineered NSCLC TILs versus donor-paired KSQ-001, with tumor growth assessed over indicated time points. An unpaired, 2-tailed Student’s t test was used to evaluate statistical significance between sgOlf TIL or TIL versus KSQ-001 treatment groups in AC and G, and 2-way ANOVA was used in G. **P < 0.01; ***P < 0.001; ****P < 0.0001.

References

    1. Park JH, et al. Long-term follow-up of CD19 CAR therapy in acute lymphoblastic leukemia. N Engl J Med. 2018;378(5):449–459. doi: 10.1056/NEJMoa1709919. - DOI - PMC - PubMed
    1. Lee DW, et al. T cells expressing CD19 chimeric antigen receptors for acute lymphoblastic leukaemia in children and young adults: a phase 1 dose-escalation trial. Lancet. 2015;385(9967):517–528. doi: 10.1016/S0140-6736(14)61403-3. - DOI - PMC - PubMed
    1. June CH, Sadelain M. Chimeric antigen receptor therapy. N Engl J Med. 2018;379(1):64–73. doi: 10.1056/NEJMra1706169. - DOI - PMC - PubMed
    1. Grupp SA, et al. Chimeric antigen receptor-modified T cells for acute lymphoid leukemia. N Engl J Med. 2013;368(16):1509–1518. doi: 10.1056/NEJMoa1215134. - DOI - PMC - PubMed
    1. Mardiana S, et al. Supercharging adoptive T cell therapy to overcome solid tumor-induced immunosuppression. Sci Transl Med. 2019;11(495):eaaw2293. doi: 10.1126/scitranslmed.aaw2293. - DOI - PubMed

Publication types

Substances