. 2023 Dec 15;133(24):e168670.
doi: 10.1172/JCI168670.

ADORA2A-driven proline synthesis triggers epigenetic reprogramming in neuroendocrine prostate and lung cancers

Affiliations

ADORA2A-driven proline synthesis triggers epigenetic reprogramming in neuroendocrine prostate and lung cancers

Na Jing et al. J Clin Invest. .

Abstract

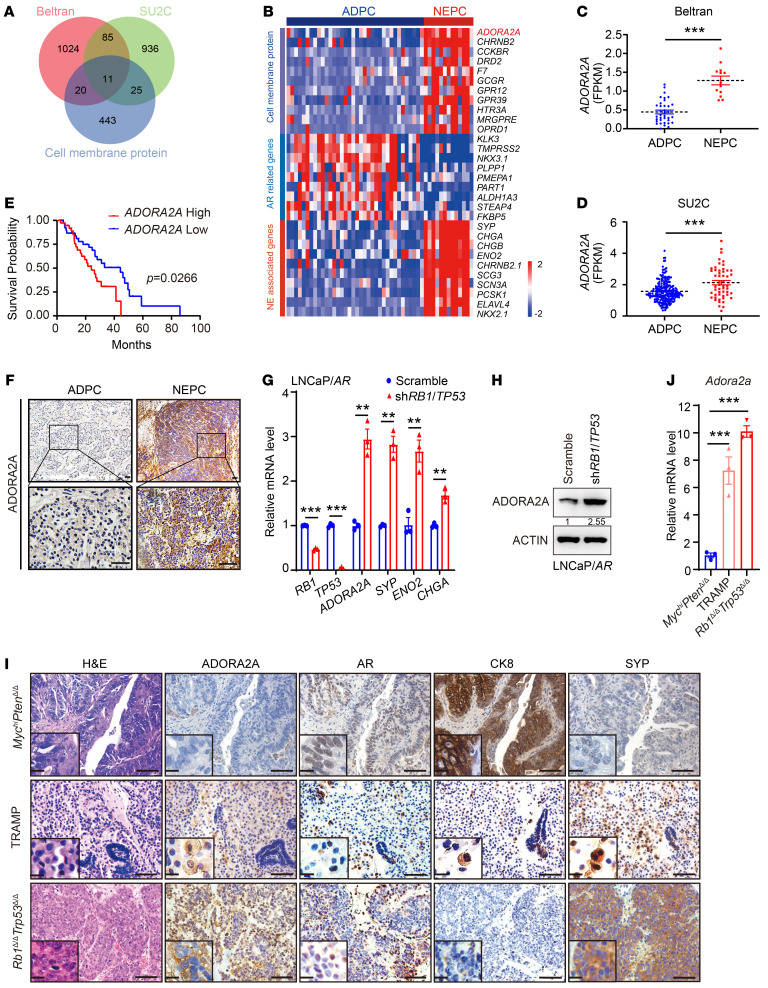
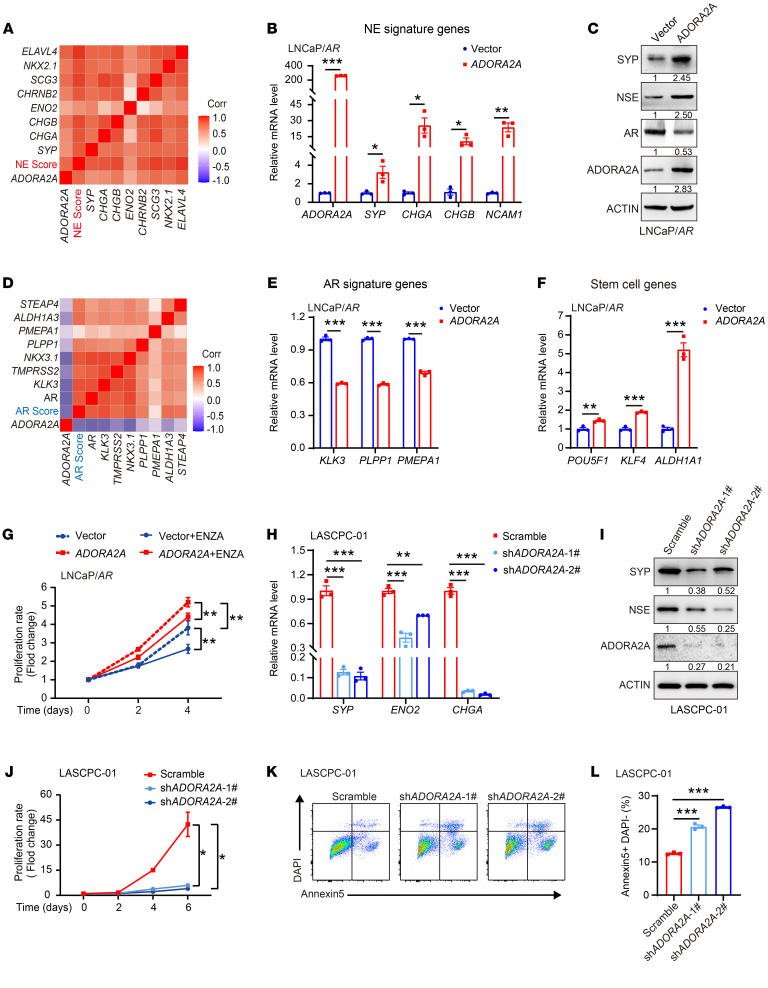
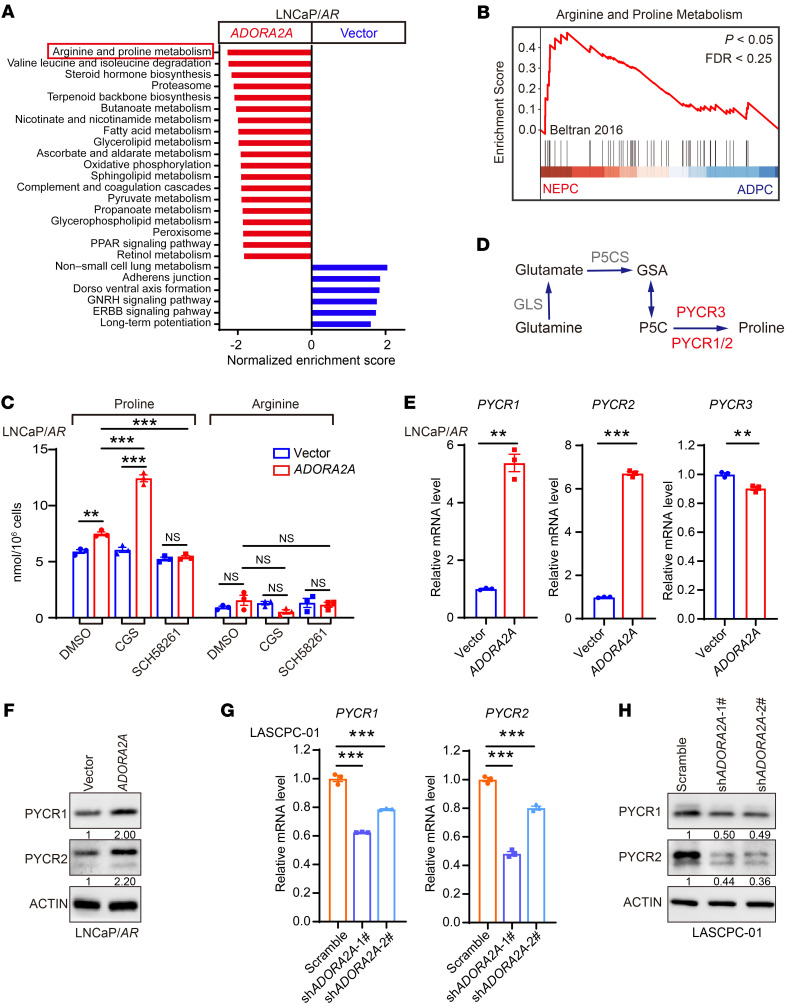
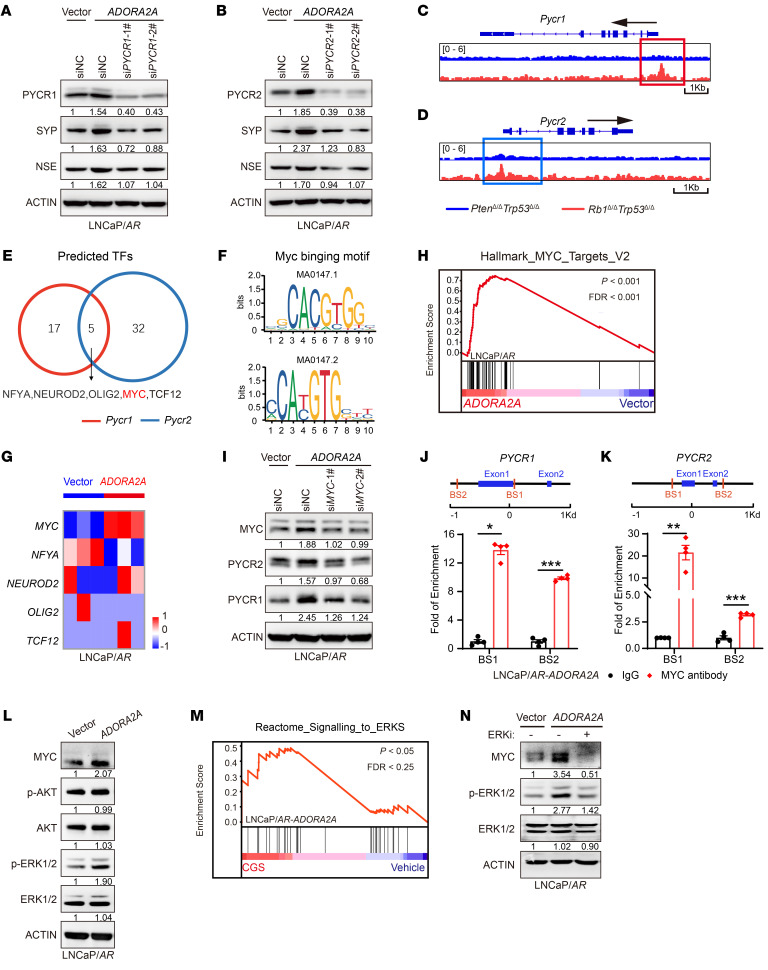
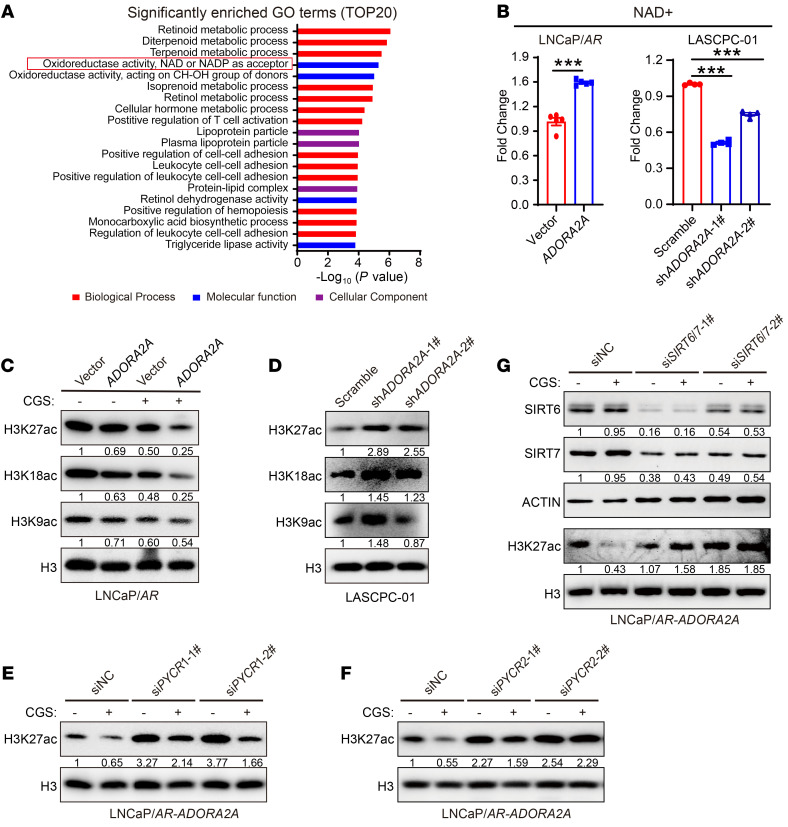
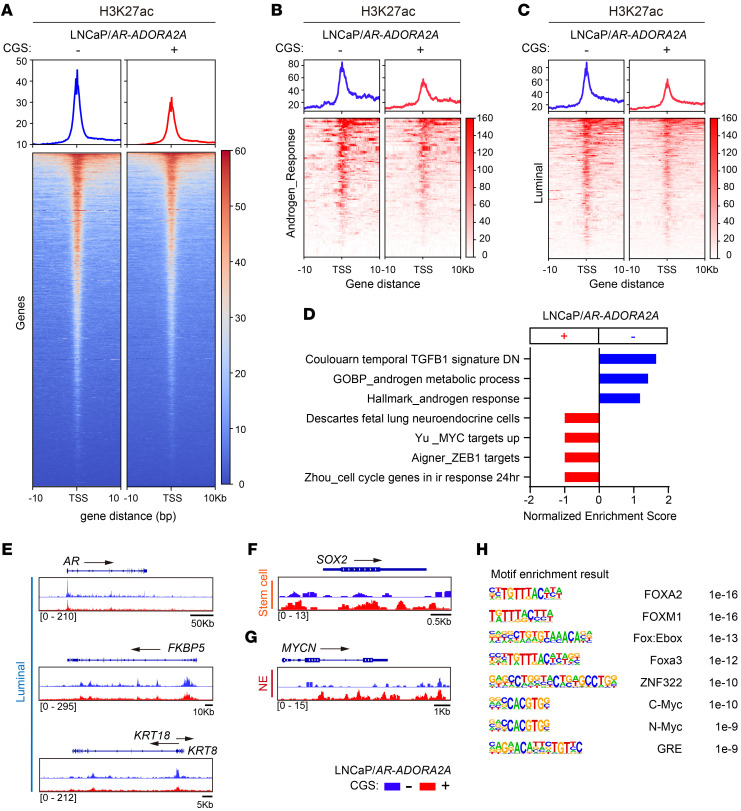
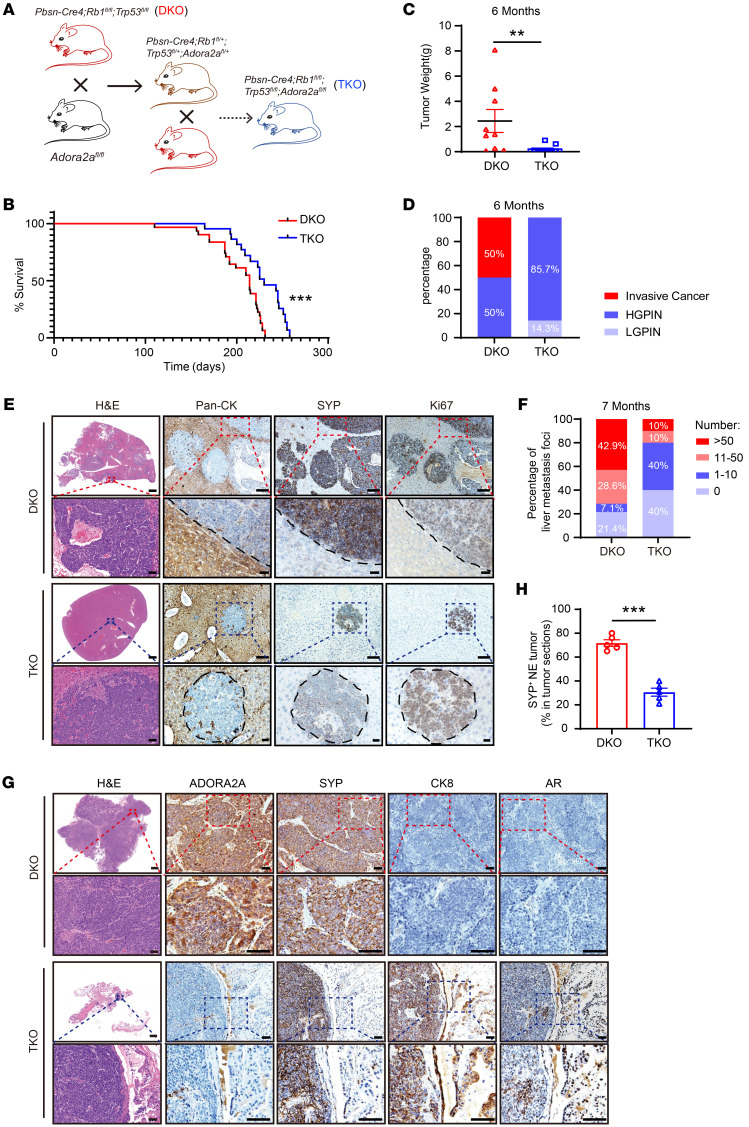
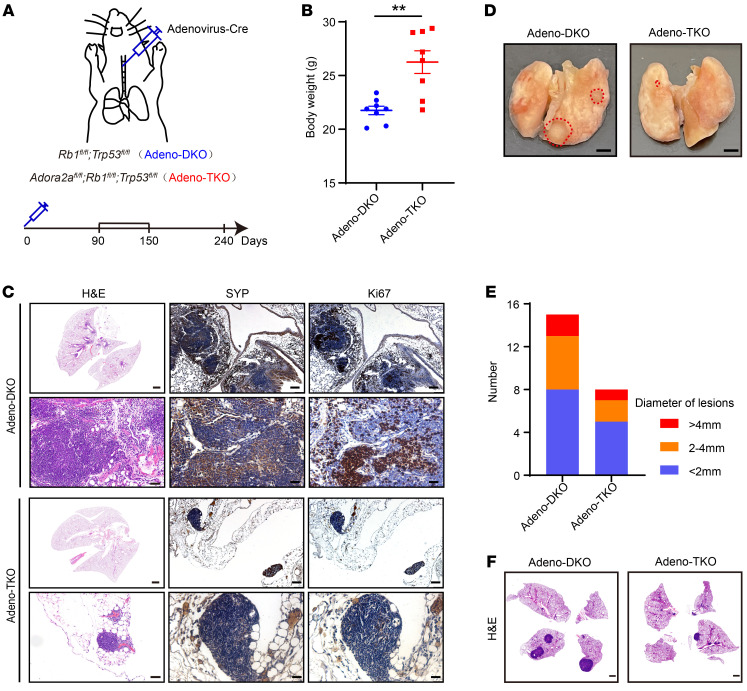
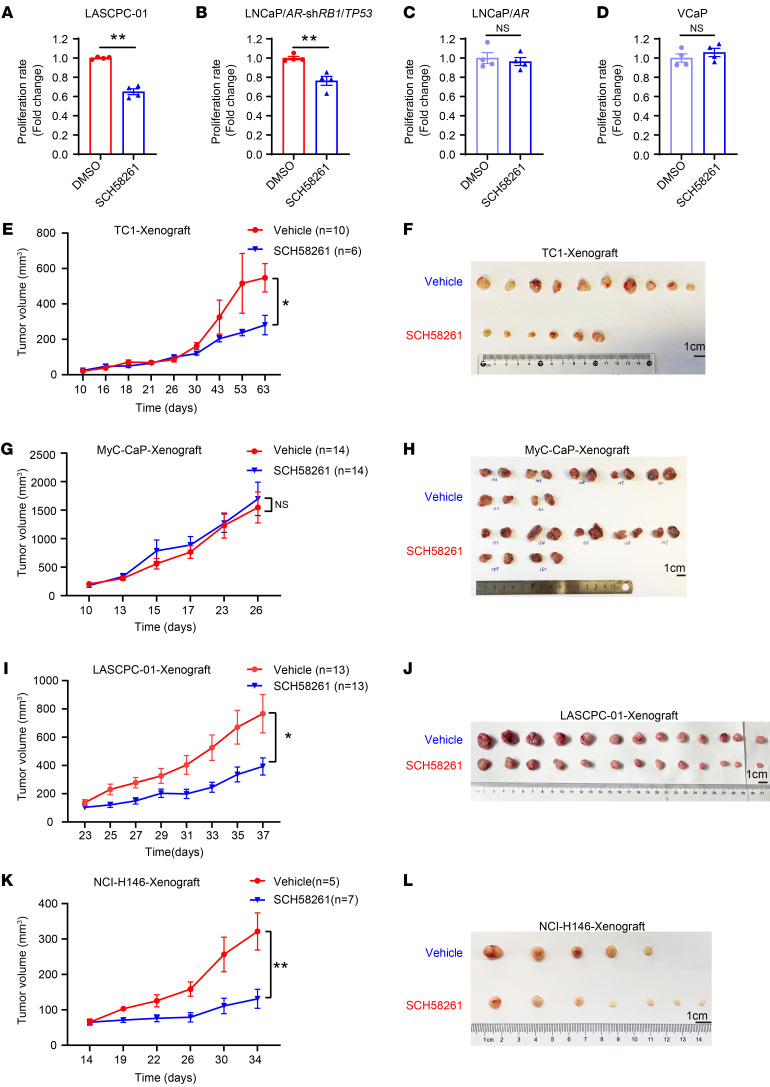
Cell lineage plasticity is one of the major causes for the failure of targeted therapies in various cancers. However, the driver and actionable drug targets in promoting cancer cell lineage plasticity are scarcely identified. Here, we found that a G protein-coupled receptor, ADORA2A, is specifically upregulated during neuroendocrine differentiation, a common form of lineage plasticity in prostate cancer and lung cancer following targeted therapies. Activation of the ADORA2A signaling rewires the proline metabolism via an ERK/MYC/PYCR cascade. Increased proline synthesis promotes deacetylases SIRT6/7-mediated deacetylation of histone H3 at lysine 27 (H3K27), and thereby biases a global transcriptional output toward a neuroendocrine lineage profile. Ablation of Adora2a in genetically engineered mouse models inhibits the development and progression of neuroendocrine prostate and lung cancers, and, intriguingly, prevents the adenocarcinoma-to-neuroendocrine phenotypic transition. Importantly, pharmacological blockade of ADORA2A profoundly represses neuroendocrine prostate and lung cancer growth in vivo. Therefore, we believe that ADORA2A can be used as a promising therapeutic target to govern the epigenetic reprogramming in neuroendocrine malignancies.

Keywords: Epigenetics; Lung cancer; Metabolism; Oncology; Prostate cancer.


Figures

Figure 1
Figure 1. ADORA2A is a selectively upregulated cell membrane protein in NEPC.
(A) Screening the upregulated cell membrane proteins in NEPC versus ADPC based on reanalysis of Beltran (24) (NEPC, n = 13; ADPC, n = 36) and SU2C (25) (NEPC, n = 52; ADPC, n = 214) PCa data sets. (B) The heatmap reveals that ADORA2A is a top-ranked cell membrane protein in NEPC versus ADPC based on Beltran PCa data set (24). (C and D) Quantification of ADORA2A mRNA levels in ADPC and NEPC using Beltran (24) (C) and SU2C (D) PCa data sets (25). (E) The Kaplan-Meier survival curves exhibit a significantly shorter survival of patients with a high ADORA2A expression based on SU2C (High, n = 38; Low, n = 41) PCa data sets (25), cutoff value was 50%. (F) Representative IHC showing the ADORA2A levels in ADPC (n = 35) and NEPC (n = 31) clinical tumor sections. Upper panel scale bar: 200 μm; Lower panel scale bar: 50 μm. (G) Representative RT-qPCR shows mRNA levels in LNCaP/AR-shRB1/TP53 and scramble cells (n = 3 independent experiments). (H) Representative immunoblotting demonstrates an elevated ADORA2A level in LNCaP/AR-shRB1/TP53 compared with scramble cells (n = 3 independent experiments). (I) H&E showing the histology of MychiPtenΔ/Δ, TRAMP, and Rb1Δ/ΔTrp53Δ/Δ prostate tumors from 6-to-8-month-old mice (the left panel). IHC staining demonstrates the expression of ADORA2A, AR, CK8, and SYP in these tumors (scale bar: 100 μm; zoom in area scale bar: 5 μm). (J) RT-qPCR showing Adora2a levels from organoids from indicated GEMMs (n = 3 biological replicates). For statistical analysis, student’s t tests were used for C and G; Mann-Whitney test was utilized for D; Log-rank test was employed in E; 1-way ANOVA with Dunnett’s posthoc test was applied in J. *P < 0.05, **P < 0.01, ***P < 0.001, data are presented as mean ± SEM.
Figure 2
Figure 2. ADORA2A promotes lineage plasticity and resistance to ADT in PCa cells.
(A) Correlation analysis demonstrates a strong positive association between ADORA2A mRNA levels and NE-lineage gene signatures based on the Beltran PCa data set (24). (B) RT-qPCR results confirm ADORA2A-OE in LNCaP/AR-ADORA2A cells and suggest that NE-lineage associated genes are elevated in ADORA2A-OE LNCaP/AR cells compared with vector cells (n = 3). (C) Immunoblots of NE-lineage molecules and AR in ADORA2A-OE LNCaP/AR cells and vector control cells. (D) ADORA2A mRNA levels are negatively correlated with expression of AR signaling signature genes based on the analysis of the Beltran PCa data set (24). (E and F) RT-qPCR analysis of AR signature genes and stem cell marker genes in LNCaP/AR-vector and LNCaP/AR-ADORA2A cells (n = 3). (G) In vitro cell growth curves of LNCaP/AR-ADORA2A and LNCaP/AR-vector cells cultured in control medium or enzalutamide (ENZA, 15 μM)-containing medium (n = 5 biological replicates). (H and I) RT-qPCR (H) and immunoblotting (I) results demonstrate NE-lineage genes are decreased in response to the downregulation of ADORA2A in LASCPC-01 cells (n = 3). (J) Cell growth curves of LASCPC-01-scramble cells and LASCPC-01-shADORA2A cells within 6 days (n = 4 biological replicates). (K and L) Flow cytometry analysis (K) and quantification (L) of the apoptotic cells in LASCPC-01-scramble and LASCPC-01-shADORA2A cells (n = 3 biological replicates). For statistical analysis, student’s t test was used for B, E, and F; 1-way ANOVA with Dunnett’s posthoc test was utilized for H and L; 2-way ANOVA with Turkey’s posthoc test was applied in G and J. *P < 0.05, **P < 0.01, ***P < 0.001, data are presented as mean ± SEM. RT-qPCR and immunoblotting were repeated in at least 3 independent experiments, with similar results, and representative images are shown.
Figure 3
Figure 3. ADORA2A signaling promotes the proline synthesis by upregulating PYCRs.
(A) GSEA analysis reveals upregulated biological processes and pathways in KEGG enrichment analysis in LNCaP/AR-ADORA2A versus LNCaP/AR-vector cells (n = 3 biological replicates per cell line). (B) The GSEA plot shows that arginine and proline metabolism-related genes are enriched in NEPC compared with ADPC based on analysis of the Beltran PCa data set (24). (C) Mass spectrometry assesses the intracellular amount of proline and arginine in LNCaP/AR-vector and LNCaP/AR-ADORA2A cells in the absence or in the presence of ADORA2A agonist CGS (100 nM, treated for 48 hours) or antagonist SCH58261 (25 μM, treated for 48 hours) (n = 3 biological replicates/group). (D) The schematic flowchart displays the proline synthesis and key enzymes. (E and F) RT-qPCR (E) and immunoblotting (F) assays reveal the expression levels of PYCR1, PYCR2, and PYCR3 in response to ectopic expression of ADORA2A in LNCaP/AR cells (n = 3). (G) RT-qPCR data demonstrate decreases of PYCR1 and PYCR2 transcription upon the downregulation of ADORA2A via shRNA in LASCPC-01 cells (n = 3). (H) Immunoblotting results display reduced PYCR1 and PYCR2 at the protein level in response to ADORA2A knockdown in LASCPC-01 cells. For statistical analysis, 1-way ANOVA with Turkey’s posthoc test and Kruskal-Wallis test with Dunnett’s posthoc test was utilized for C; student’s t test was used for E; 1-way ANOVA with Dunnett’s posthoc test was applied in G.**P < 0.01, ***P < 0.001, data are presented as mean ± SEM. RT-qPCR and immunoblotting were repeated in 3 independent experiments, with similar results, and representative images are shown.
Figure 4
Figure 4. ADORA2A facilitates the acquisition of NE-lineage signature in PCa cells via an ERK/MYC/PYCR axis.
(A and B) Immunoblotting assays demonstrate reduced SYP and NSE levels in LNCaP/AR-ADORA2A cells in the presence of CGS (100 nM, treated for 48 hours) upon siRNA-mediated downregulations of PYCR1 (A) and PYCR2 (B). (C and D) ATAC-Seq show that Rb1Δ/ΔTrp53Δ/Δ GEMM organoids display more accessible chromatin in the promoter region of Pycr1 (C) and Pycr2 (D) than PtenΔ/ΔTrp53Δ/Δ counterparts (n = 2 biological replicates per cell lines). (E and F) Motif analysis identifies the binding site of 5 TFs (E) on the promoter region of Pycr1 and Pycr2 genes using JASPAR. The binding motif of MYC (F) on the promoters of Pycr1 and Pycr2 are displayed. (G) RNA-Seq data of LNCaP/AR-vector and LNCaP/AR-ADORA2A cells in the presence of CGS reveals that MYC is a significantly upregulated transcription factor following the ADORA2A activation. (H) The GSEA plot shows that MYC signaling–related genes are enriched in LNCaP/AR-ADORA2A cells versus LNCaP/AR-vector cells. (I) Immunoblotting results demonstrate decreased PYCR1 and PYCR2 protein levels upon downregulation of MYC via siRNAs in LNCaP/AR-ADORA2A cells treated with CGS21680. (J and K) ChIP-qPCR results show the binding of MYC with the indicated sites of PYCR1 (J) and PYCR2 (K) promoter in LNCaP/AR-ADORA2A cells stimulated by CGS (n = 4). (L) Immunoblotting assay displays upregulated MYC and phospho-ERK1/2 levels in LNCaP/AR-ADORA2A compared with LNCaP/AR-vector cells in the presence of CGS. (M) The GSEA plot reveals that ERK signaling–related genes are enriched in CGS-stimulated versus vehicle-treated ADORA2A-overexpressed LNCaP/AR cells. (N) Immunoblotting assay reveals a reduced MYC expression level upon the treatment of ERK inhibitor GDC-0994 (10 μM, treated for 48 hours) in LNCaP/AR-ADORA2A cells. For statistical analysis, student’s t test was used for J and K. *P < 0.05, **P < 0.01, ***P < 0.001, data are presented as mean ± SEM. For RNA-Seq, n = 3 biological replicates/group; immunoblotting was repeated in 3 independent experiments, with similar results, and representative images are shown.
Figure 5
Figure 5. Enhanced proline synthesis reprograms global histone acetylation in PCa cells.
(A) GO analysis showing the significantly upregulated biological processes, molecular functions, and cellular components in LNCaP/AR-ADORA2A versus LNCaP/AR-vector cells pretreated with CGS. (B) Measurement of intracellular amount of NAD+ in LNCaP/AR-vector and LNCaP/AR-ADORA2A cells (left, n = 5 biological replicates/group), and LASCPC-01-scramble and LASCPC-01-shADORA2A cells (right, n = 4 biological replicates/group). (C and D) Immunoblotting assay shows H3K9ac, H3K18ac, and H3K27ac levels of LNCaP/AR-vector and LNCaP/AR-ADORA2A cells,cultured in CGS-containing medium (C), and in LASCPC-01-scramble and LASCPC-01-shADORA2A cells (D). (E and F) Immunoblotting assay exhibits that downregulation of PYCR1 (E) and PYCR2 (F) in LNCaP/AR-ADORA2A cells restores the decreased levels of H3K27ac in both control medium and CGS-containing medium. (G) Immunoblotting results demonstrate that the reduced H3K27ac levels are rescued by combinatory knockdown of SIRT6/7 in LNCaP/AR-ADORA2A cells in the presence of CGS. For statistical analysis, student’s t test was used for B, left panel, and 1-way ANOVA with Dunnett’s posthoc test was employed in B, right panel. ***P < 0.001, data are presented as mean ± SEM. Immunoblotting experiments were repeated at least 3 times and representative images are shown.
Figure 6
Figure 6. Activation of ADORA2A signaling confers an NE-lineage biased transcription profile to PCa cells.
(A) The cut & tag data show a repressed H3K27ac level in LNCaP/AR-ADORA2A cells upon the stimulation of CGS (n = 2 independent experiments). (B and C) Cut & tag results indicate that the H3K27ac mark of androgen responsive genes (B) and luminal signature genes (C) is decreased in LNCaP/AR-ADORA2A cells upon CGS stimulation. (D) GSEA analysis displays the upregulated hallmarks in LNCaP/AR-ADORA2A cells upon CGS treatment based on the analysis of differential calling peaks of H3K27ac cut & tag experiments. (E) Cut & tag data demonstrate that luminal cell marker genes including AR, FKBP5, KRT8, and KRT18 promoters contain less H3K27ac marks in LNCaP/AR-ADORA2A cells in the presence of CGS. (F and G) Cut & tag results show that stem cell marker gene SOX2 (F) and NE-transcription factor gene MYCN (G) display increased H3K27ac modifications in LNCaP/AR-ADORA2A cells upon stimulation. (H) Motif analysis exhibits the most enriched transcription factor binding sites on H3K27ac peaks in LNCaP/AR-ADORA2A cells upon CGS stimulation.
Figure 7
Figure 7. Genetic ablation of Adora2a suppresses NEPC development and metastasis.
(A) A schematic illustrating the generation of Pbsn-Cre4; Rb1fl/fl; Trp53fl/fl; Adora2afl/fl (TKO) GEMMs. (B) Kaplan-Meier survival curves indicate a prolonged survival in TKO (n = 22) versus DKO (n = 31) mice. (C) Quantification of tumor weight of TKO (n = 9) and DKO (n = 11) mice at 6 months of age. (D) LGPIN, HGPIN, and invasive cancer on TKO and DKO tumors are quantified. Prostate tumors were collected from DKO (n = 8) and TKO (n = 7) mice at 6 months of age. (E) H&E images display the overall metastatic status in the liver of DKO and TKO mice; scale bar: 1 mm; zoom image scale bar: 50 μm. IHC of Pan-CK outlines the boundary of normal hepatocytes and tumor in the liver. SYP and Ki67 indicate metastatic tumor cells that originate from the prostate; scale bar: 100 μm; zoom image scale bar: 30 μm. (F) Quantification of metastatic foci number in DKO (n = 14) and TKO (n= 10) livers at 7 months old. (G) H&E staining demonstrate the whole section of DKO and TKO prostate tumors; scale bar: 1 mm; zoom image scale bar: 50 μm. IHC confirms the absence of ADORA2A in TKO tumors. The NE-lineage marker SYP and luminal cell markers CK8 and AR were stained in DKO and TKO tumors; scale bar: 50 μm; zoom image scale bar: 100 μm. (H) The proportion of SYP+ NE tumors in DKO (n = 5) and TKO (n = 5) mice. For statistical analysis, log-rank test was employed in B; Mann-Whitney test was utilized for C; student’s t test was used for H. **P < 0.01, ***P < 0.001, data are presented as means ± SEM.
Figure 8
Figure 8. Deletion of Adora2a suppresses the tumor development in a NE lung cancer model.
(A) A schematic showing the method of generation of a NE lung cancer model. Briefly, the Cre-expressing adenovirus (Adeno-Cre) were intratracheally injected into the Rb1fl/fl; Trp53fl/fl and Rb1fl/fl; Trp53fl/fl; Adora2afl/fl mice to establish the Adeno-DKO and Adeno-TKO lung cancer mouse models. (B) Body weight of Adeno-DKO (n = 8) and Adeno-TKO (n = 8) mice at early stage of 90 days after Adeno-Cre injection. (C) The H&E staining displays overall tumor formation of Adeno-DKO and Adeno-TKO mice in the lung at early stage; scale bar: 1 mm; zoom image scale bar: 50 μm. IHC images demonstrate the expression of SYP and Ki67 in the lung tumor of Adeno-DKO and Adeno-TKO mice, scale bar = 100 μm; zoom image scale bar: 30 μm. (D) The lung tissues of Adeno-DKO and Adeno-TKO mice at late stage of 240 days after Adeno-Cre administration are shown. Dotted red lines indicate the tumor area on the lung tissue. Scale bar: 2mm. (E) Quantification of lung tumor lesions with distinct diameters in Adeno-DKO (n = 4) and Adeno-TKO (n = 3) mice at late stage of 240 days after Adeno-Cre injection. (F) H&E images exhibit tumor formations in the lung of Adeno-DKO and Adeno-TKO mice at late stage of 240 days after Adeno-Cre injection. Scale bar: 1 mm. For statistical analysis, student’s t test was used for B. **P < 0.01, data are presented as mean ± SEM.
Figure 9
Figure 9. Pharmacological inhibition of ADORA2A restrains NE tumor growth in vitro and in vivo.
(A and B) The Cell Titer Glo assay shows that the ADORA2A antagonist SCH58261 restrains the proliferation of LASCPC-01 (A) and LNCaP/AR-shRB1/TP53 (B) NEPC cells in vitro (n = 4 biological replicates/group). (C and D) SCH58261 exerts no inhibitory effect on the proliferation of VCaP (C) cells and LNCaP/AR (D) ADPC cells in vitro (n = 4 biological replicates/group). (E and F) The in vivo tumor growth curves (E) and the endpoint tumors (F) derived from TRAMP-C1 (TC1) cells that were treated with either vehicle and SCH58261 (vehicle, n = 10; SCH58261, n = 6; Cells were subcutaneously injected into 6-week-old male BALB/c nude hosts). (G and H) The in vivo tumor growth curves (G) and the endpoint tumors (H) derived from Myc-CaP cells that were treated with either vehicle and SCH58261 (vehicle, n = 14; SCH58261, n = 14; Cells were s.c. inoculated into 6-week-old male FVB hosts). (I and J) The in vivo tumor growth curves (I) and the endpoint tumors (J) derived from LASCPC-01 cells that were treated with either vehicle and SCH58261 (vehicle, n = 13; SCH58261, n = 13; cells were s.c. injected into 6-week-old male BALB/c nude mice). (K and L) The in vivo tumor growth curves (I) and the endpoint tumors (J) derived from NCI-H146 cells that were treated with either vehicle and SCH58261 (vehicle, n = 5; SCH58261, n = 7; cells were s.c. injected into 6-week-old male BALB/c nude hosts). Student’s t test was used in AD, E, G, I, and K. *P < 0.05, **P < 0.01. The SCH58261 powder was dissolved in 3% DMSO, 10% HS-15, and 87% saline solution. 3 mg/kg SCH58261 was i.p. administered to each mouse every other day.

References

    1. Rubin MA, et al. Impact of lineage plasticity to and from a neuroendocrine phenotype on progression and response in prostate and lung cancers. Mol Cell. 2020;80(4):562–577. doi: 10.1016/j.molcel.2020.10.033. - DOI - PMC - PubMed
    1. Quintanal-Villalonga A, et al. Lineage plasticity in cancer: a shared pathway of therapeutic resistance. Nat Rev Clin Oncol. 2020;17(6):360–371. doi: 10.1038/s41571-020-0340-z. - DOI - PMC - PubMed
    1. Ku SY, et al. Rb1 and Trp53 cooperate to suppress prostate cancer lineage plasticity, metastasis, and antiandrogen resistance. Science. 2017;355(6320):78–83. doi: 10.1126/science.aah4199. - DOI - PMC - PubMed
    1. Marcoux N, et al. EGFR-mutant adenocarcinomas that transform to small-cell lung cancer and other neuroendocrine carcinomas: clinical outcomes. J Clin Oncol. 2019;37(4):278–285. doi: 10.1200/JCO.18.01585. - DOI - PMC - PubMed
    1. Pavlova NN, et al. The hallmarks of cancer metabolism: Still emerging. Cell Metab. 2022;34(3):355–377. doi: 10.1016/j.cmet.2022.01.007. - DOI - PMC - PubMed

Publication types