. 2023 Dec 15:12:e91183.
doi: 10.7554/eLife.91183.

Serial attentional resource allocation during parallel feature value tracking

Affiliations

Serial attentional resource allocation during parallel feature value tracking

Christian Merkel et al. Elife. .

Abstract

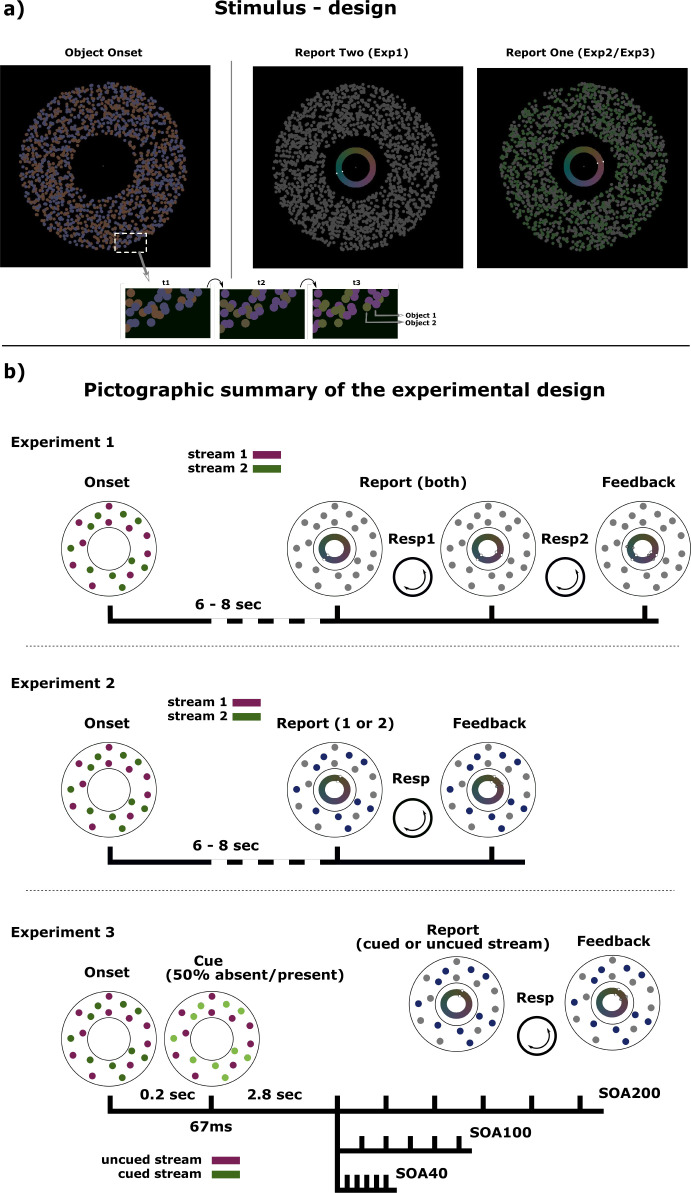
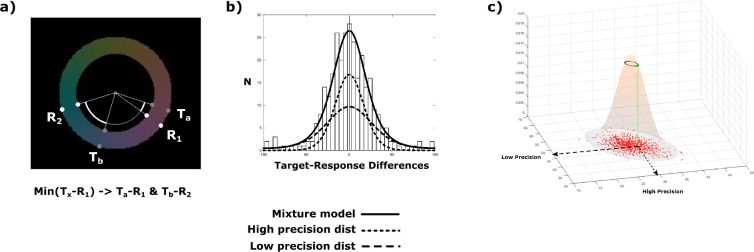
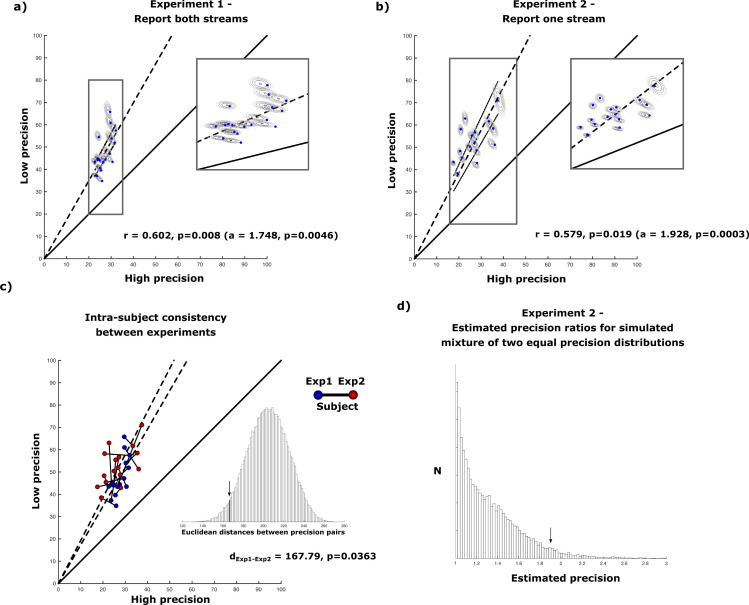
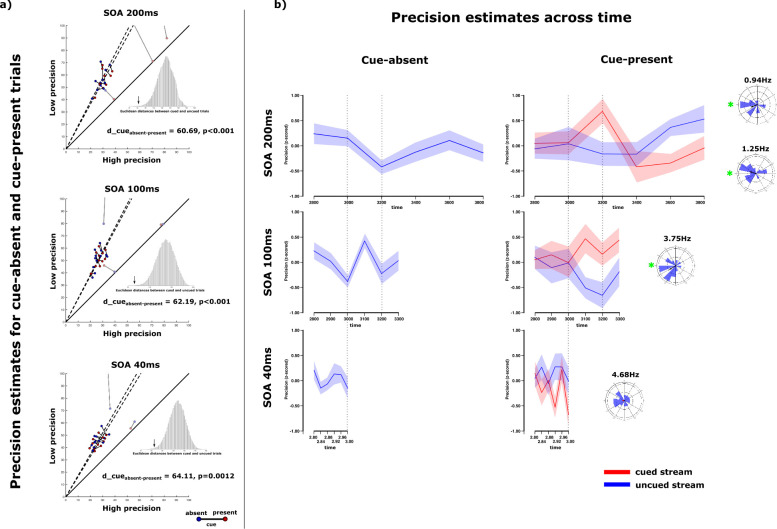
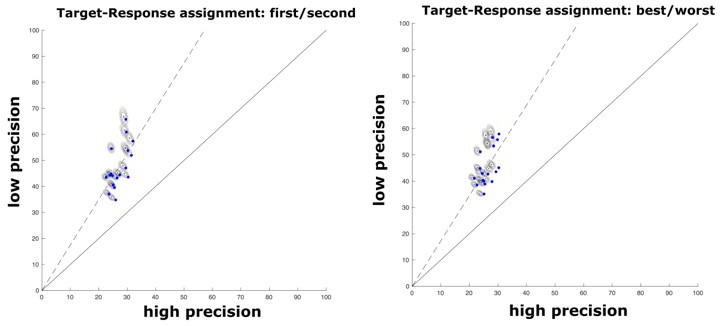
The visual system has evolved the ability to track features like color and orientation in parallel. This property aligns with the specialization of processing these feature dimensions in the visual cortex. But what if we ask to track changing feature-values within the same feature dimension? Parallel tracking would then have to share the same cortical representation, which would set strong limitations on tracking performance. We address this question by measuring the precision of color representations when human observers track the color of two superimposed dot clouds that simultaneously change color along independent trajectories in color-space. We find that tracking precision is highly imbalanced between streams and that tracking precision changes over time by alternating between streams at a rate of ~1 Hz. These observations suggest that, while parallel color tracking is possible, it is highly limited, essentially allowing for only one color-stream to be tracked with precision at a given time.

Keywords: attentional tracking; color vision; feature-based attention; human; neuroscience.


Conflict of interest statement

CM, LB, MB, MS, JH No competing interests declared

Figures

Figure 1.
Figure 1.. Experimental paradigm.
(a) General stimulus design: Two superimposed dot clouds are present throughout each trial. Subjects are asked to attend to the colors of both objects as they transit through hue-space. In order to remove any spatial depth cue specific to one of the two objects, individual dots are superimposed randomly at time of initial generation. Furthermore, 10 random dots of each objects interchange identity (current color) at each frame throughout the trial, thus discouraging the generation of any spatial configuration in aiding feature tracking. At the end of the tracking phase one (Exp2/Exp3) or two (Exp1) of the streams change to grey and subjects have to report the last perceived color for that object using a dial. (b) Experimental design and time-course of trials for all three experiments. In experiment 1 and 2, subjects are tracking both color streams for 6–8 sec after which they are asked to report back on one (Exp1) or two (Exp2) of the streams. Probed color streams turn grey to indicate that they have to be reported on. After dialing in the response with a cursor on a centrally presented color wheel, subjects receive feedback about the correct response via a second cursor on the same color wheel. Experiment 3 additionally introduces a luminance cue for one of the two streams at the beginning of the tracking phase in 50% of the trials. After a set of fixed tracking intervals, subjects have to report on the color of the previously cued or uncued stream. This experiment is performed with three different sets (SOA200/SOA100/SOA40) of six tracking intervals.
Figure 2.
Figure 2.. Aquisition of precision responses per trial and mixture modeling.
(a) In experiment 1, subjects have to report on two target colors in sequence. The two reports (R1 and R2) and the two target colors (Ta and Tb) for one trial create two possible target-response associations (and therefore two pairs of precision responses): (Ta-R1 & Tb-R2) or (Tb-R1 & Ta-R2). This ambiguity was resolved by pairing targets and responses based on the minimum angular difference for the first response to one of the targets (Min(Tx-R1)), and the second response to the remaining target (T~x-R2). This pairing is based on the assumption, that the first response would always be performed with higher confidence by the subject. It would be highly unlikely that for one trial subjects’ first response would be a guess and the second response an accurate report based on correct tracking if they were able to only track one stream. Additionally, this leaves the possibility of the second response still being more accurate than the first response (by chance or actual cognitive performance). (b) Von Mises mixture model utilized in the experiments. The distribution of all precision responses (angular differences between response and target) would be the sum of responding each of the two tracked streams with each being allocated a certain cognitive resource (high/low precision). (c) The results of the Von Mises mixture models (as the pair of precision responses) is tested by Monte-Carlo-simulations. We tested, whether the parameters of the Von Mises mixture models can be estimated in artificially simulated sets of high and low precision target-response distributions based on those same parameters. The simulations confirm, that the estimated parameters reflect the ground truth of a sum of two precision distributions and not just a general inherent property of the model.
Figure 3.
Figure 3.. Results of uneven attentional resource distribution amongst two parallel color streams in experiment 1 and 2.
(a) High and low precision estimates for each of the tested subjects (n = 18) (blue dots) in experiment 1. Additionally, the results of the Monte-Carlo simulated precision estimates for each subject are displayed as two-dimensional gaussians. In general, subjects are almost twice as precise in responding to one of the streams compared to the other stream. (b) Results for experiment 2. When subjects (n = 16) have to report only one stream per trial (while still attending to both color streams), the general ratio of high and low precision responses remain. (c) The same subjects show very similar pairs of precision estimates in both experiments (irrespective of whether they have to respond to both streams sequentially or only one stream). (d) Estimated precision estimates for mixture models containing two distributions with equal deviation based on the means of each subjects estimated precisions. The estimated precision ratio of Mixture models containing two equal distributions reaches a median ratio of 1.24 and values higher than 1.928 in less than 5% of conducted simulations.
Figure 4.
Figure 4.. Results of Experiment 3.
(a) The ratio of slightly lower than 2 remains present between high and low precision estimates for experiment 3. Importantly, individual precision estimates do not vary between trials in which a luminance cue is presented and in trials in which the luminance change is absent. The cue itself does not influence the general precision estimate collapsed over tracking intervals. This holds true for all three sets of tracking intervals (SOA200 /SOA100/SOA40). (b) Precision estimate time courses with standard errors (n = 15). For cue-absent trials no systematic variation in precision estimates could be observed over time in Exp3a (SOA200) and Exp3c (SOA100). However, precision estimates changed for different tracking intervals in cue-absent trials in Exp3b (SOA100). In Exp3a (SOA200), precision estimates for the cued and uncued stream differed over time. Specifically, precision for both streams seemed to exhibit an antiphasic relation at around 1Hz. Phase differences of precision estimates between cued and uncued streams cluster around 180° in this case. Exp3b (SOA100) shows a very similar time-course for the precision estimates of cued and uncued streams over 2.8 sec to 3.2 sec comparable to the SOA200-experiment. Another, faster, oscillation (3.75Hz) can be additionally observed with the same anti-phasic relation between cued and uncued stream. In Exp3c (SOA40) no stream-related differences over the tested intervals can be observed.
Author response image 1.

Update of

  • doi: 10.1101/2023.09.12.557201

References

    1. Alvarez GA, Franconeri SL. How many objects can you track? Evidence for a resource-limited attentive tracking mechanism. Journal of Vision. 2007;7:14. doi: 10.1167/7.13.14. - DOI - PubMed
    1. Andersen SK, Müller MM. Behavioral performance follows the time course of neural facilitation and suppression during cued shifts of feature-selective attention. PNAS. 2010;107:13878–13882. doi: 10.1073/pnas.1002436107. - DOI - PMC - PubMed
    1. Bartsch MV, Boehler CN, Stoppel CM, Merkel C, Heinze HJ, Schoenfeld MA, Hopf JM. Determinants of global color-based selection in human visual cortex. Cerebral Cortex. 2015;25:2828–2841. doi: 10.1093/cercor/bhu078. - DOI - PubMed
    1. Bartsch MV, Loewe K, Merkel C, Heinze HJ, Schoenfeld MA, Tsotsos JK, Hopf JM. Attention to color sharpens neural population tuning via feedback processing in the human visual cortex hierarchy. The Journal of Neuroscience. 2017;37:10346–10357. doi: 10.1523/JNEUROSCI.0666-17.2017. - DOI - PMC - PubMed
    1. Bartsch MV, Merkel C, Schoenfeld MA, Hopf JM. Attention expedites target selection by prioritizing the neural processing of distractor features. Communications Biology. 2021;4:814. doi: 10.1038/s42003-021-02305-9. - DOI - PMC - PubMed