

Racial Equity in Living Donor Kidney Transplant Centers, 2008-2018
- PMID: 38100105
- PMCID: PMC10724764
- DOI: 10.1001/jamanetworkopen.2023.47826
Racial Equity in Living Donor Kidney Transplant Centers, 2008-2018
Abstract
Importance: It is unclear whether center-level factors are associated with racial equity in living donor kidney transplant (LDKT).
Objective: To evaluate center-level factors and racial equity in LDKT during an 11-year time period.
Design, setting, and participants: A retrospective cohort longitudinal study was completed in February 2023, of US transplant centers with at least 12 annual LDKTs from January 1, 2008, to December 31, 2018, identified in the Health Resources Services Administration database and linked to the US Renal Data System and the Scientific Registry of Transplant Recipients.
Main outcomes and measures: Observed and model-based estimated Black-White mean LDKT rate ratios (RRs), where an RR of 1 indicates racial equity and values less than 1 indicate a lower rate of LDKT of Black patients compared with White patients. Estimated yearly best-case center-specific LDKT RRs between Black and White individuals, where modifiable center characteristics were set to values that would facilitate access to LDKT.
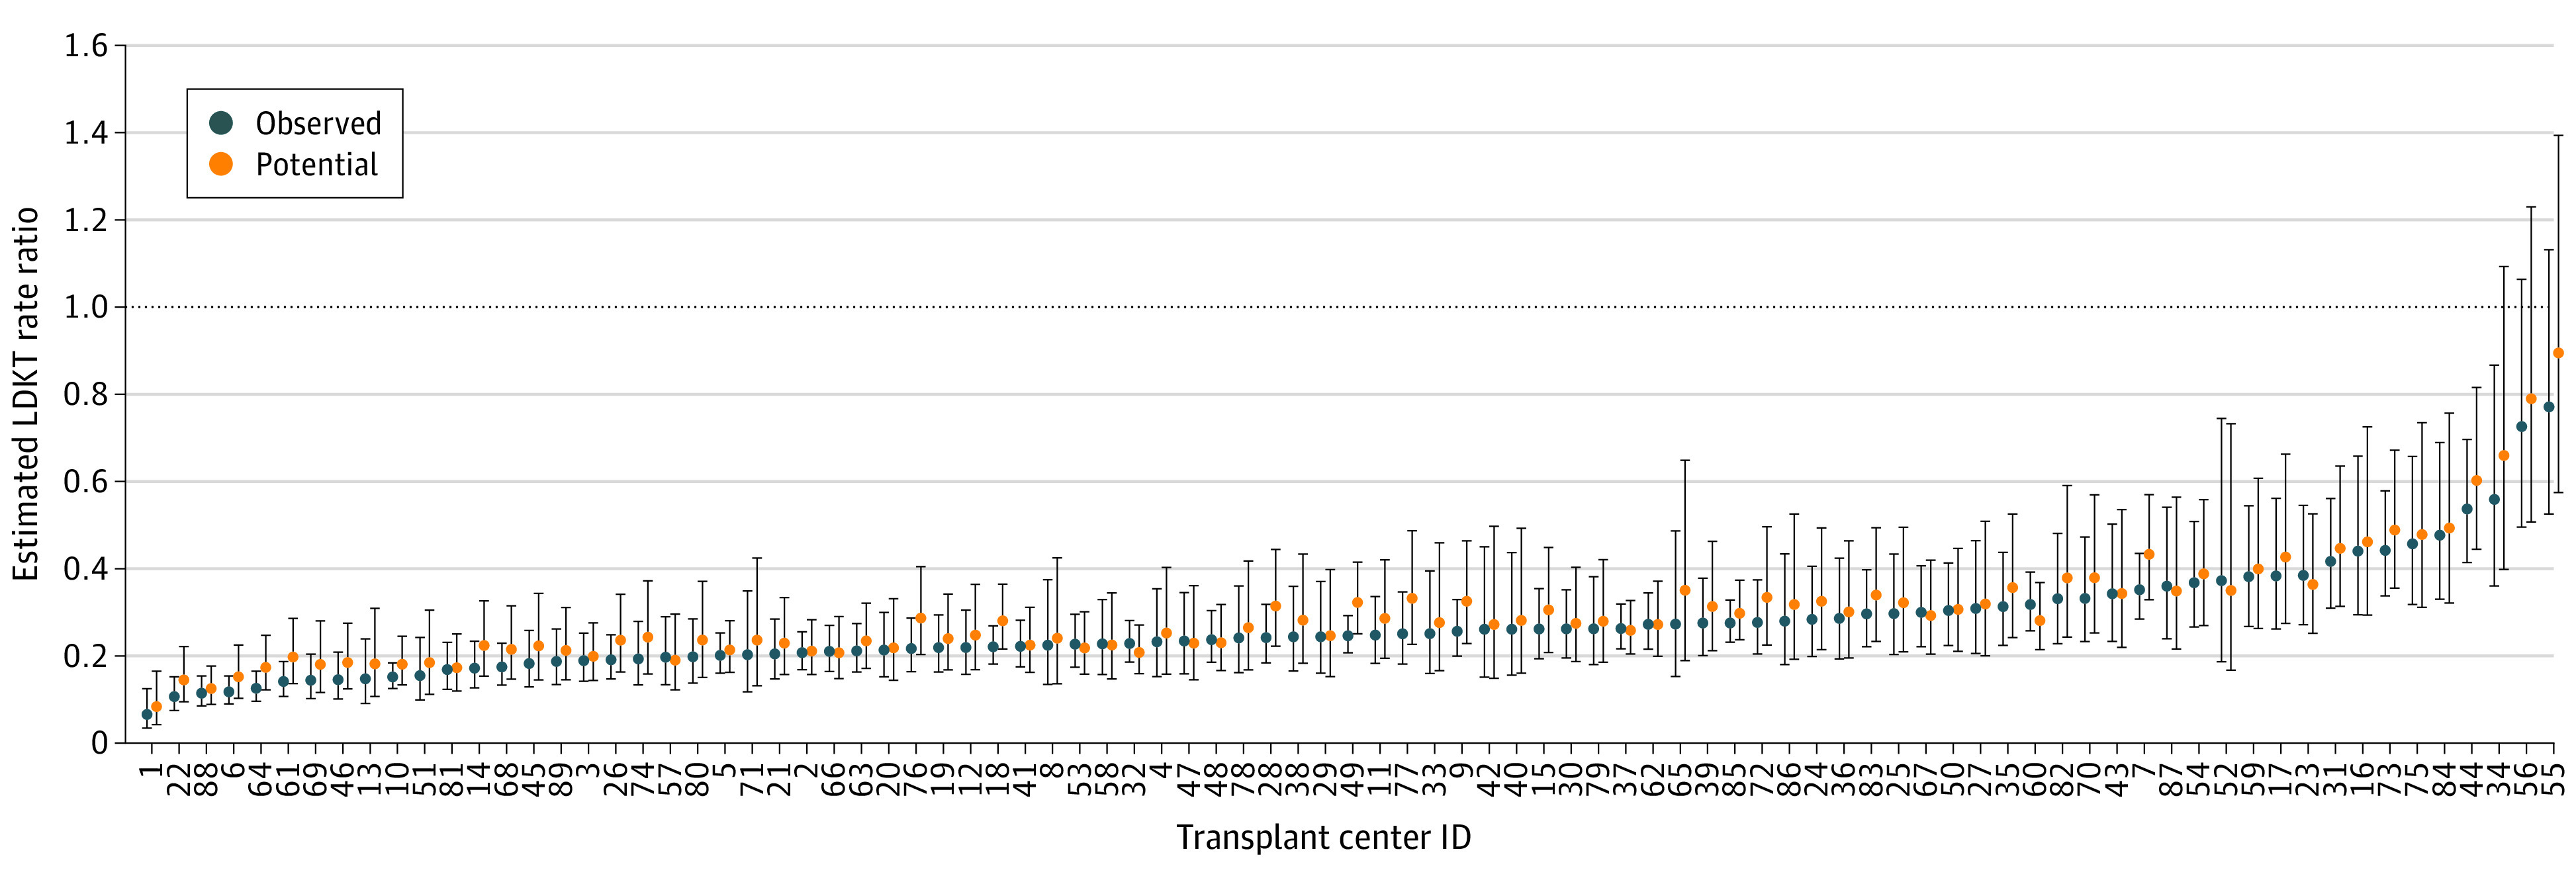
Results: The final cohorts of patients included 394 625 waitlisted adults, of whom 33.1% were Black and 66.9% were White, and 57 222 adult LDKT recipients, of whom 14.1% were Black and 85.9% were White. Among 89 transplant centers, estimated yearly center-level RRs between Black and White individuals accounting for center and population characteristics ranged from 0.0557 in 2008 to 0.771 in 2018. The yearly median RRs ranged from 0.216 in 2016 to 0.285 in 2010. Model-based estimations for the hypothetical best-case scenario resulted in little change in the minimum RR (from 0.0557 to 0.0549), but a greater positive shift in the maximum RR from 0.771 to 0.895. Relative to the observed 582 LDKT in Black patients and 3837 in White patients, the 2018 hypothetical model estimated an increase of 423 (a 72.7% increase) LDKTs for Black patients and of 1838 (a 47.9% increase) LDKTs for White patients.
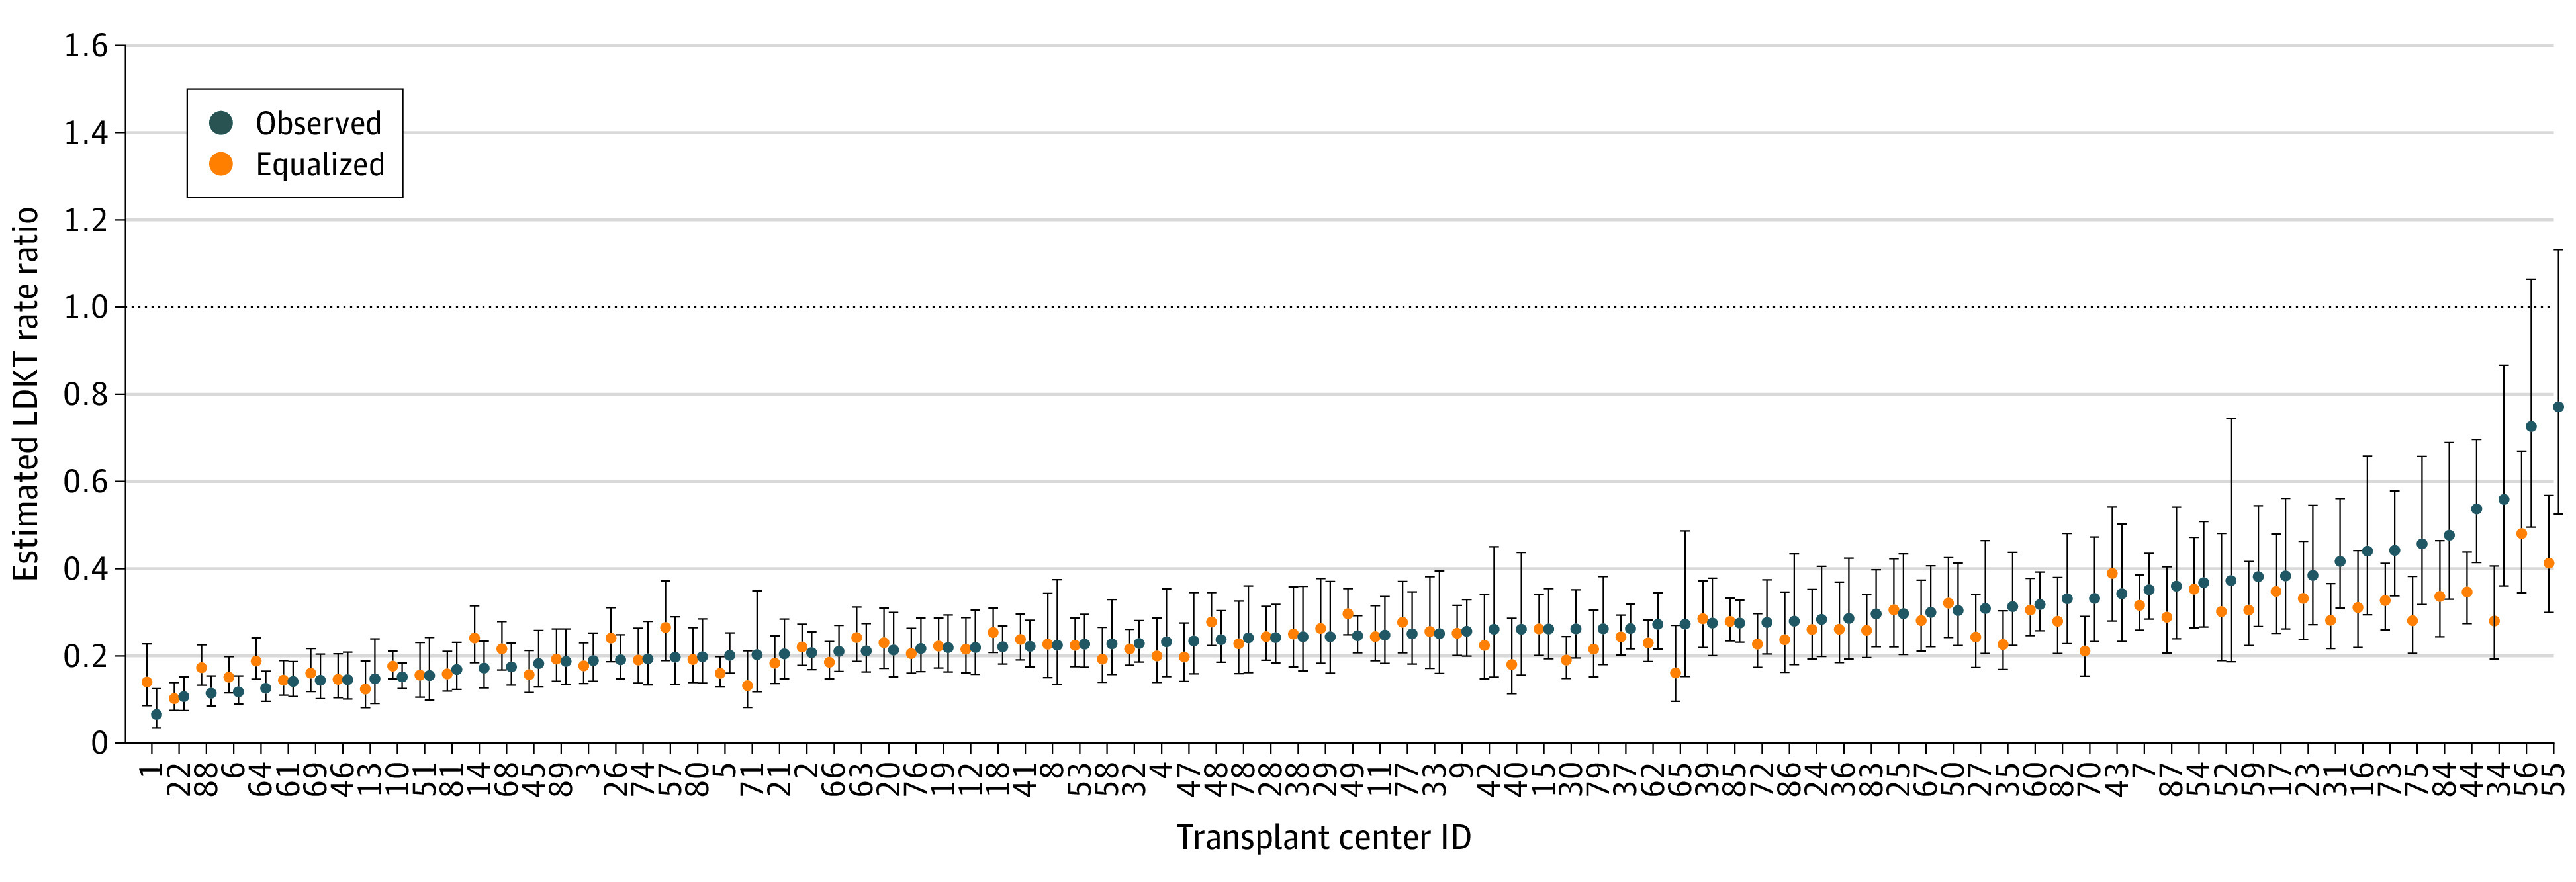
Conclusions and relevance: In this cohort study of patients with kidney failure, no substantial improvement occurred over time either in the observed or the covariate-adjusted estimated RRs. Under the best-case hypothetical estimations, modifying centers' participation in the paired exchange and voucher programs and increased access to public insurance may contribute to improved racial equity in LDKT. Additional work is needed to identify center-level and program-specific strategies to improve racial equity in access to LDKT.
Conflict of interest statement
Figures
Comment in
-
Racial Disparities in Living Donor Kidney Transplantation-How Can We Bridge the Gap?JAMA Netw Open. 2023 Dec 1;6(12):e2347808. doi: 10.1001/jamanetworkopen.2023.47808. JAMA Netw Open. 2023. PMID: 38100112 No abstract available.
Similar articles
-
Evaluation of Community-Level Vulnerability and Racial Disparities in Living Donor Kidney Transplant.JAMA Surg. 2021 Dec 1;156(12):1120-1129. doi: 10.1001/jamasurg.2021.4410. JAMA Surg. 2021. PMID: 34524392 Free PMC article.
-
Association of Race and Ethnicity With Live Donor Kidney Transplantation in the United States From 1995 to 2014.JAMA. 2018 Jan 2;319(1):49-61. doi: 10.1001/jama.2017.19152. JAMA. 2018. PMID: 29297077 Free PMC article.
-
Neighborhood Segregation and Access to Live Donor Kidney Transplantation.JAMA Intern Med. 2024 Apr 1;184(4):402-413. doi: 10.1001/jamainternmed.2023.8184. JAMA Intern Med. 2024. PMID: 38372985 Free PMC article.
-
Living Donor Kidney Transplantation: Improving Education Outside of Transplant Centers about Live Donor Transplantation--Recommendations from a Consensus Conference.Clin J Am Soc Nephrol. 2015 Sep 4;10(9):1659-69. doi: 10.2215/CJN.00950115. Epub 2015 Jun 26. Clin J Am Soc Nephrol. 2015. PMID: 26116651 Free PMC article.
-
Storytelling to Inspire Dialysis Patients to Learn about Living Donor Kidney Transplant.Blood Purif. 2021;50(4-5):655-661. doi: 10.1159/000512651. Epub 2021 Jan 13. Blood Purif. 2021. PMID: 33440381 Review.
Cited by
-
Identifying when racial and ethnic disparities arise along the continuum of transplant care: a national registry study.Lancet Reg Health Am. 2024 Oct 3;38:100895. doi: 10.1016/j.lana.2024.100895. eCollection 2024 Oct. Lancet Reg Health Am. 2024. PMID: 39430573 Free PMC article.
-
Exploring the relationship between website quality and equity in living donor kidney transplant.Front Transplant. 2024 Nov 25;3:1490876. doi: 10.3389/frtra.2024.1490876. eCollection 2024. Front Transplant. 2024. PMID: 39654970 Free PMC article.
References
Publication types
MeSH terms
Substances
Grants and funding
LinkOut - more resources
Full Text Sources
Medical
