. 2024 Feb 1;147(2):542-553.
doi: 10.1093/brain/awad387.

Anti-seizure gene therapy for focal cortical dysplasia

Affiliations

Anti-seizure gene therapy for focal cortical dysplasia

Amanda Almacellas Barbanoj et al. Brain. .

Abstract

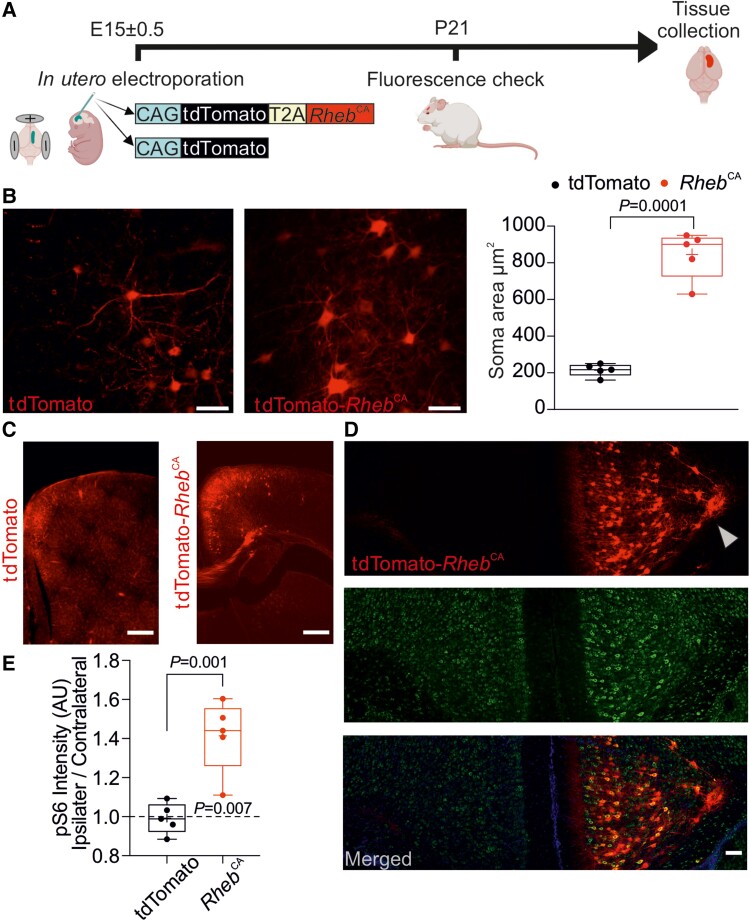
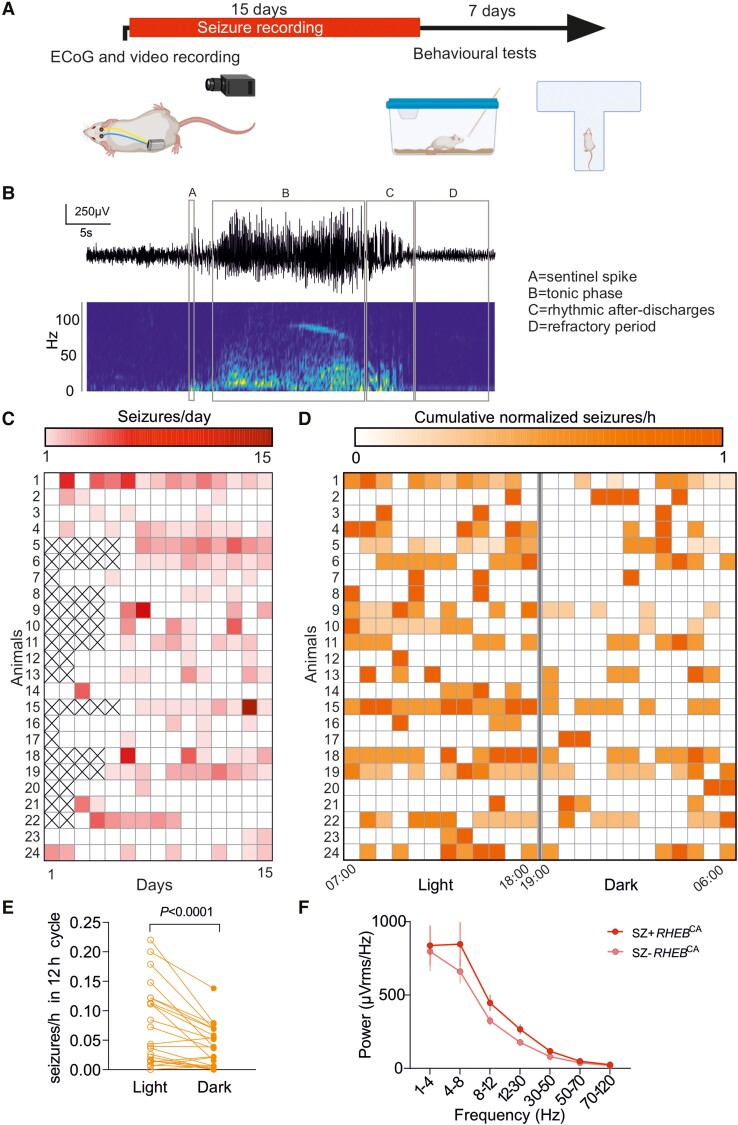
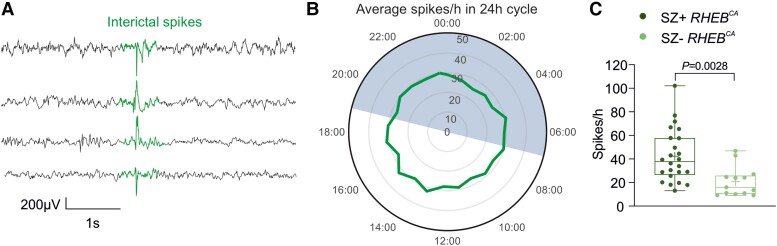
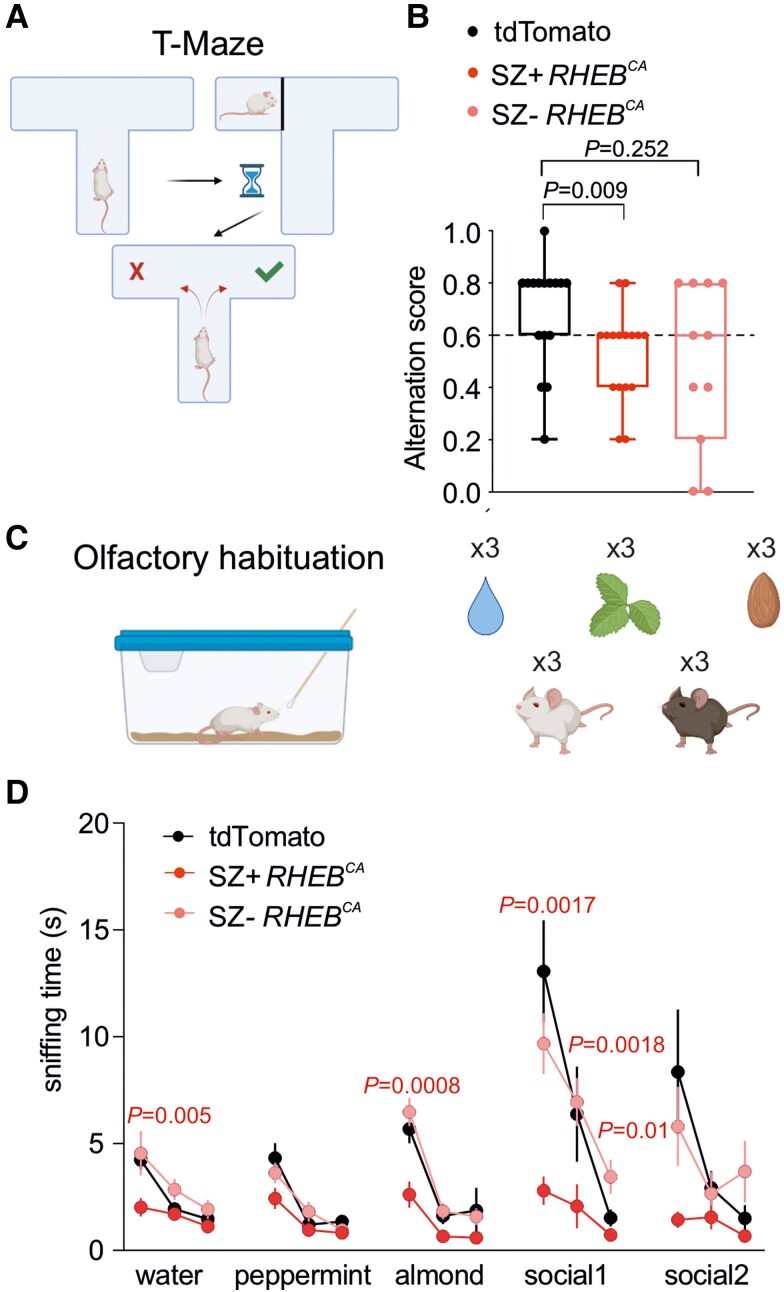
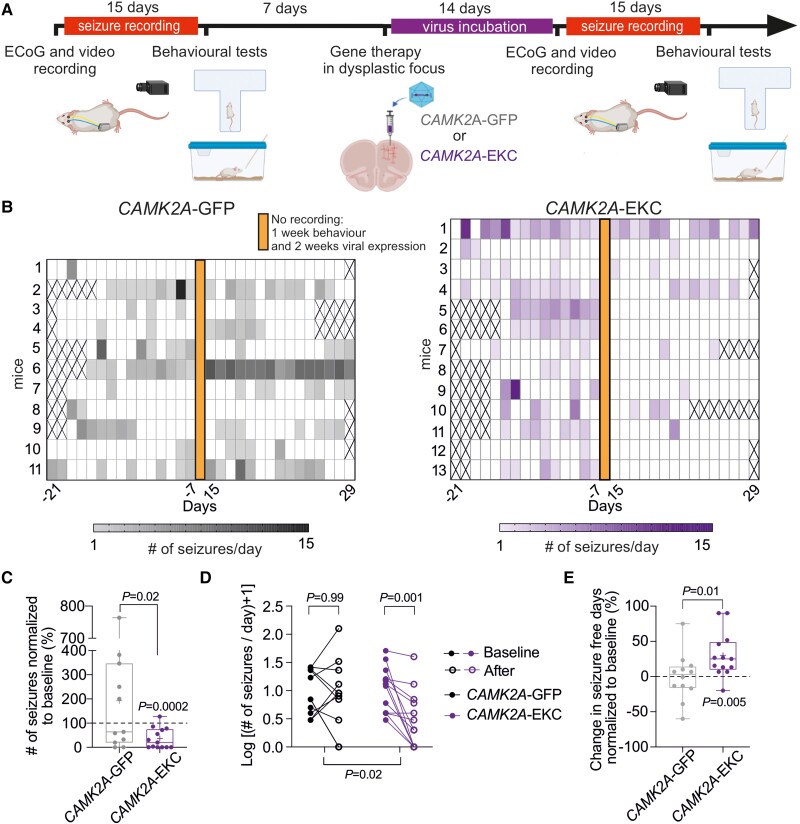
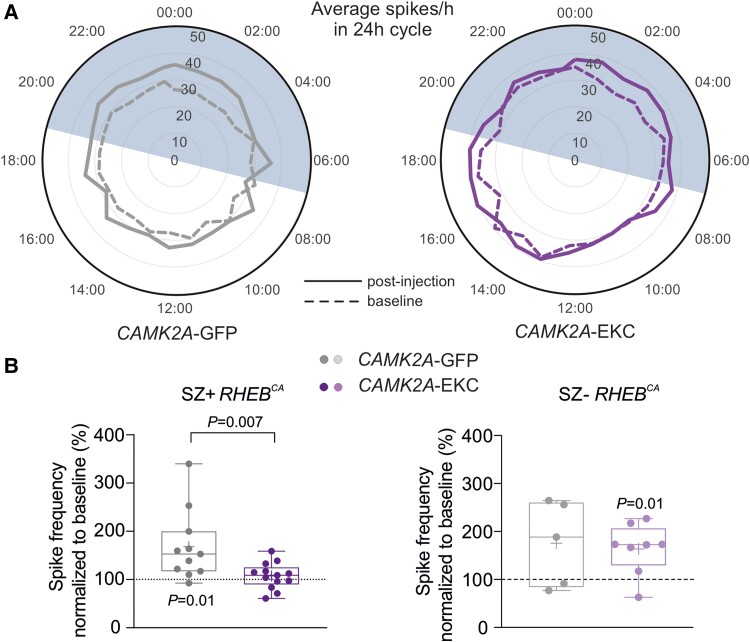
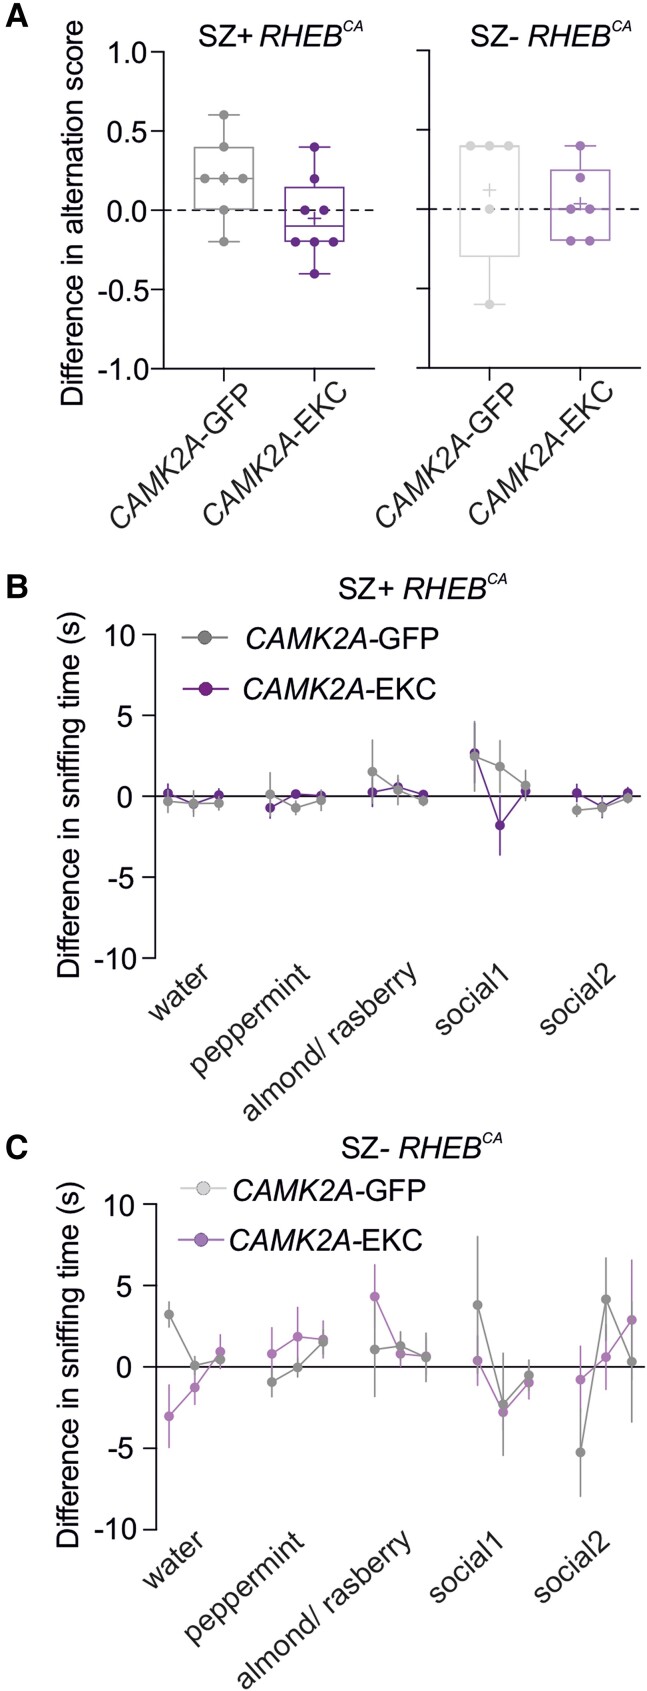
Focal cortical dysplasias are a common subtype of malformation of cortical development, which frequently presents with a spectrum of cognitive and behavioural abnormalities as well as pharmacoresistant epilepsy. Focal cortical dysplasia type II is typically caused by somatic mutations resulting in mammalian target of rapamycin (mTOR) hyperactivity, and is the commonest pathology found in children undergoing epilepsy surgery. However, surgical resection does not always result in seizure freedom, and is often precluded by proximity to eloquent brain regions. Gene therapy is a promising potential alternative treatment and may be appropriate in cases that represent an unacceptable surgical risk. Here, we evaluated a gene therapy based on overexpression of the Kv1.1 potassium channel in a mouse model of frontal lobe focal cortical dysplasia. An engineered potassium channel (EKC) transgene was placed under control of a human promoter that biases expression towards principal neurons (CAMK2A) and packaged in an adeno-associated viral vector (AAV9). We used an established focal cortical dysplasia model generated by in utero electroporation of frontal lobe neural progenitors with a constitutively active human Ras homolog enriched in brain (RHEB) plasmid, an activator of mTOR complex 1. We characterized the model by quantifying electrocorticographic and behavioural abnormalities, both in mice developing spontaneous generalized seizures and in mice only exhibiting interictal discharges. Injection of AAV9-CAMK2A-EKC in the dysplastic region resulted in a robust decrease (∼64%) in the frequency of seizures. Despite the robust anti-epileptic effect of the treatment, there was neither an improvement nor a worsening of performance in behavioural tests sensitive to frontal lobe function. AAV9-CAMK2A-EKC had no effect on interictal discharges or behaviour in mice without generalized seizures. AAV9-CAMK2A-EKC gene therapy is a promising therapy with translational potential to treat the epileptic phenotype of mTOR-related malformations of cortical development. Cognitive and behavioural co-morbidities may, however, resist an intervention aimed at reducing circuit excitability.

Keywords: epilepsy; focal cortical dysplasia; gene therapy; translation.


Conflict of interest statement

D.M.K. and S.S. are listed as inventors on Patent WO2018229254A1. G.L., D.M.K. and S.S. have equity in a company that aims to bring epilepsy gene therapy to the clinic.

Figures

Figure 1
Figure 1
RHEB CA mouse model recapitulates histological hallmarks of focal cortical dysplasia type II. (A) Experimental plan. E = embryonic Day; P = postnatal Day. Created with BioRender.com. (B) Left and centre: Fluorescence images of neurons expressing either tdTomato alone (control) or tdTomato-RHEBCA; scale bars = 50 μm. Right: Quantification of neuronal soma area (tdTomato, n = 5 mice, 2–5 slices per animal; RHEBCA, n = 5 mice, 2–4 slices per animal, unpaired Student’s t-test). (C) tdTomato or tdTomato-RHEBCA prefrontal cortical slices; scale bars = 500 μm. (D) Representative coronal sections of prefrontal cortex in a RHEBCA electroporated mouse. Top: tdTomato; middle: pS6; bottom: merged images. Note the dyslamination and heterotopic neurons in the top panel (arrowhead: heterotopic neurons in the corpus callosum); scale bars = 100 μm. (E) pS6 fluorescence intensity in tdTomato (control) or tdTomato-RHEBCA with the ipsilateral (electroporated) normalized to the contralateral hemispheres (n = 5 mice, 2–4 slices per mouse, unpaired Student’s t-test and one-sample t-test versus 1). Data are plotted as box and whiskers, representing interquartile range (box), median (horizontal line), mean (+) and maximum and minimum (whiskers), together with all the points.
Figure 2
Figure 2
RHEB CA electroporated mice exhibit spontaneous generalized seizures preferentially during the light phase of the 24-h light-dark cycle. (A) Timeline showing ECoG and video recording for quantification of seizures and behavioural tests (created with BioRender.com). (B) Representative seizure displaying the four main features used for automatic detection. (C) Raster plot showing the number for seizures for each animal (15 days, n = 24). (D) Raster plot of the distribution of the number of seizures per hour for each animal during the entire baseline recording period, normalized for each animal to the day with the maximum number of seizures (15 days, n = 24 animals). (E) Number of seizures normalized to recorded hours during the 12 h light and 12 h dark periods during 10–15 days shown for individual mice (n = 24, paired Wilcoxon test). (F) Power at different frequency bands in animals with (SZ+ RHEBCA  n = 24) and without (SZ− RHEBCA  n = 13) seizures.
Figure 3
Figure 3
The RHEBCA mouse model displays features of cortical hyperexcitability. (A) Representative traces from four different animals showing interictal spikes (aligned at centre). (B) Clock graph displaying the average number of spikes per hour recorded during the 12 h:12 h light-dark cycle; mice with and without generalized seizures (SZ+ RHEBCA and SZ− RHEBCA, respectively) were included in this analysis (n = 38 mice). The dark phase was between 19:00 and 07:00. (C) Box plot showing the number of interictal spikes per hour (SZ− RhebCA  n = 13; SZ+ RhebCA  n = 24; unpaired Student’s t-test). Data are plotted as box and whiskers, representing interquartile range (box), median (horizontal line), mean (+) and maximum and minimum (whiskers), together with all the points.
Figure 4
Figure 4
RHEB CA mice have cognitive impairments. (A) T-maze test (created with BioRender.com). (B) Box plot displaying the average alternation score in the T-maze test for td-Tomato (n = 16), SZ+ RHEBCA (n = 16) and SZ− RHEBCA (n = 11) mice [Fisher’s exact test (>0.6 versus ≤0.6), tdTomato versus SZ+ RHEBCA or SZ− RHEBCA]. Data are plotted as box and whiskers, representing interquartile range (box), median (horizontal line) and maximum and minimum (whiskers), together with all the points. (C) Olfactory habituation test. Each smell [water, peppermint, almond and other mice (social)] was presented three times (created with BioRender.com). (D) Graph displaying the sniffing time of three neutral smells (water, peppermint, almond) and two social smells in tdTomato (n = 16), SZ+ RHEBCA (n = 17) and SZ− RHEBCA (n = 11) mice. Repeated measures two-way ANOVA (Experimental group × Trial factor P < 0.0001; trial factor P < 0.0001; experimental group factor P = 0.0005) followed by Bonferroni multiple comparison test.
Figure 5
Figure 5
CAMK2A-EKC therapy reduces seizure frequency. (A) Timeline (created with BioRender.com). (B) Heat map displaying seizure occurrence in each animal injected with either CAMK2A-GFP (grey) or CAMK2A-EKC virus (purple) before and after the treatment (virus injection on Day 0). Crosses correspond to days where data acquisition was incomplete. (C) Number of seizures normalized to baseline for either animals treated with CAMK2A-GFP or CAMK2A-EKC (unpaired Student’s t-test and one-sample t-test versus 100%). Data are plotted as box and whiskers, representing interquartile range (box), median (horizontal line), mean (+) and maximum and minimum (whiskers), together with all the points. (D) Slope graph displaying the change in seizure frequency for animals injected with CAMK2A-EKC (n = 13 mice) or CAMK2A-GFP (n = 11 mice) displayed as log(seizures + 1). Two-way ANOVA followed by Bonferroni multiple comparison test. (E) Graph showing the percentage of seizure-free days normalized to baseline (unpaired Student’s t-test and one-sample t-test versus 0).
Figure 6
Figure 6
Effects of CAMK2A-EKC therapy on spikes in RHEBCA animals with and without seizures. (A) Circular graph displaying the average number of spikes per hour before (dashed line) and after the therapy (continuous line) over 24 h cycles. (B) Box plot displaying average spike frequencies, normalized to baseline, in SZ+ RHEBCA animals (CAMK2A-GFP n = 11 mice, CAMK2A-EKC n = 13 mice; unpaired Student’s t-test and one-sample t-test versus 100%) and in SZ− RHEBCA animals (CAMK2A-GFP n = 5 mice, CAMK2A-EKC, n = 8 mice). Data are plotted as box and whiskers, representing interquartile range (box), median (horizontal line), mean (+) and maximum and minimum (whiskers), together with all the points.
Figure 7
Figure 7
CAMK2A-EKC therapy neither aggravates nor worsens behavioural deficits in the RHEBCA model. (A) Box plot showing the difference in alternation scores in the T-maze of CAMK2A-GFP (n = 7) or CAMK2A-EKC (n = 8) treatment in SZ+ RHEBCA, and CAMK2A-GFP (n = 5) or CAMK2A-EKC (n = 6) treatment in SZ− RHEBCA, compared to baseline. Each circle represents an individual animal (one-sample t-test versus 0 and two-way ANOVA, P = 0.1407). Data are plotted as box and whiskers, representing interquartile range (box), median (horizontal line), mean (+) and maximum and minimum (whiskers), together with all the points. (B) Sniffing time for three neutral smells and two social smells before and after either CAMK2A-GFP (n = 7) or CAMK2A-EKC (n = 8) treatment in SZ+ RHEBCA [one-sample t-test versus 0 (α = 0.003, corrected for multiple comparison) and repeated measurement mixed-effects analysis, P = 0.37]. (C) Sniffing time for three neutral smells and two social smells before and after either CAMK2A-GFP (n = 5) or CAMK2A-EKC (n = 6) treatment in SZ− RHEBCA [one-sample t-test versus 0 (α = 0.003, corrected for multiple comparison) and repeated measurement mixed-effects analysis, P = 0.98].

Comment in

References

    1. Blumcke I, Spreafico R, Haaker G, et al. Histopathological findings in brain tissue obtained during epilepsy surgery. N Engl J Med. 2017;377:1648–1656. - PubMed
    1. Lee WS, Baldassari S, Stephenson SEM, Lockhart PJ, Baulac S, Leventer RJ. Cortical dysplasia and the mTOR pathway: How the study of human brain tissue has led to insights into epileptogenesis. Int J Mol Sci. 2022;23:1344. - PMC - PubMed
    1. Stevelink R, Sanders MWCB, Tuinman M, et al. Epilepsy surgery in patients with genetic refractory epilepsy: A systematic review. Eur J Paediatr Neurol. 2017;21:e17.
    1. Najm I, Lal D, Alonso Vanegas M, et al. The ILAE consensus classification of focal cortical dysplasia: An update proposed by an ad hoc task force of the ILAE diagnostic methods commission. Epilepsia. 2022;63:1899–1919. - PMC - PubMed
    1. Hu S, Knowlton RC, Watson BO, et al. Somatic depdc5 deletion recapitulates electroclinical features of human focal cortical dysplasia type IIA. Ann Neurol. 2018;84:140–146. - PMC - PubMed

Publication types

Substances