. 2023 Dec 26;42(12):113564.
doi: 10.1016/j.celrep.2023.113564. Epub 2023 Dec 14.

Heterogeneity and transcriptional drivers of triple-negative breast cancer

Affiliations

Heterogeneity and transcriptional drivers of triple-negative breast cancer

Bojana Jovanović et al. Cell Rep. .

Abstract

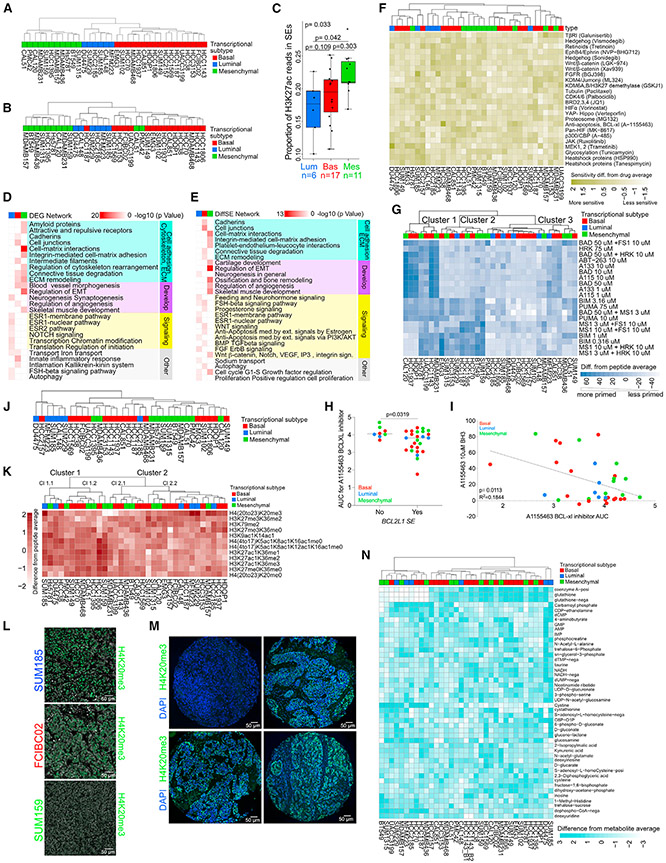
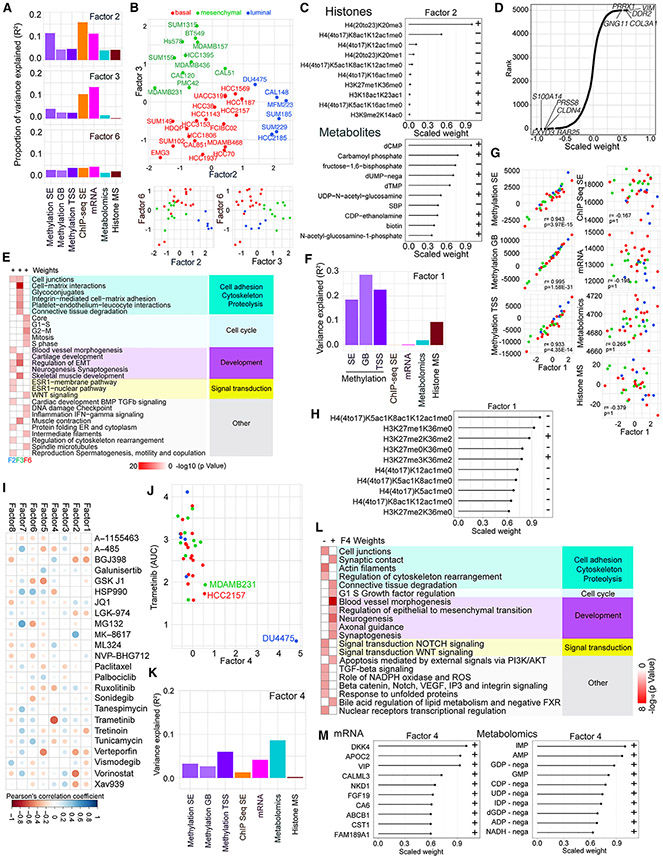
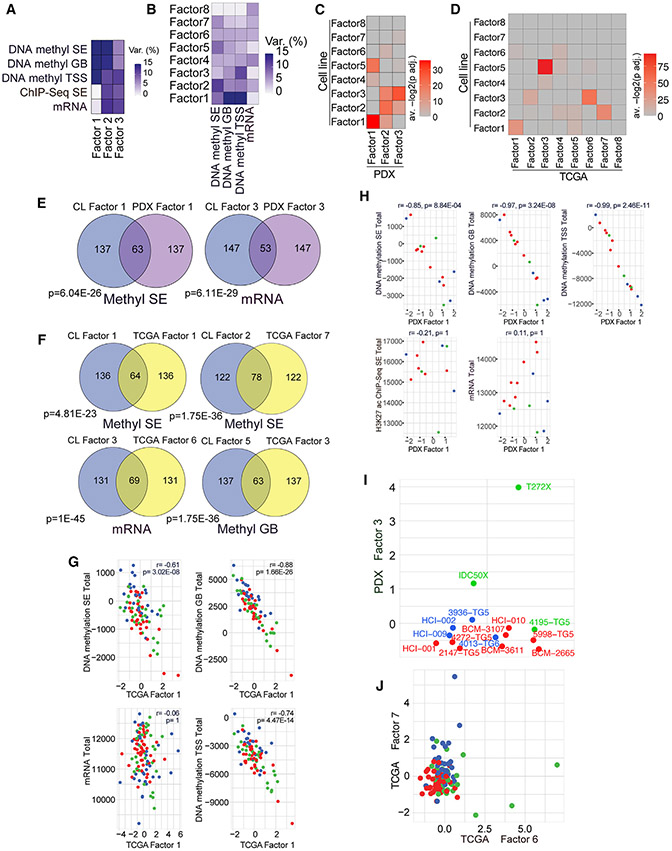
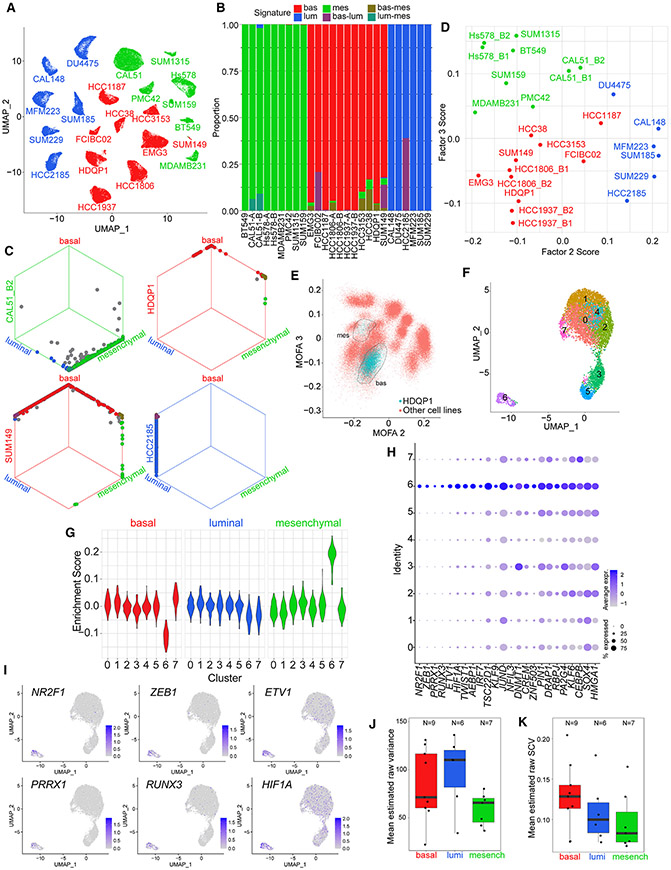
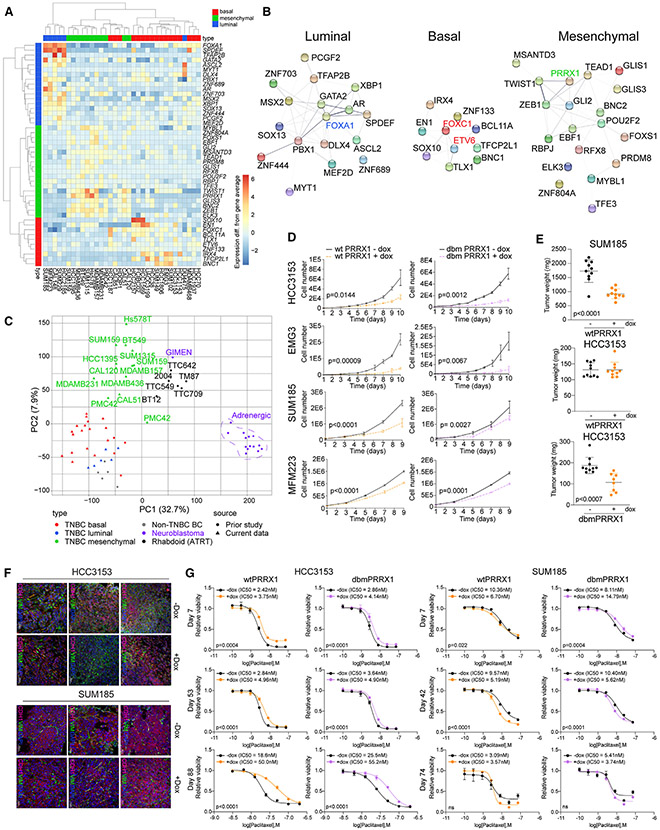
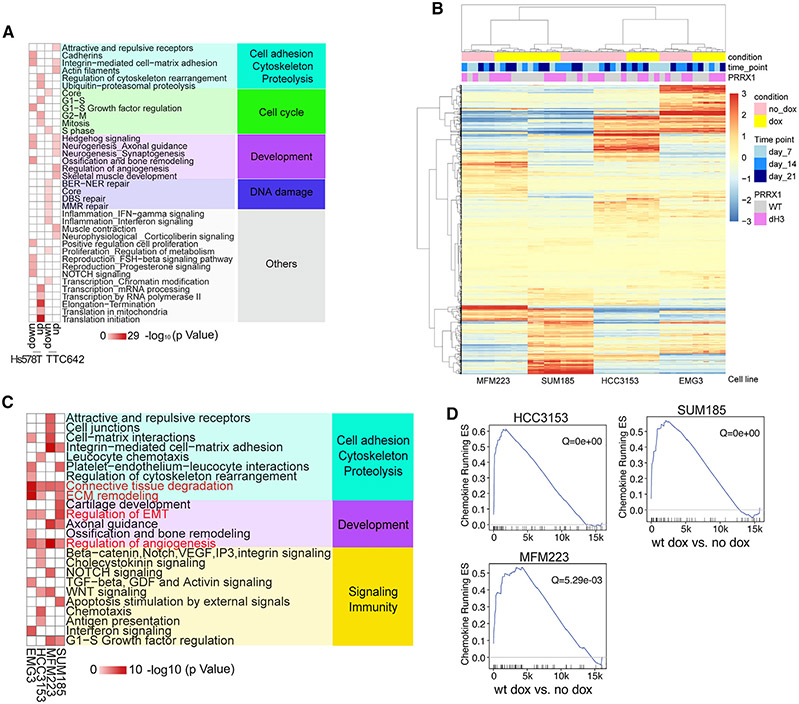
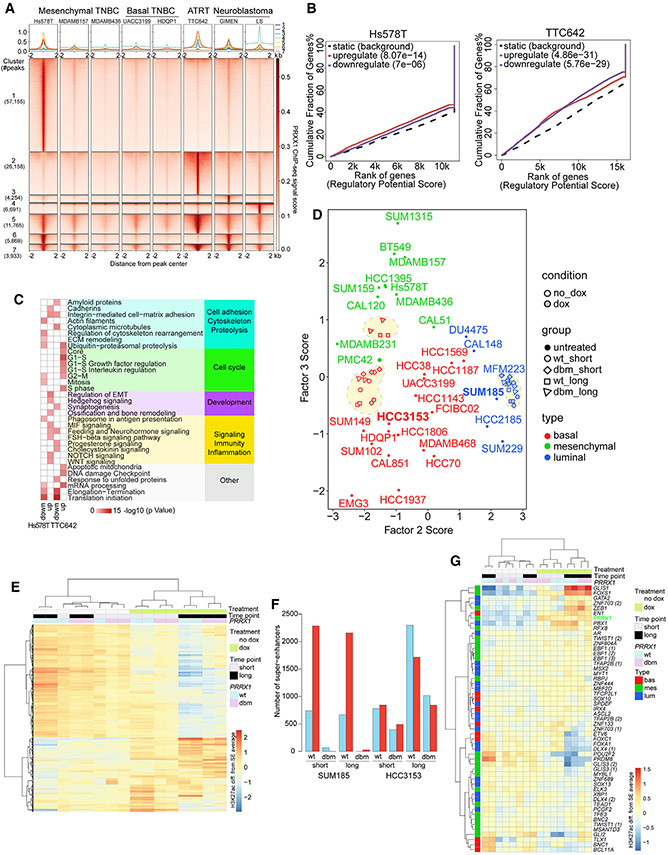
Triple-negative breast cancer (TNBC) is a heterogeneous disease with limited treatment options. To characterize TNBC heterogeneity, we defined transcriptional, epigenetic, and metabolic subtypes and subtype-driving super-enhancers and transcription factors by combining functional and molecular profiling with computational analyses. Single-cell RNA sequencing revealed relative homogeneity of the major transcriptional subtypes (luminal, basal, and mesenchymal) within samples. We found that mesenchymal TNBCs share features with mesenchymal neuroblastoma and rhabdoid tumors and that the PRRX1 transcription factor is a key driver of these tumors. PRRX1 is sufficient for inducing mesenchymal features in basal but not in luminal TNBC cells via reprogramming super-enhancer landscapes, but it is not required for mesenchymal state maintenance or for cellular viability. Our comprehensive, large-scale, multiplatform, multiomics study of both experimental and clinical TNBC is an important resource for the scientific and clinical research communities and opens venues for future investigation.

Keywords: CP: Cancer; triple-negative breast cancer; tumor heterogeneity.


Conflict of interest statement

Declaration of interests The following authors report current employment: Eli Lilly (B.J.), Shasqi, Inc (M.A.), GenieUsGenomics (A.T.), Morrison & Foerster LLP (A.G.), AstraZeneca (M.B.E. and L.E.S.), Odyssey Therapeutics (J.D.J.). K.P. serves on the Scientific Advisory Boards (SABs) of Novartis, Ideaya Biosciences, and Scorpion Therapeutics; holds equity options in Scorpion Therapeutics and Ideaya Biosciences; and receives sponsored research funding from Novartis, where she consults. F.M. is a cofounder of and has equity in Harbinger Health, has equity in Zephyr AI, and consults for Harbinger Health and Zephyr AI. She is on the board of directors of Exscientia Plc. She declares that none of these relationships are directly or indirectly related to the content of this manuscript. P.S. is a consultant for Novartis, Genovis, Guidepoint, The Planning Shop, ORIC Pharmaceuticals, Cedilla Therapeutics, Syros Pharmaceuticals, Blueprint Medicines, Curie Bio, Differentiated Therapeutics, Excientia, Ligature Therapeutics, Merck, Redesign Science, Sibylla Biotech, and Exo Therapeutics; he receives research funding from Novartis. A.G.L. serves on the SAB of Flash Therapeutics, Zentalis Pharmaceuticals, and Trueline Therapeutics and consults for AbbVie. M.B. receives research funding from Novartis, where he also serves on the SAB and acts as a consultant. He is a member of the SAB for Kronos Bio and GV20 Therapeutics and holds equity in both companies. He also serves on the SAB for FibroGen and is a consultant for Belharra Therapeutics. K.W.W. serves on the SAB of TScan Therapeutics, SQZ Biotech, Bisou Bioscience Company, DEM BioPharma, and Nextechinvest; receives sponsored research funding from Novartis; and is a co-founder, stockholder, and advisory board member of Immunitas Therapeutics. D.D. receives research support from Canon, Inc. H.W.L. receives research funding from Novartis.

Figures

Figure 1.
Figure 1.. Comprehensive molecular profiles of TNBC
(A) Dendrogram depicting clustering of 34 TNBC cell lines based on the expression of the top 20% most variable genes. Subtype identifiers were assigned based on genes differentially expressed between the three major clusters. See also Table S1. (B) Dendrogram depicting clustering of 33 TNBC cell lines based on H3K27ac signal in the top 20% most variable SEs. (C) Boxplots showing the proportion of H3K27ac reads in SEs for cell lines in each TNBC subtype. Overall p value from Kruskal-Wallis test. Pairwise p values from Dunn’s test, adjusted using Holm’s method. Center lines shows medians. Hinges show interquartile ranges. Upper whiskers extend from the upper hinge to the highest value that is no further than 1.5 times the IQR from the hinge. Lower whiskerslate extends from the lower hinge to the lowest value that is nor further than 1.5 times the IQR from the hinge. (D) Metacore networks enriched in differentially expressed genes (DEGs) among the three TNBC transcriptional subtypes. See also Table S2. (E) Metacore networks enriched in TNBC transcriptional subtype-specific differential SEs. See also Table S2. (F) Heatmap demonstrating TNBC cell line sensitivity to SMIs. (G) Heatmap showing clustering of 34 TNBC cell lines based on the top 50% most variable BH3 peptides. Values shown are abundance differences from peptide average. (H) Plot depicting sensitivity to the A1155463 BCL-xl inhibitor in TNBC lines where BCL2L1 is an SE or not. Error bars represent mean ± SEM; p value, Mann-Whitney U test. (I) Plot depicting the correlation between BH3 profiling and drug area under the viability curve for treatment response (AUC) for the A1155463 BCL-xl inhibitor in TNBC cell lines (p = 0.0113, R2 = 0.1844, Pearson correlation). (J) Dendrogram depicting clustering of 34 TNBC cell lines based on DNA methylation levels in the top 20% most variable SEs. (K) Heatmap showing clustering of 34 TNBC cell lines based on the top 20% most variable histone marks determined by mass spectrometry. Average difference in mean log-normalized H3K27ac, H3K27ac1K36me1, H3K27ac1K36me2, and H3K27ac1K36me3 values from cell line average = 0.032 (luminal), −0.17 (basal), and 0.25 (mesenchymal). Average difference in log-normalized H4 (20–23) K20me3 value from cell line average = 1.48 (luminal), −0.063 (basal), −0.71 (mesenchymal). (L) Immunofluorescence for H4K20me3 in SUM185 (luminal), FCIBC02 (basal), and SUM159 (mesenchymal) cell lines. Scale bars, 50 μm. (M) Representative histone H4K20me3 immunofluorescence staining of four TNBC patient samples from the tissue microarray (TMA). Scale bars, 50 μm. (N) Heatmap showing clustering of 34 TNBC cell lines based on the levels of the top 20% most variable metabolites. Values shown are expression differences from metabolite average. Values are capped at ±3 for the purpose of visualization. See also Figure S1 and Tables S1-S17. Blue, red, and green colors mark luminal, basal, and mesenchymal TNBC transcriptional subtypes in all figures.
Figure 2.
Figure 2.. Integrated analysis of the genomics data using multiomics factor analysis (MOFA)
(A) Bar graph of the proportion of variance explained in each dataset by F2, F3, and F6. (B) Scatterplots depicting F2, F3, and F6 values across TNBC cell lines. (C) Scaled F2 weights for the histone mark combinations with the largest absolute weights for this factor and scaled F2 weights for the metabolites with the largest absolute weights for this factor. Scaled weights for each factor in each dataset are derived from the weights for that factor in that dataset by linearly rescaling the values to lie between −1 and 1. (D) Scaled mRNA weights for F3, with the top five negatively and positively weighted features labeled. Scaled weights for each factor in each dataset are derived from the weights for that factor in that dataset by linearly rescaling the values to lie between −1 and 1. (E) Metacore networks for F2, F3, and F6 positive mRNA weights. See also Table S2. (F) Bar graph showing the variance explained by F1 within each dataset. (G) Scatterplots of total signal in each dataset against F1 scores; p values, Holm-adjusted Pearson correlation test. (H) Scaled F1 weights for the histone mark combinations with the largest absolute weights for this factor. Scaled weights for each factor in each dataset are derived from the weights for that factor in that dataset by linearly rescaling the values to lie between −1 and 1. (I) Correlations between MOFA F1–F8 and SMI features. Dot colors and sizes represent Pearson’s correlation coefficient values for the indicated pairs of drugs and factors. (J) Scatterplot showing F4 scores and trametinib AUC across TNBC cell lines. (K) Bar graph showing variance explained for F4 across each dataset. (L) Metacore networks for F4 positive and negative mRNA weights. See also Table S2. (M) Scaled F4 weights for the mRNA and metabolomics features with the largest absolute weights. Scaled weights for each factor in each dataset are derived from the weights for that factor in that dataset by linearly rescaling the values to lie between −1 and 1. See also Figure S2 and Table S4.
Figure 3.
Figure 3.. Validation of MOFA factors in PDXs and clinical samples
(A) Variance explained by each PDX MOFA factor in the PDX data. Methyl SE: n = 15,p = 2,835; methyl GB: n = 15,p = 4,992; methyl TSS: n = 15,p = 4,996; ChIP-seq SE: n = 12,p = 5,120; mRNA: n = 15, p = 5,000. (B) Variance explained in each dataset by each TCGA TNBC MOFA factor. Methyl SE: n = 83, p = 2,462; methyl GB: n = 83, p = 4,463; methyl TSS: n = 83, p = 4,704; mRNA: n = 115,p = 4,736.. (C and D) Heatmaps showing overlaps between top features by absolute weight for each cell line MOFA factor and top features by absolute weight for each of the MOFA factors derived from PDX (C) and TCGA TNBC (D) samples. Cell colors represent the average of the negative log2-transformed adjusted hypergeometric test p values for tests corresponding to the pair of factors indicated by the row and column; p value adjustment by Holm’s method. Tests for overlap were performed for all datasets where the cell line factor explained at least 2% of variance in the original model. Rows indicate cell line factors, and columns indicate validation model factors. (E) Venn diagrams of overlaps between the top 200 features by absolute weight for the indicated cell line and PDX factors in the indicated dataset. Holm-adjusted hypergeometric test p values are shown. (F) Venn diagrams of overlaps between the top 200 features by absolute weight for the indicated cell line and TCGA factors in the indicated dataset. Holm-adjusted hypergeometric test p values are shown. (G) Scatterplots of total signal in each dataset plotted against TCGA F1 scores. Holm-adjusted Pearson correlation test p values are shown. (H) Scatterplots of total signal in each dataset plotted against PDX F1 scores. Holm-adjusted Pearson correlation test p values are shown. (I) Bee swarm plot showing PDX F3 scores across PDX samples. Samples are colored by their assigned TNBC subtype based on the cell-line-defined RNA-seq signatures. Points are jittered along the horizontal axis for the purpose of visualization. (J) Plot showing TCGA TNBC F6 and F7 scores for all TCGA TNBC samples, colored according to assigned TNBC subtype based on cell-line-derived signatures. See also Figure S2 and Table S5.
Figure 4.
Figure 4.. Intra-tumor heterogeneity assessment by single-cell analyses
(A) UMAP visualization of scRNA-seq gene expression data from TNBC cell lines. Single cells from each cell line are colored according to assigned subtype from bulk RNA-seq. (B) Bar plot showing significantly enriched TNBC transcriptional subtype signatures (bootstrap p <0.05) in single cells from samples belonging to each TNBC subtype. (C) Hexagonal plots showing significantly enriched TNBC transcriptional subtype signatures for all analyzed single cells from four cell line samples. Each point represents a single cell. Cells are positioned along each axis according to bootstrap classification score (1 minus bootstrap p value) for the indicated cell identity. Cells significantly enriched for each signature are shown along the corresponding edges of the plot. Cell colors represent significantly enriched signatures; cells with no significant enrichments are shown in gray. (D) Average MOFA F2 and F3 scores of single cells from each sample. (E) Inferred MOFA F2 and MOFA F3 scores for HDQP1 single cells (blue) and all other single cells (red). Circled regions show two apparent HDQP1 subclusters. (F) UMAP visualization of HDQP1 cell line scRNA-seq data. (G) Enrichment scores of TNBC subtype signatures in single cells of HDQP1 by cluster. Scores measure the difference in TNBC subtype signature expression compared with average expression across HDQP1 cells after correcting for the differences observed for random size-match signatures. (H) Cluster-specific expression of TFs differentially expressed in HDQP1 cluster 6. (I) UMAP visualization of HDQP1 single cells, colored by expression of the six mostly strongly overexpressed TFs in cluster 6. (J) Boxplot showing mean estimated raw variance across highly expressed genes in single-cell samples assigned to each subtype. For cell lines with two replicate samples, only the higher-depth replicate is shown. Bottom and top hinges of inset box plots show the 25th and 75th percentiles. Upper whiskers extend from the upper hinge to the highest value that is no further than 1.5 times the interquartile range (IQR) from the hinge. Lower whiskers extend from the lower hinge to the lowest value no further than 1.5 times the IQR from the hinge. (K) Boxplot showing mean estimated raw SCV across highly expressed genes in single-cell samples assigned to each subtype. For cell lines with two replicate samples, only the higher-depth replicate is shown. Bottom and top hinges of inset box plots show the 25th and 75th percentiles. Upper whiskers extend from the upper hinge to the highest value that is no further than 1.5 times the interquartile range (IQR) from the hinge. Lower whiskers extend from the lower hinge to the lowest value no further than 1.5 times the IQR from the hinge. See also Figure S3.
Figure 5.
Figure 5.. PRRX1 is a mesenchymal subtype-specific TF
(A) Heatmap of mRNA expression of TNBC subtype-specific TFs. Differences in log-normalized expression from the gene average are shown for each gene. (B) STRING-based protein-protein interaction network for TNBC subtype-specific TFs. Selected factors discussed in the text are highlighted for emphasis. (C) Scatterplot of cell line RNA-seq data by principal components 1 and 2. The percentages of variance explained by principal components 1 and 2 are shown in brackets. (D) Viable cell numbers after expression of dox-inducible WT or dbm PRRX1 in the indicated cell lines. Error bars represent mean ± SEM, n = 3 replicates, p values by two-tailed unpaired t test. (E) Plot depicting weights of xenografts derived from SUM185 and HCC3153 cell lines expressing WT or dbm PRRX1 from mice with and without dox in the diet. Error bars represent mean ± SEM, n = 10 tumors, p values by two-tailed unpaired t test. (F) E-cadherin and vimentin immunofluorescence staining of xenografts derived from SUM185 and HCC3153 cell lines expressing WT PRRX1 from mice with and without dox in the diet. Scale bars, 50 μm and 100 μm. Multiple representative images are shown from different xenografts to illustrate intra-tumor heterogeneity. (G) Plots depicting viable cell numbers of HCC3153 and SUM185 cells following paclitaxel treatment and induction of WT or dbm PRRX1 expression by dox for the indicated days. Error bars represent mean ± SEM, p values by nonlinear fit test, n = 3 replicates. See also Figure S5.
Figure 6.
Figure 6.. PRRX1 transcriptional targets
(A) Metacore network analysis for Hs578T and TTC642 cell line DEGs following PRRX1 downregulation using TET-inducible shRNA at the 5-day time point. (B) Heatmap showing clustering of basal (EMG3 and HCC3153) and luminal (SUM185 and MFM223) cell lines overexpressing WT or dH3 mutant PRRX1 based on expression of the union of DEGs (lfc > 1) in each cell line following PRRX1 induction by doxycycline (dox). (C) Metacore network analyses for upregulated DEGs in basal (EMG3 and HCC3153) and luminal (MFM223 and SUM185) lines overexpressing WT PRRX1 (network gene list shown in Table S2; Figure 6C). For each cell line, dox-treated PRRX1-overexpressing samples (at three time points) were compared with untreated samples (corresponding to the same three time points) to identify DEGs. (D) GSEA of the chemokine gene set in WT cell lines overexpressing PRRX1.
Figure 7.
Figure 7.. PRRX1 genomic targets
(A) PRRX1 ChIP-seq peaks in the indicated cell lines from experiments with the larger number of peaks. All combinations represented in more than 1% of peaks are shown. (B) Cumulative fraction of genes up- or downregulated by PRRX1, plotted against rank of the regulatory potential score, from BETA of association between gene expression changes after PRRX1 downregulation and PRRX1 chromatin occupancy for Hs578T and TTC642. (C) Metacore network analysis for Hs578T and TTC642 for PRRX1 ChIP-seq-based BETA targets representing enrichments for up- and downregulated PRRX1 targets (network gene list shown in Table S2; Figure 7C). (D) Scatterplot depicting MOFA F2 and F3 scores for each sample, calculated based on SE H3K27ac signal. Red- and blue-outlined shapes within dotted lines represent HCC3153 and SUM185 samples from the PRRX1 overexpression H3K27ac experiment, respectively. (E) Heatmap showing clustering of HCC3153 PRRX1-overexpressing samples and corresponding controls based on H3K27ac signal in the top 20% most variable SEs. (F) Bar plot showing counts of differentially acetylated SE regions under WT and dbm PRRX1 overexpression in SUM185 and HCC3153 at short and long time points. (G) Heatmap of SE H3K27ac signal for TNBC subtype-specific TFs in HCC3153 PRRX1 overexpression samples and corresponding controls.

Similar articles

Cited by

References

    1. Garrido-Castro AC, Lin NU, and Polyak K (2019). Insights into Molecular Classifications of Triple-Negative Breast Cancer: Improving Patient Selection for Treatment. Cancer Discov. 9, 176–198. - PMC - PubMed
    1. Lehmann BD, Bauer JA, Chen X, Sanders ME, Chakravarthy AB, Shyr Y, and Pietenpol JA (2011). Identification of human triple-negative breast cancer subtypes and preclinical models for selection of targeted therapies. J. Clin. Invest 121, 2750–2767. - PMC - PubMed
    1. Lehmann BD, Jovanović B, Chen X, Estrada MV, Johnson KN, Shyr Y, Moses HL, Sanders ME, and Pietenpol JA (2016). Refinement of Triple-Negative Breast Cancer Molecular Subtypes: Implications for Neoadjuvant Chemotherapy Selection. PLoS One 11, e0157368. - PMC - PubMed
    1. Lehmann BD, Colaprico A, Silva TC, Chen J, An H, Ban Y, Huang H, Wang L, James JL, Balko JM, et al. (2021). Multi-omics analysis identifies therapeutic vulnerabilities in triple-negative breast cancer subtypes. Nat. Commun 12, 6276. - PMC - PubMed
    1. Su Y, Subedee A, Bloushtain-Qimron N, Savova V, Krzystanek M, Li L, Marusyk A, Tabassum DP, Zak A, Flacker MJ, et al. (2015). Somatic Cell Fusions Reveal Extensive Heterogeneity in Basal-like Breast Cancer. Cell Rep. 11, 1549–1563. - PubMed

Publication types

MeSH terms