. 2023 Dec 19;120(51):e2300474120.
doi: 10.1073/pnas.2300474120. Epub 2023 Dec 15.

Pleural macrophages translocate to the lung during infection to promote improved influenza outcomes

Affiliations

Pleural macrophages translocate to the lung during infection to promote improved influenza outcomes

James P Stumpff 2nd et al. Proc Natl Acad Sci U S A. .

Abstract

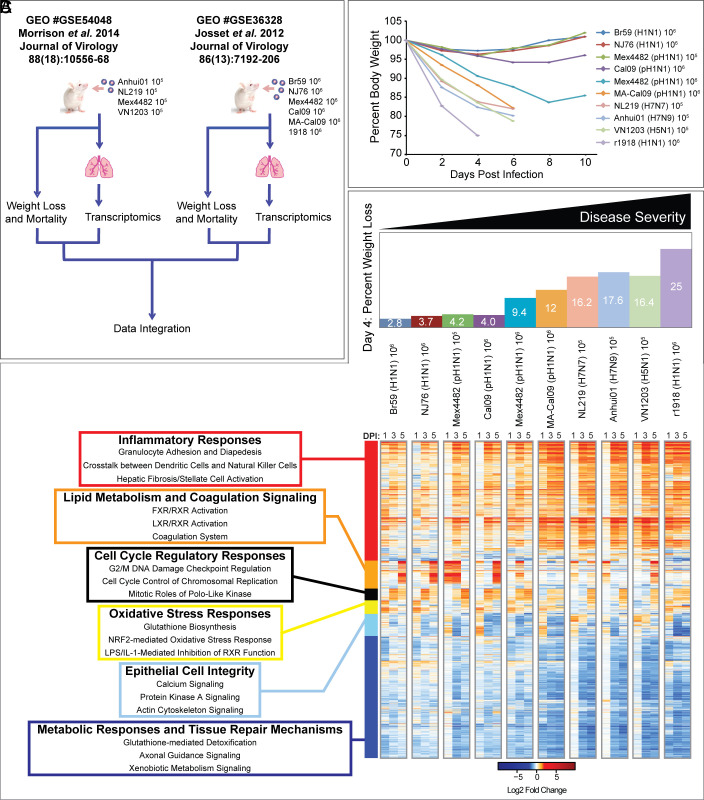
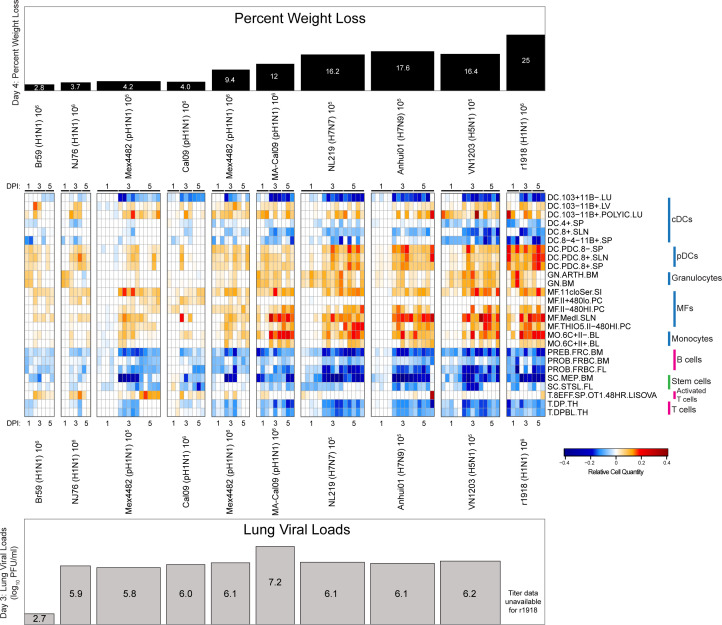
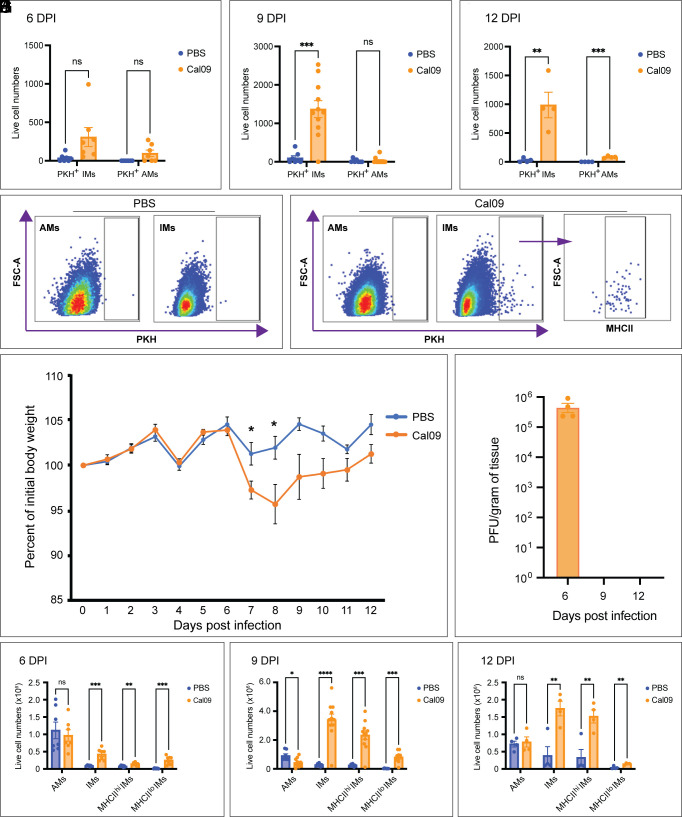
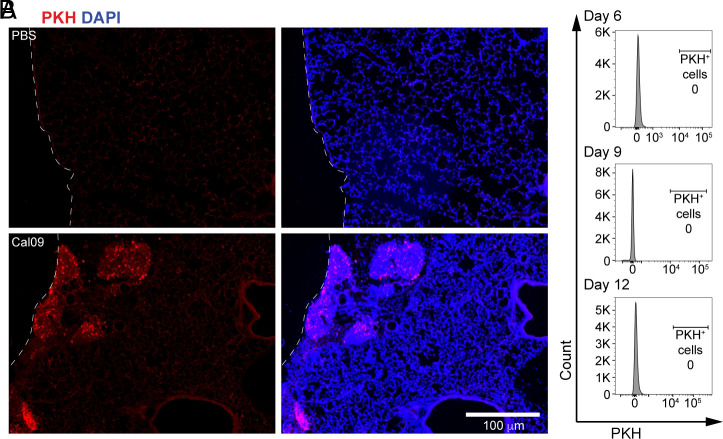
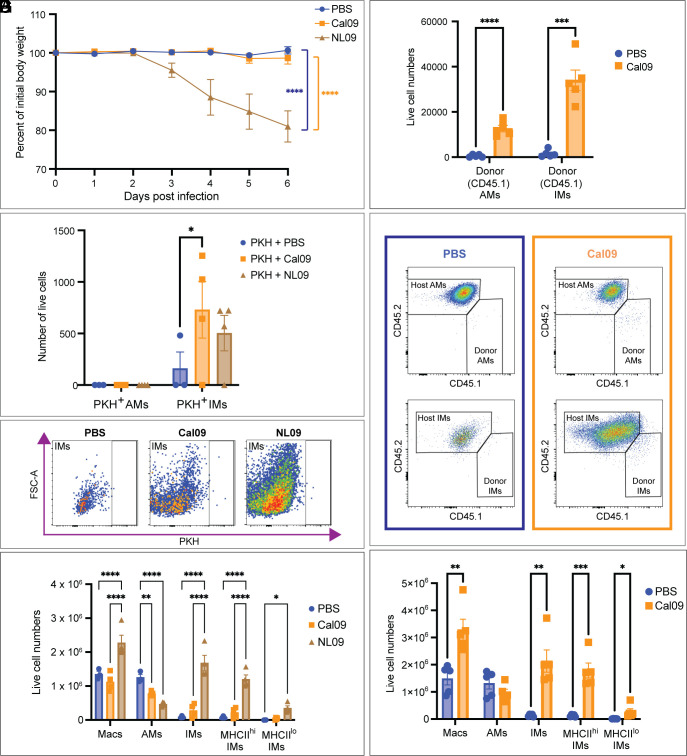
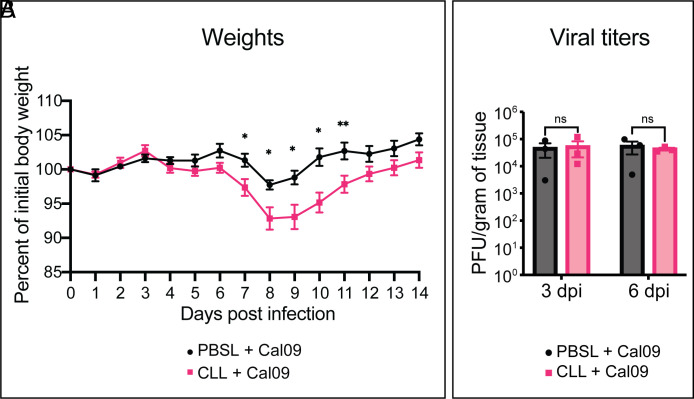
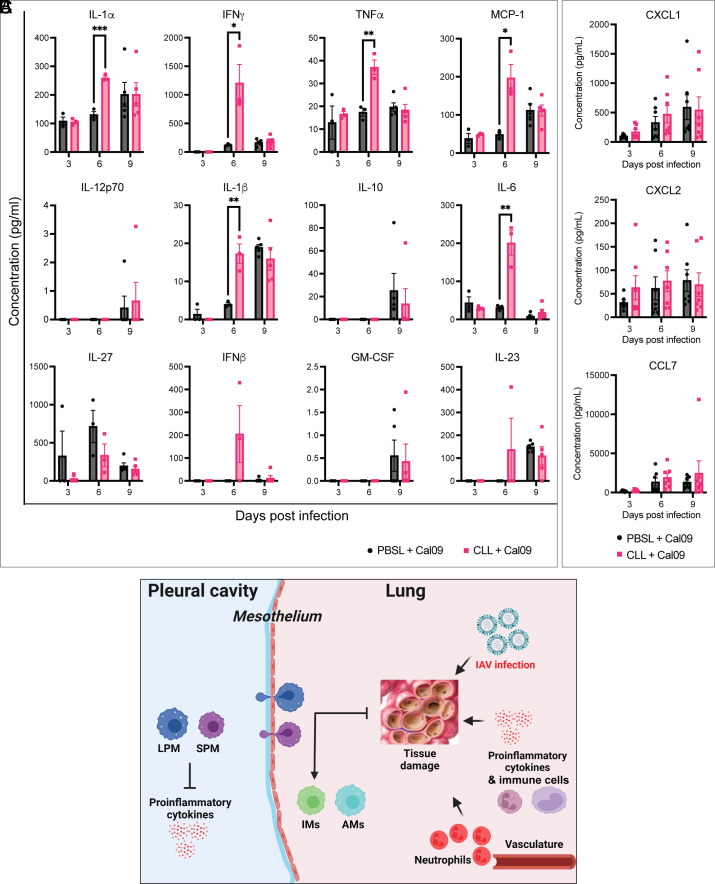
Seasonal influenza results in 3 to 5 million cases of severe disease and 250,000 to 500,000 deaths annually. Macrophages have been implicated in both the resolution and progression of the disease, but the drivers of these outcomes are poorly understood. We probed mouse lung transcriptomic datasets using the Digital Cell Quantifier algorithm to predict immune cell subsets that correlated with mild or severe influenza A virus (IAV) infection outcomes. We identified a unique lung macrophage population that transcriptionally resembled small serosal cavity macrophages and whose presence correlated with mild disease. Until now, the study of serosal macrophage translocation in the context of viral infections has been neglected. Here, we show that pleural macrophages (PMs) migrate from the pleural cavity to the lung after infection with IAV. We found that the depletion of PMs increased morbidity and pulmonary inflammation. There were increased proinflammatory cytokines in the pleural cavity and an influx of neutrophils within the lung. Our results show that PMs are recruited to the lung during IAV infection and contribute to recovery from influenza. This study expands our knowledge of PM plasticity and identifies a source of lung macrophages independent of monocyte recruitment and local proliferation.

Keywords: influenza; macrophages; pleural cavity; tissue deconvolution; transcriptomics.


Conflict of interest statement

Competing interests statement:The authors declare no competing interest.

Figures

Fig. 1.
Fig. 1.
Influenza disease outcomes are distinguished by host response differences in the expression of inflammatory, metabolic, cell cycle, and tissue repair genes. (A) Schematic showing the integration of BALB/C mouse data from GSE54048 and GSE36328. Experimental data were combined to produce (B) a combined weight loss dataset and a combined transcriptional dataset. (C) Hierarchical clustering of differential gene expression in murine lungs infected with influenza virus. Biweight midcorrelation clustering of 6,012 genes that were found to be differentially expressed in any one condition (infection and time). Genes shown in red were up-regulated and genes shown in blue were down-regulated relative to uninfected lungs. Weight loss data shown in (B) and (C) were obtained from Morrison et al. (17) and Josset et al. (26).
Fig. 2.
Fig. 2.
DCQ identified immune cell subsets that predict disease severity or recovery across independent experiments. We surveyed the in vivo dynamics across time and viral strains using the DCQ algorithm. Linear regression models revealed distinct immune cell populations predicted to drive disease morbidity as defined by weight loss following influenza virus infection. The heatmap represents the relative quantity of cell types with significant relationships (P < 0.05) between that cell type on at least 1 d to the weights on at least 1 d after filtering for observations where data for at least eight samples were available. Weight loss and viral load data were obtained from Morrison et al. (17) and Josset et al. (26).
Fig. 3.
Fig. 3.
Influenza virus infection promotes the recruitment of pleural macrophages to the lung. BALB/c mice were intrapleurally injected with PKH26PCL (PKH) dye 1 d before they were intranasally infected with 102 PFU Cal09 virus or mock-infected with PBS as a control. (AC) Quantification of live cell numbers of PKH+ AMs and IMs in Cal09- or mock-infected mice. Data are from two independent experiments. (D) Representative flow plots of PBS control mice. Data are representative of two independent experiments. (E) Representative flow plots of Cal09-infected mice. Data are representative of two independent experiments. (F) Weight loss curve of Cal09-infected versus control mice. Data are from two independent experiments. (G) Virus titers from lungs of mice in (F). (HJ) Quantification of live cell numbers of AMs and IMs in Cal09- or mock-infected mice. Data are from two independent experiments. Data shown as mean ± SEM (*P < 0.05, **P < 0.01, ***P < 0.001, Student’s t test). AM = alveolar macrophage (MerTK+CD64+SiglecF+CD11b); IM = interstitial macrophage (MerTK+CD64+CD11b+SiglecF).
Fig. 4.
Fig. 4.
PMs localize near the mesothelium. (A) Representative fluorescent images of BALB/c naive and Cal09-infected lungs harvested 9 d post infection. PMs were labeled in vivo with PKH dye (red) and counterstained with DAPI (blue). The mesothelium is outlined by the white dotted line. Data are representative of three independent experiments (n = 8–13 per group). (B) Flow cytometry of blood harvested on days 6, 9, and 12 post infection from mice that were intrapleurally injected with PKH26PCL dye then infected with Cal09. Data are representative of two independent experiments.
Fig. 5.
Fig. 5.
PM migration is not mouse strain specific and PM accumulation occurs predominantly during mild infection. C57BL/6 mice received an intrapleural injection of PKH or PBS 1 d before infection with 102 PFU of Cal09 or NL09 and were sacrificed on day 6 post infection (AD). C57BL/6 received an intrapleural injection of donor CD45.1 (C57BL/6 J- Ptprcem6LutzyJ) PMs 1 d prior to infection with 102 PFU of Cal09 and were sacrificed on day 9 post infection (Right, EG). (A) Weight loss was tracked over 6 d post infection (n = 3–4 per group). (B) Quantification of live cell numbers of PKH+ AMs and IMs in Cal09-, NL09-, or mock-infected mice. (C) Representative flow plots of PBS-, Cal09-, or NL09-infected mice. (D) Quantification of live cell numbers of macrophages, AM, and IMs in PBS-, Cal09-, or NL09-infected mice. (E) Quantification of live cell numbers of CD45.1+ AMs and IMs. (F) Representative flow plots of PBS- or Cal09-infected mice. (G) Quantification of live cell numbers of macrophages, AMs, and IMs in PBS-treated or Cal09-infected mice. Data shown as mean ± SEM (*P < 0.05, **P < 0.01, ***P < 0.001, ****P < 0.0001, One-way ANOVA or Student’s t test). Mac (MerTK+CD64+) = macrophage; AM = alveolar macrophage (MerTK+CD64+SiglecF+CD11b); IM = interstitial macrophage (MerTK+CD64+CD11b+SiglecF).
Fig. 6.
Fig. 6.
PM depletion increases morbidity in IAV-infected mice. BALB/c mice received an intrapleural injection of CLL or PBSL 1 d before infection with 102 PFU of Cal09; weight loss was tracked and lungs were isolated for viral titers. (A) Weight loss was tracked for 14 d after Cal09-infection in both CLL- and PBSL-injected groups. Data are from two independent experiments (n = 10 per group). (B) Lung virus titers from CLL- and PBSL-injected mice.
Fig. 7.
Fig. 7.
PM depletion leads to increased proinflammatory cytokine levels in the lungs on day 6 post infection. BALB/c mice received an intrapleural injection of CLL or PBSL 1 d before infection with 102 PFU of Cal09 and lungs were isolated on days 3, 6, and 9 post infection. (A) Cytokines from lung homogenates. (B) Neutrophil-attracting chemokines from lung homogenates. Data are from two independent experiments. (C) Proposed model of PM migration to the lung during IAV infection. Data shown as mean ± SEM (*P < 0.05, **P < 0.01, ***P < 0.001, ****P < 0.0001, Student’s t test)

Similar articles

Cited by

References

    1. Horimoto T., Kawaoka Y., Influenza: Lessons from past pandemics, warnings from current incidents. Nat. Rev. Microbiol. 3, 591–600 (2005). - PubMed
    1. Lamichhane P. P., Samarasinghe A. E., The role of innate leukocytes during influenza virus infection. J. Immunol. Res. 2019, 8028725 (2019). - PMC - PubMed
    1. Kash J. C., et al. , Genomic analysis of increased host immune and cell death responses induced by 1918 influenza virus. Nature 443, 578–581 (2006). - PMC - PubMed
    1. Perrone L. A., Plowden J. K., Garcia-Sastre A., Katz J. M., Tumpey T. M., H5N1 and 1918 pandemic influenza virus infection results in early and excessive infiltration of macrophages and neutrophils in the lungs of mice. PLoS Pathog. 4, e1000115 (2008). - PMC - PubMed
    1. Short K. R., Kroeze E. J., Fouchier R. A., Kuiken T., Pathogenesis of influenza-induced acute respiratory distress syndrome. Lancet Infect. Dis. 14, 57–69 (2014). - PubMed