. 2023 Dec 15;8(90):eabo5558.
doi: 10.1126/sciimmunol.abo5558. Epub 2023 Dec 15.

Acquisition of suppressive function by conventional T cells limits antitumor immunity upon Treg depletion

Affiliations

Acquisition of suppressive function by conventional T cells limits antitumor immunity upon Treg depletion

Sarah K Whiteside et al. Sci Immunol. .

Erratum in

Abstract

Regulatory T (Treg) cells contribute to immune homeostasis but suppress immune responses to cancer. Strategies to disrupt Treg cell-mediated cancer immunosuppression have been met with limited clinical success, but the underlying mechanisms for treatment failure are poorly understood. By modeling Treg cell-targeted immunotherapy in mice, we find that CD4+ Foxp3- conventional T (Tconv) cells acquire suppressive function upon depletion of Foxp3+ Treg cells, limiting therapeutic efficacy. Foxp3- Tconv cells within tumors adopt a Treg cell-like transcriptional profile upon ablation of Treg cells and acquire the ability to suppress T cell activation and proliferation ex vivo. Suppressive activity is enriched among CD4+ Tconv cells marked by expression of C-C motif receptor 8 (CCR8), which are found in mouse and human tumors. Upon Treg cell depletion, CCR8+ Tconv cells undergo systemic and intratumoral activation and expansion, and mediate IL-10-dependent suppression of antitumor immunity. Consequently, conditional deletion of Il10 within T cells augments antitumor immunity upon Treg cell depletion in mice, and antibody blockade of IL-10 signaling synergizes with Treg cell depletion to overcome treatment resistance. These findings reveal a secondary layer of immunosuppression by Tconv cells released upon therapeutic Treg cell depletion and suggest that broader consideration of suppressive function within the T cell lineage is required for development of effective Treg cell-targeted therapies.


Conflict of interest statement

Competing interests

R.R. holds or has held paid consultancies with Lyell Immunopharma, Achilles Therapeutics and Enhanc3D Genomics; and is a principal investigator of research projects funded by AstraZeneca and F-star Therapeutics on unrelated topics that do not constitute competing interests. E.L. served as a consltant for BD Biosciences on a topic unrelated to this work. All other authors declare no competing interests.

Figures
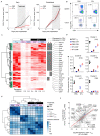
Figure 1
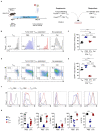
Figure 1. Treg cell ablation causes Tconv cells to acquire transcriptional features of Treg cells.
(A) Tumor growth of B16-F10 tumors subcutaneously implanted into Foxp3EGFP-DTR mice. Gray shading indicates time period over which PBS or DTx was administered (day 7-13 post-implantation, early disease; day 10-16 post-implantation, established). Dashed lines indicate individual mice. Solid line indicates average tumor area over time. Data representative of 4 individually repeated experiments, n > 5 **P < 0.01; two-tailed Mann–Whitney U-test. (B) Representative frequency of Foxp3+ Treg cells among total CD4+ T cells within spleens (top) or tumors (bottom) of Foxp3EGFP-DTR mice with established tumors administered PBS or DTx. (C) Heatmap showing the relative expression of transcripts upregulated in intratumoral Treg cells compared with CD4+ Tconv cells (q<0.05; FC>4) in the indicated T cell subsets isolated at day 18 after implantation of B16-F10 tumors in Foxp3EGFP-DTR animals administered PBS or DTx. Colors indicate expression normalized to row maxima. x-axis hierarchical clustering of intratumoral Treg cell-expressed transcripts identifies 5 clusters of genes with distinct expression patterns. Gray bars to right of heatmap indicate expression greater than a third of the expression of given transcripts in intratumoral Treg cells. (D) Average expression of genes within the 5 clusters identified in each T cell subset. (E) Heatmap showing pairwise Pearson distances between the global gene expression profiles of the indicated T cell subsets from B16-F10 tumor-bearing Foxp3EGFP-DTR animals administered PBS or DTx. (F) Scatterplot comparing the global differences in gene expression between intratumoral Treg cells and Tconv cells with transcriptional differences between CD4+ Tconv cells isolated from DTx versus PBS-treated animals. A highly significant correlation is observed indicating transcriptional convergence of intratumoral Treg cells with Tconv cells in absence of Treg cells. Data from 2-4 biological replicates isolated on independent days (C-F).
Figure 2
Figure 2. Treg cell ablation promotes induction of suppressive function by CD4+ Tconv cells.
(A) Experimental schema. B16-F10 cells were subcutaneously implanted into Foxp3EGFP-DTR CD45.2+ mice and administered PBS or DTx on day 7, 9, 11, and 13. Cells were harvested from tumors of PBS- and DTx-treated animals at day 16 post-implantation and used in suppression assays. (B and C) In vitro suppression assay. Proliferation of naïve CD45.1+ CD4+ Tconv responder (Tresp) cells 4 days cultured at a 4:1 ratio with indicated suppressor cell populations (Foxp3EGFP− Tconv cells from tumors of Treg-replete (PBS) or Treg-depleted (DTx) mice, or GFP+ Treg cells from tumors of Treg-replete mice). Representative histograms and replicate measurements of proliferation dye dilution at day 4 post-stimulation gated on CD45.1+ Tresp cells shown. Tresp cell proliferation in the absence of a suppressor cell population was used as a control. Suppressor cells were co-cultured with responder T (Tresp) cells at a ratio of 1:4, with 2.5×10⁴ suppressor CD4+ Treg or Tconv cells co-cultured with 1×10⁵ Tresp cells in the presence of 5.0×10⁴ antigen-presenting cells (APC). Data are representative of > 4 independently repeated experiments, n > 5 per group; ordinary one-way ANOVA, Tukey’s multiple comparisons. (D and E) Representative histograms and replicate measurements of CD44 expression by CD45.1+ Tresp cells incubated with indicated suppressor cell populations. (F-G) Representative flow cytometry and replicate measurements of the expression of the indicated proteins by intratumoral Treg cells and CD4+ Tconv cells isolated at day 16 after implantation of B16-F10 tumors in Foxp3EGFP-DTR mice treated with PBS or DTx. Data are representative of > 3 independently repeated experiments, n > 7 per group. ****P <0.0001; ns, not significant; one-way ANOVA Kruskal-Wallis, Dunn’s multiple comparisons test. Error bars show standard error of the mean (s.e.m.)
Figure 3
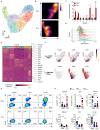
Figure 3. Treg cell ablation promotes the expansion of tumor-infiltrating CCR8+ Tconv cells.
(A) Uniform manifold approximation and projection (UMAP) of scRNA-Seq of TCRβ+ cells isolated at day 16 after implantation of B16-F10 tumors in Foxp3EGFP-DTR mice treated with PBS or DTx on days 7, 9, 11 and 13. (B) Density plots showing change in distribution of cells within tumors of Treg-replete (PBS) and Treg-depleted (DTx) animals. (C) Relative frequency of cells within each cluster normalized to their average ratio among PBS animals. N = 3 biological replicates per group. (D) Average enrichment of expression of the genes in Cluster D from Fig. 1C across scRNA-Seq clusters, (n=3, unpaired two-tailed Student’s t-test, *P < 0.05, **P < 0.01). (E) Heatmap showing the expression of differentially upregulated genes in each cluster identified. (F) UMAP plots showing expression of indicated genes within T cells of tumors from tumor-bearing PBS- or DTx-treated Foxp3EGFP-DTR animals. (G) Representative flow cytometry and (H) replicate measurements of total counts (top) and the frequency (bottom) of CCR8+ of CD4+ Tconv cells from spleens, draining lymph nodes (dLN) and tumors of B16-F10 tumor-bearing Foxp3EGFP-DTR mice treated with PBS or DTx. Data are representative of 3 independently repeated experiments (G and H). Numbers in gates show percentages. n > 10. one-way ANOVA Kruskal-Wallis, Dunn’s multiple comparisons test. **P <0.01, ***P < 0.001, ****P < 0.0001; Error bars show standard error of the mean (s.e.m.)
Figure 4
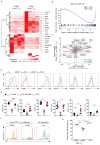
Figure 4. CCR8 marks highly suppressive Tconv cells.
(A) Heatmap showing the relative expression of differentially expressed genes between intratumoral CCR8+ and CCR8 CD4+ Tconv cells (q<0.05; |FC|>3) isolated at day 16 after subcutaneous implantation of B16-F10 tumors of Treg-depleted Foxp3EGFP-DTR animals treated with DTx at days 7, 9, 11 and 13. Data from 4 biological replicates isolated on the same day. (B) Gene-set enrichment analysis (GSEA) demonstrating a negative enrichment of genes upregulated in Foxp3 Tconv cells vs Foxp3+ Treg cells among CCR8+ Tconv cells compared with CCR8 Tconv cells isolated from tumors of DTx-treated Foxp3EGFP-DTR mice. (C) Scatterplot comparing global changes in gene expression between intratumoral Treg and Tconv cells with transcriptional differences between CCR8+ and CCR8 CD4+ Tconv cells. (D) Representative flow cytometry and (E) replicate measurements of the expression of the indicated proteins from intratumoral Treg cells and CCR8+ and CCR8 CD4+ Tconv cells from tumors of B16-F10 tumor-bearing Foxp3EGFP-DTR mice treated with PBS or DTx. Data are representative of 3 independently repeated experiments n > 4 one-way ANOVA Kruskal-Wallis, Dunn’s multiple comparisons test. *P < 0.05, **P <0.01, ***P < 0.001, ****P < 0.0001, ns, not significant. (F) Representative histograms and (G) replicate measurements of Tresp cells (naïve CD45.1+ CD4+ Tconv cells) incubated with intratumoral CD45.2+ TCRβ+ CD4+ GFP CCR8 or CD45.2+ TCRβ+ CD4+ GFP CCR8+ suppressor Tconv cells isolated at day 16 after implantation of B16-F10 tumors in Foxp3EGFP-DTR mice. Suppressor cells were incubated with responders at a ratio of 1:8, with 1.25×10⁴ suppressor CD4+ Tconv cells co-cultured with 1×10⁵ Tresp cells in the presence of 5×10⁴ APC. Cell proliferation of Tresp cells was analyzed after 4 days. Data are representative of 2 independently repeated experiments n > 3. ordinary one-way ANOVA, Tukey’s multiple comparisons. *P < 0.05; ***P < 0.001, ****P < 0.0001; Error bars show standard error of the mean (s.e.m.)
Figure 5
Figure 5. CCR8+ Tconv cells expressing high levels of CD25 are found within the tumors of NSCLC patients.
(A) CCR8 and CD25 expression among FOXP3 CD4+ T cells from representative samples from NSCLC patients (n=48). (B) Frequency of FOXP3 CCR8+ CD25bright cells among CD4+ T cells from the indicated patients’ samples. Lines indicate paired samples. (C) Correlation of the frequency of CD8+ T cells (of CD3+ T cells) with FOXP3 CCR8+ CD25bright cells (of CD4+ T cells) in tumors from patient samples. (D) UMAP analysis of concatenated CD4+ FOXP3 Tconv cells. Colors depict cell clusters identified by Phenograph (k=500). Separate UMAP plots of relative marker expression by concatenated CD4+ T cells from tumors. (E) Representative frequency and (F) replicate measurements of indicated markers from patient samples, box plots show median and interquartile range (IQR). Bars indicate standard deviation. Dots depict values of a single tumor sample. **P < 0.01, ***P < 0.001, ****P < 0.0001; two-tailed Mann–Whitney U-test.
Figure 6
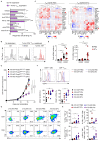
Figure 6. IL-10 production by CD4+ Tconv cells limits anti-tumor immunity upon Treg cell depletion.
(A) Screen to identify mechanisms of suppression by CD4+ Tconv cells from tumors of Treg-depleted animals. Proliferation of CTV-labeled naïve splenic CD4+ Tconv responder cells (Tresp) cultured alone or at a ratio of 8:1 with CD4+ Foxp3EGFP− Tconv suppressor cells (Tsupp) isolated at day 16 from B16-F10 tumors of DTx-treated Foxp3EGFP-DTR animals. Cells were cultured alone (gray) or with suppressors (purple) and with indicated reagents. AG, aminoglutethimide. CD45.2+ GFP Tconv suppressor cells were co-cultured with 1.25×10⁴ suppressor CD4+ Tconv cells in the presence of 5.0×10⁴ antigen-presenting cells (APC). Data are representative of 2 independently repeated experiments n > 3. P values show significance of difference between no suppressor and suppressor (Student t test) and are Bonferroni corrected. (B) Representative frequency of dividing Tresp cells incubated with tumor CD4+ GFP Tconv cells in the presence of anti-IL-10R antibodies or vehicle. Tresp cells without tumor Tconv cells were used as a control. (C) Co-correlation between the expression of indicated genes within single cell gene expression profiles of T cells from tumors of PBS- or DTx-treated B16 tumor-bearing Foxp3EGFP-DTR animals. Pearson correlation co-efficient values are indicated by color scale and genes are hierarchically clustered to identify clusters of co-expressed transcripts within T cell populations. scRNA-Seq data are representative of 3 biological replicates per group. (D) Measurement of Ccr8 and Il10 mRNA expression within CCR8 and CCR8+ Tconv cells from PBS- and DTx-treated animals. Data representative of 3-4 biological replicates per group. ordinary one-way ANOVA, Tukey’s multiple comparisons. ns, not significant. (E) Tumor area of heterotopic B16-F10 melanoma tumors at indicated time-points following implantation into Il10flox/flox Cd4Cre Foxp3EGFP-DTR or Il10+/+ Cd4Cre Foxp3EGFP-DTR control mice administered DTx or PBS from day 10-16 post-implantation. Data are representative of 2 independently repeated experiments, n > 7. ordinary one-way ANOVA, Tukey’s multiple comparisons. (F) Representative histograms (top) and replicate measurements (bottom) of the frequency of CD8+ CD44+ T cells and Foxp3 CD4+ CD44+ Tconv cells from tumors of animals within indicated treatment groups. (G) Representative frequency and (H) replicate measurements of the frequency (top) and total counts (bottom) of CD8+ IFN-γ+ TNF+ T cells within tumors. Data are representative of 2 independently repeated experiments, n > 4, one-way ANOVA, Kruskal-Wallis, Dunn’s multiple comparisons test. *P < 0.05; **P < 0.01; ***P < 0.001, ****P < 0.0001. Error bars show standard error of the mean (s.e.m.)
Figure 7
Figure 7. Blockade of IL-10 signaling synergizes with Treg cell-depletion to drive potent anti-tumor immune responses.
(A) Tumor area of B16-F10 melanoma tumors at indicated time-points following implantation into Foxp3EGFP-DTR animals administered indicated combinations of DTx and anti-IL-10R or control reagents from days 10-16 after tumor implantation. Data are representative of 2 independently repeated experiments. n > 10, ordinary one-way ANOVA, Tukey’s multiple comparisons. *P < 0.05 **P < 0.01; (B) Representative frequency and (C) replicate measurements of the frequency and total counts of CD8+ IFN-γ+ TNF+ T cells from tumors. n > 3, one-way ANOVA, Kruskal-Wallis, Dunn’s multiple comparisons test., *P < 0.05. (D) Representative frequency and (E) replicate measurements of the frequency and total counts of Foxp3 CD4+ IFN-γ+ TNF+ T cells from tumors. Data from > 2 independent biological replicates. n > 3, Kruskal-Wallis, Dunn’s multiple comparisons test., *P < 0.05; Error bars show standard error of the mean (s.e.m.)

References

    1. Hodi FS, O’Day SJ, McDermott DF, Weber RW, Sosman JA, Haanen JB, Gonzalez R, Robert C, Schadendorf D, Hassel JC, Akerley W, et al. Improved survival with ipilimumab in patients with metastatic melanoma. N Engl J Med. 2010;363:711–723. - PMC - PubMed
    1. Robert C, Thomas L, Bondarenko I, O’Day S, Weber J, Garbe C, Lebbe C, Baurain JF, Testori A, Grob JJ, Davidson N, et al. Ipilimumab plus dacarbazine for previously untreated metastatic melanoma. N Engl J Med. 2011;364:2517–2526. - PubMed
    1. Gubin MM, Zhang X, Schuster H, Caron E, Ward JP, Noguchi T, Ivanova Y, Hundal J, Arthur CD, Krebber WJ, Mulder GE, et al. Checkpoint blockade cancer immunotherapy targets tumour-specific mutant antigens. Nature. 2014;515:577–581. - PMC - PubMed
    1. Larkin J, Lao CD, Urba WJ, McDermott DF, Horak C, Jiang J, Wolchok JD. Efficacy and Safety of Nivolumab in Patients With BRAF V600 Mutant and BRAF Wild-Type Advanced Melanoma: A Pooled Analysis of 4 Clinical Trials. JAMA Oncol. 2015;1:433–440. - PubMed
    1. Larkin J, Chiarion-Sileni V, Gonzalez R, Grob JJ, Cowey CL, Lao CD, Schadendorf D, Dummer R, Smylie M, Rutkowski P, Ferrucci PF, et al. Combined Nivolumab and Ipilimumab or Monotherapy in Untreated Melanoma. N Engl J Med. 2015;373:23–34. - PMC - PubMed

Publication types

Substances