. 2023 Dec 15;8(90):eadf9988.
doi: 10.1126/sciimmunol.adf9988. Epub 2023 Dec 15.

Early human lung immune cell development and its role in epithelial cell fate

Affiliations

Early human lung immune cell development and its role in epithelial cell fate

Josephine L Barnes et al. Sci Immunol. .

Abstract

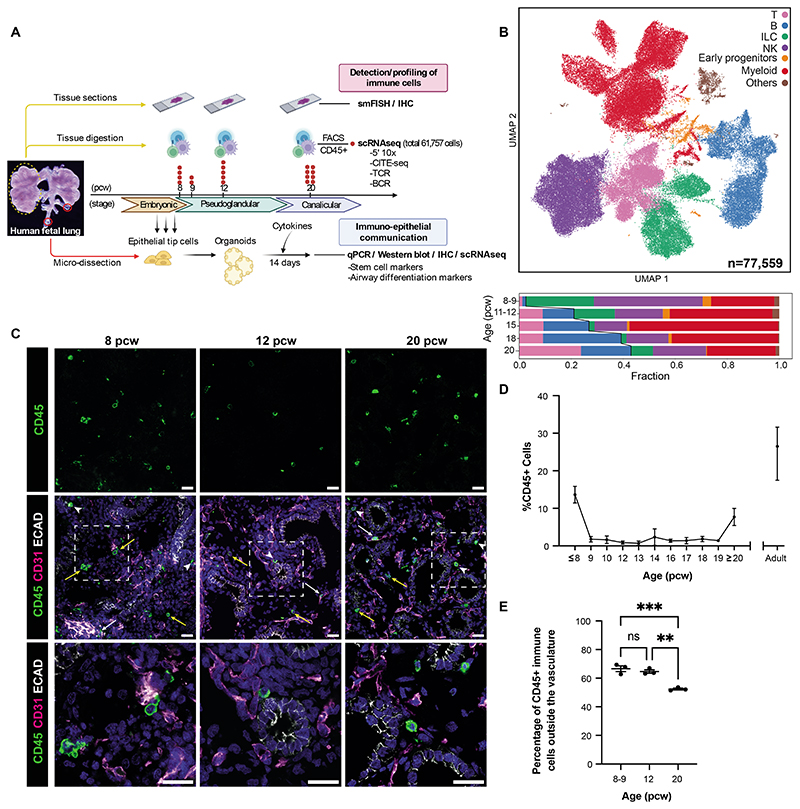
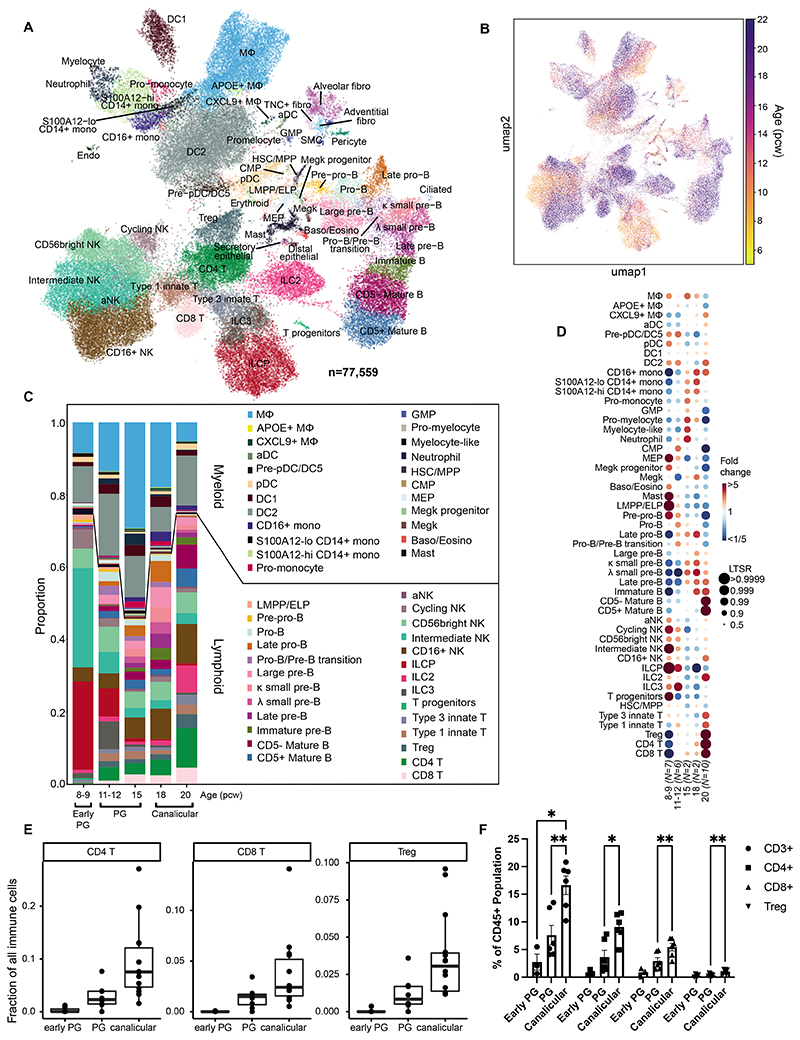
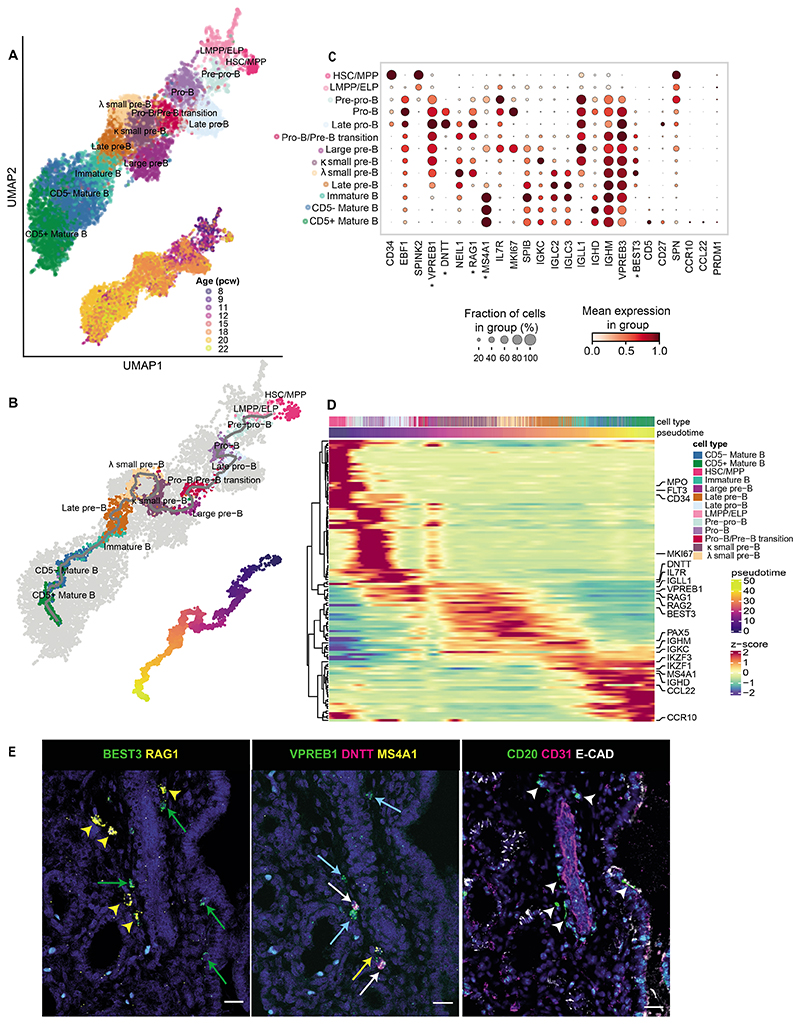
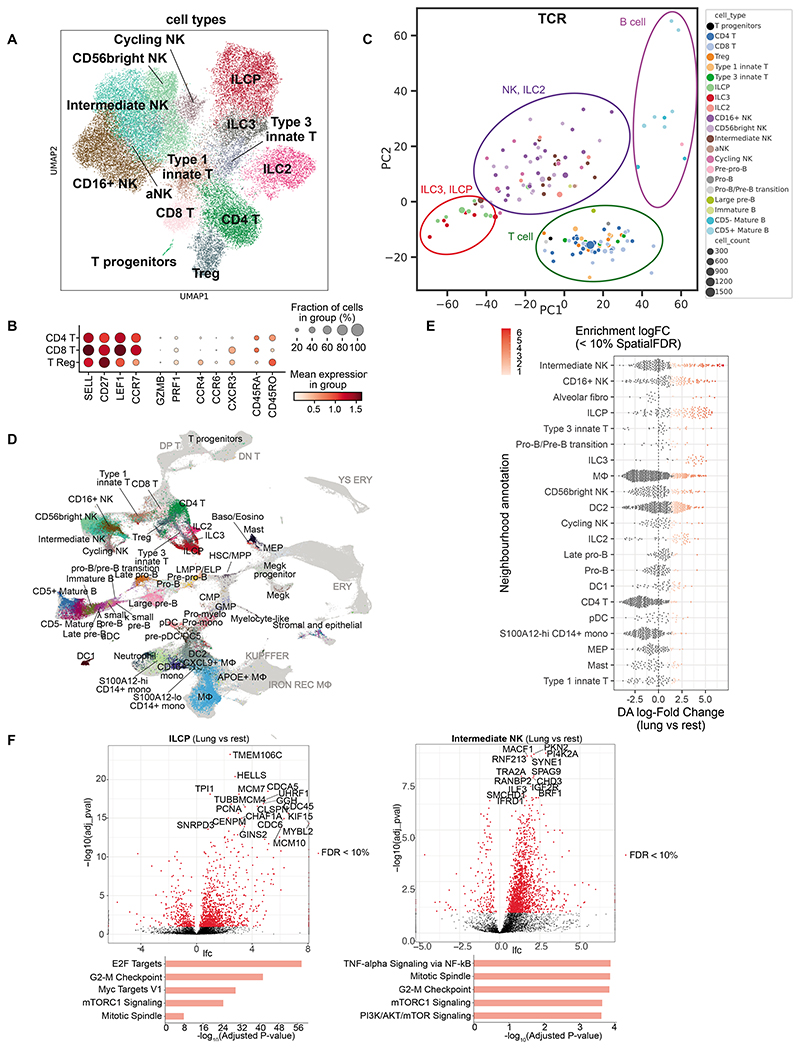
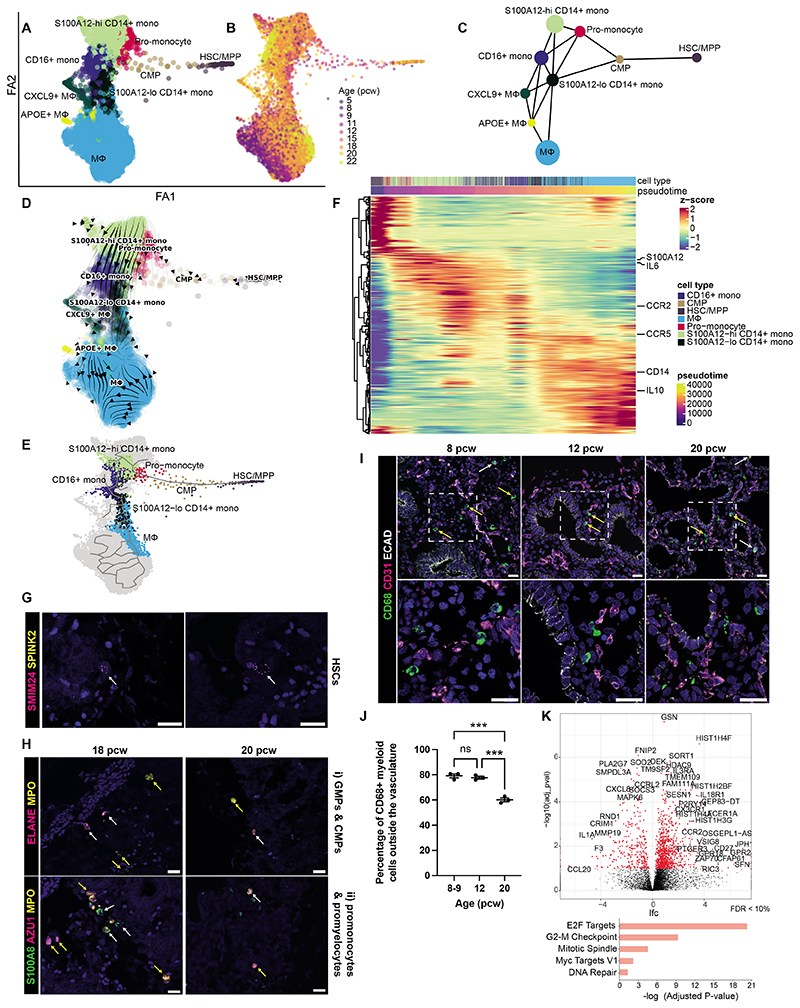
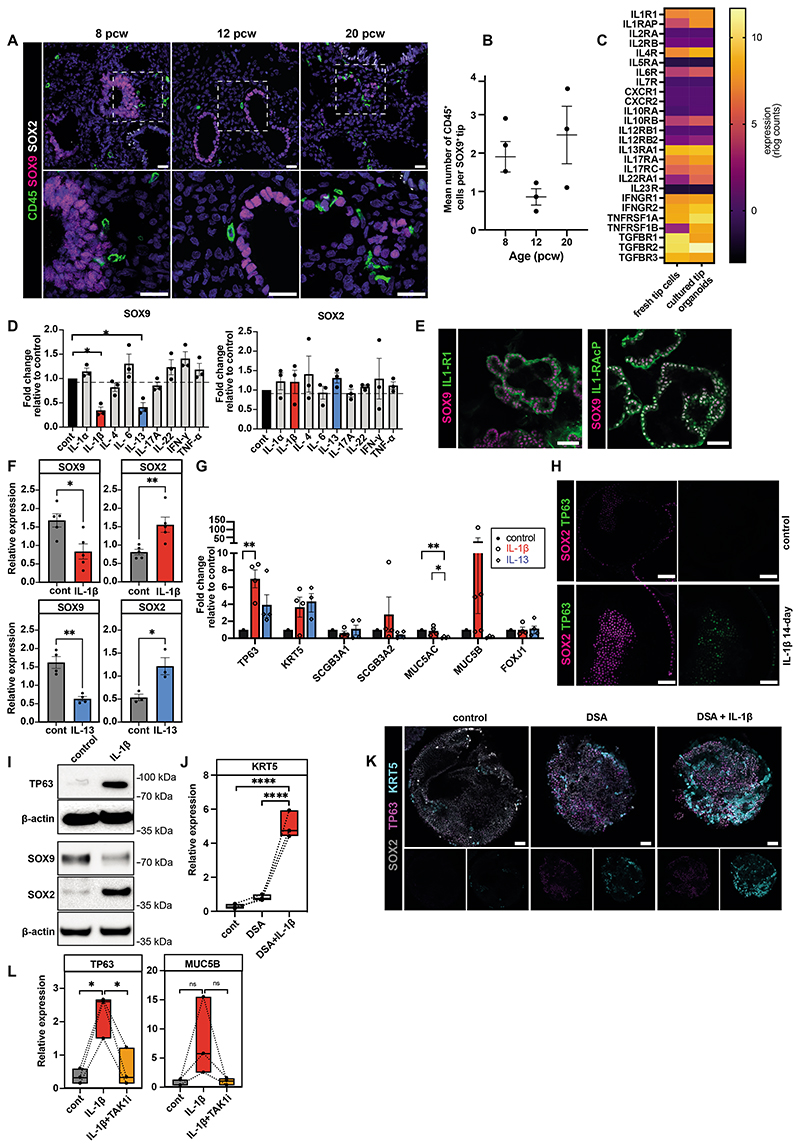
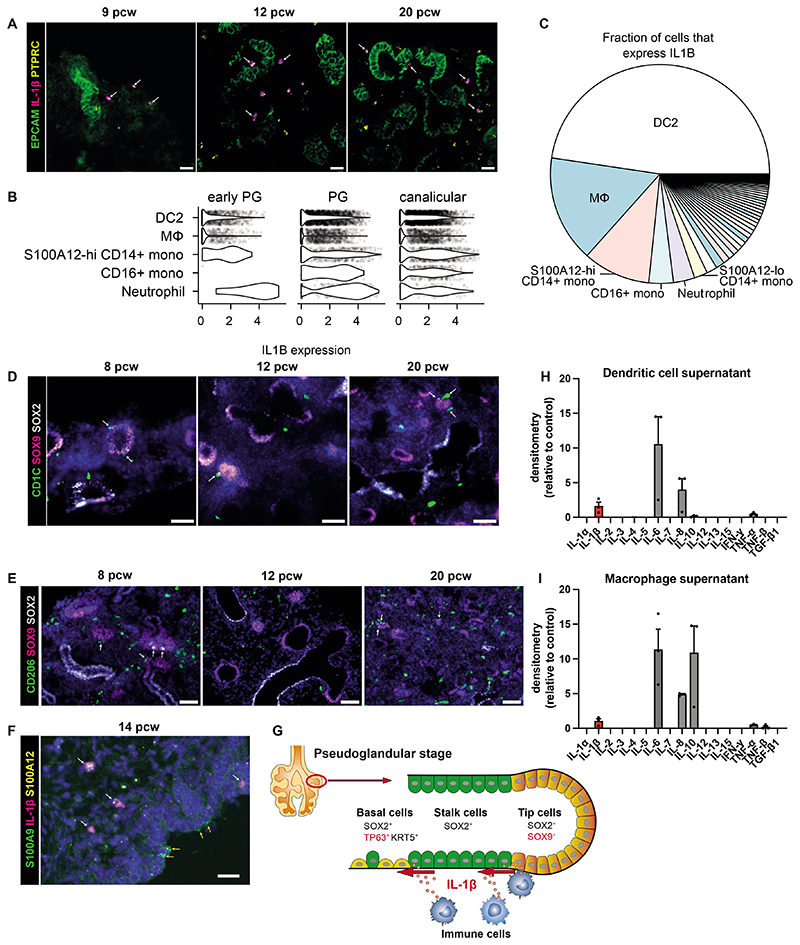
Studies of human lung development have focused on epithelial and mesenchymal cell types and function, but much less is known about the developing lung immune cells, even though the airways are a major site of mucosal immunity after birth. An unanswered question is whether tissue-resident immune cells play a role in shaping the tissue as it develops in utero. Here, we profiled human embryonic and fetal lung immune cells using scRNA-seq, smFISH, and immunohistochemistry. At the embryonic stage, we observed an early wave of innate immune cells, including innate lymphoid cells, natural killer cells, myeloid cells, and lineage progenitors. By the canalicular stage, we detected naive T lymphocytes expressing high levels of cytotoxicity genes and the presence of mature B lymphocytes, including B-1 cells. Our analysis suggests that fetal lungs provide a niche for full B cell maturation. Given the presence and diversity of immune cells during development, we also investigated their possible effect on epithelial maturation. We found that IL-1β drives epithelial progenitor exit from self-renewal and differentiation to basal cells in vitro. In vivo, IL-1β-producing myeloid cells were found throughout the lung and adjacent to epithelial tips, suggesting that immune cells may direct human lung epithelial development.


Conflict of interest statement

Competing interests: In the past three years, S.A.T. has received remuneration for consulting and Scientific Advisory Board Membership from Sanofi, GlaxoSmithKline, Foresite Labs and Qiagen. S.A.T. is a co-founder, board member and holds equity in Transition Bio. O.S. is a paid member of the Scientific Advisory Board of Insitro.Inc. Z.K.T. has received consulting fees for Synteny Biotechnologies Ltd. J.R. is a non-stakeholder consultant for Achilles Therapeutics. S.M.J. has received fees for advisory board membership in the last three years from Astra-Zeneca, Bard1 Lifescience, and Johnson and Johnson; he has received grant income from Owlstone and GRAIL Inc.

Figures

Figure 1
Figure 1. Immune cells are abundant in human fetal lungs.
(A) Experimental overview of human fetal lung tissue was digested and FACS-sorted to isolate CD45+ immune cells for scRNA-seq (red dot = biological replicate; n=19; FACS gating strategy: Fig S1B). Tissue sections across developmental stages were used for cell type validation (IHC and smFISH), while embryonic tissue was used to generate organoids for functional studies. (B) UMAP (upper) and bar chart (lower) colored by broad cell populations in the single-cell dataset. Representative IHC images (C) show the spatial distribution of CD45+ immune cells within the endothelium (CD31+, white arrows), epithelium (ECAD+, arrowheads) and mesenchyme (yellow arrows) during fetal lung development (blue: DAPI+ nuclei; scale bar=20μM). The proportion of immune cells, as a percentage of all DAPI+ nuclei, was quantified in cryosections at weekly time points throughout lung development (D), using ImageJ. Data are presented as mean ± SEM, n≥3 biological replicates. (E) The proportion of CD45+ immune cells outside the CD31+ vasculature versus inside was calculated at 8-9, 12 and 20 post-conception weeks (pcw) (mean ± SEM, n=3 biological replicates). p-values (**<0.01, ***<0.001) were calculated by one-way ANOVA followed by Tukey’s post-hoc test. See also Fig S1.
Figure 2
Figure 2. Single-cell analysis of fetal lung immune cells.
(A,B) Single-cell transcriptome profiles embedded onto a 2D UMAP, colored by cell type/state (A) or age (B). (C) Proportions of each cluster across age groups. (D) Dot plot showing fold change in proportions of lung immune cell types across fetal age, relative to the proportion of the given cell type in the whole data set. Each dot is color-coded by the fold change over the mean of each cell type, scaled by its significance (determined by local true sign rate (LTSR)). (E) Barplot showing the abundance of CD4, CD8 and Treg cells throughout lung development captured by scRNA-seq. (F) Flow cytometric analysis (gating: Fig S1C) of digested fetal lungs shows the proportions of T cells at stages throughout lung development, separated into: CD3+, CD4+, CD8+ and Tregs, calculated as a proportion of the CD45+ immune cell population. Early PG = 7-9 pcw, PG = 10-14 pcw and Canalicular = 17-21 pcw (‘PG’ = pseudoglandular). Data are presented as mean ± SEM, n≥3 biological replicates. p-values*<0.05, **<0.01 were calculated by REML analysis followed by Tukey’s post-hoc test. See also Fig S2, S3, Data File S3.
Figure 3
Figure 3. B cell development in fetal lungs.
(A, B) UMAPs of the B cell lineage showing (A) cell type clusters (top) and developmental stage of the corresponding samples in pcw (bottom); and (B) inferred trajectory from HSC/MPP to mature B cells using monocle3 (top) and the corresponding pseudotime (bottom). (C) B cell marker gene expression. (D) Clustermap (optimal leaf ordering) showing expression of the top 100 differential genes from the trajectory in (B). The cells (columns) are ordered by pseudotime. (E) RNAscope using sequential tissue sections from 20 pcw fetal lungs (left and center) showing expression of B progenitor markers (labeled with asterisks in (C); yellow arrowheads (small pre-B): BEST3+RAG1+;green arrows (large pre-B): BEST3+RAG1-; white arrows (pro-B): VPREB1+DNTT+; blue arrows (pre-B): VPREB1+; yellow arrows (late pre-B): VPREB1+MS4A1+). Corresponding IHC (right) using the next sequential tissue section, shows expression of CD20, CD31 (endothelium/blood vessels) and ECAD (epithelium) (arrowheads: CD20+ B cells). In all images, blue: DAPI+ nuclei; scale bar=20μM. See also Fig S5.
Figure 4
Figure 4. T cells, ILCs and NK cells in fetal lungs.
(A) UMAP showing lymphocytes except B cells. (B) Expression of marker genes for naive and mature T cells. (C) PCA plot summarizing TRBJ and TRBC gene segment usage proportion in different cell types. Each dot represents a biosample of at least 20 cells (size for cell count). Colored circles illustrate groupings of cell types. (D) UMAP of scVI integrated fetal immune cells from lung and 9 hematopoietic, lymphoid and non-lymphoid tissues. Fetal lung cells are colored by their cell type annotation while others are in grey. DP T, double-positive T cells; DN T, double-negative T cells; YS ERY, yolk sac-derived erythroid; ERY, erythroid; KUPFFER: Kupffer-like macrophages; IRON REC MΦ, Iron-recycling macrophages. (E) Beeswarm plot showing the distribution of log fold change in abundance between lung cells and all other organs in neighborhoods containing cells from different lung cell type clusters. Only differential abundance neighborhoods at SpatialFDR 10% and logFC > 0 are colored. (F) Differential gene expression comparing fetal lung with other organs in ILCPs and intermediate NK cells. Below are the top 5 enriched biological processes GO terms for upregulated genes. See also Fig S6 and S7.
Figure 5
Figure 5. Macrophage development in fetal lungs.
(A,B) Force-directed embedding of the myeloid lineage showing cell type clusters (A) and their age (pcw) (B). (C) Myeloid PAGA and (D) velocity analysis. (E) Selected path along the main trajectory, going from HSC/MPP towards macrophages and corresponding clustermap (F) (optimal leaf ordering) showing expression of the top 100 differential genes computed with monocle3 - cells (columns) ordered by pseudotime. (G) RNAscope showing hematopoietic stem cells (HSCs, white arrows: SMIM24+SPINK+) (19 pcw lungs). (H) RNAscope images of (i) GMPs (ELANE+MPO+, white arrows), CMPs (MPO+, yellow arrows), (ii) promonocytes (S100A8+MPO+, white arrows), promyelocytes (AZU1+MPO+, yellow arrows). (I) IHC showing spatial distribution of CD68+myeloid cells within the endothelium (CD31+, white arrows) and mesenchyme (yellow arrows) in fetal lungs (ECAD: epithelium). (J) Quantification of tissue-resident CD68+ myeloid cells over time. Data presented as mean ± SEM, n=3 biological replicates, p-values are calculated by one-way ANOVA followed by Tukey’s post-hoc test (***<0.001). In all images, blue: DAPI+ nuclei; scale bar=20μM. (K) Differential gene expression comparing fetal lung with other organs (Fig 4) in macrophages. Below are the top 5 enriched biological processes GO terms for upregulated genes. See Fig S8.
Figure 6
Figure 6. Effect of cytokines on nearby epithelial tip cells.
(A) Fetal lung IHC images depict CD45+ immune cells around SOX9+ epithelial tips, with insets highlighting direct contact, quantified in (B). (C) Heatmap comparing cytokine receptor expression in fetal lung tips versus organoids (4). (D) qPCR shows organoid SOX9 and SOX2 expression after 7-day cytokine treatment. (E) Organoid staining shows IL-1R1 and IL-1R1AcP expression. (F-G) qPCR showing organoid SOX9 and SOX2 expression (F) and airway marker expression (G) after 14-day IL-1β/IL-13 treatment. (H,I) IL-1β treated organoids were analyzed via SOX2 and TP63 staining (H) and via SOX9, SOX2 and TP63 Western blot (I, Data File S5). (J) IL-1β effect on basal cell differentiation combined with dual SMAD activation (DSA), assessed by KRT5 qPCR. (K) Organoid staining shows SOX2, TP63, and KRT5 expression following DSA/IL-1β treatment. (L) qPCR analysis on TP63 and MUC5B after IL-1 signaling inhibitor (TAKi) combined with IL-1β treatment. Data: mean ± SEM, n≥3 biological replicates; p-values - one-way ANOVA followed by Tukey’s post-hoc test (B, D, G, J, L) or unpaired t-test (F). Images, blue: DAPI+ nuclei; scale bar=20μm in (A) and 50μm in other images. See Fig S9.
Figure 7
Figure 7. Fetal lung myeloid cells secrete IL-1β.
(A) RNAscope images of fetal lungs, showing expression of PTPRC and IL1B, with EpCAM IHC (white arrows: PTPRC+IL1B+ cells; scale bar=20μM). (B) Violin plot showing IL1B gene expression in each of the top 5 highest expressing cell types, based on our single-cell dataset (Fig S8 shows all cell types). (C) Pie chart showing the total contribution of each cell type to all expressed IL1B mRNA. IHC images show the distribution of CD1C+ DC2 cells (D) or CD206+ macrophages (E) surrounding SOX9+ epithelial tips during lung development (white arrows: immune cells adjacent to SOX9+ cells; blue: DAPI+ nuclei; scale bar=50μM). (F) RNAscope image showing the distribution of S100A9+S100A12+ neutrophils/monocytes relative to the epithelium (determined morphologically), including those that coexpress IL1B (white arrows) and those that do not (yellow arrows) (blue: DAPI+ nuclei; scale bar=20μM). (G) Model: IL-1β causes exit from a self-renewing state and airway differentiation during fetal lung development. Isolated DC or macrophages (via FACS of 19-21 pcw lungs, Fig S1D) were cultured for 7 days to investigate cytokine production. The pooled supernatant, from days 3, 5 and 7 of culture, was analyzed using the Human Cytokine Antibody Array (abcam; H and I respectively, n=3 biological replicates). See Fig S10.

Similar articles

Cited by

References

    1. Nikolić MZ, Sun D, Rawlins EL. Human lung development: recent progress and new challenges. Development. 2018;145:dev163485. - PMC - PubMed
    1. Hynds RE, Zacharias WJ, Nikolić MZ, Königshoff M, Eickelberg O, Gosens R, de Coppi P, Janes SM, Morrisey E, Clevers H, Ryan AL, et al. National Heart, lung, and Blood Institute and building respiratory epithelium and tissue for Health (BREATH) consortium workshop report: Moving forward in lung regeneration. Am J Respir Cell Mol Biol. 2021;65:22–29. - PMC - PubMed
    1. Noncommunicable diseases. World Health Organization; 2021. available at https://www.who.int/news-room/fact-sheets/detail/noncommunicable-diseases.
    1. Nikolić MZ, Caritg O, Jeng Q, Johnson J-A, Sun D, Howell KJ, Brady JL, Laresgoiti U, Allen G, Butler R, Zilbauer M, et al. Human embryonic lung epithelial tips are multipotent progenitors that can be expanded in vitro as long-term self-renewing organoids. Elife. 2017;6:e26575. - PMC - PubMed
    1. deMello DE, Reid LM. Embryonic and early fetal development of human lung vasculature and its functional implications. Pediatr Dev Pathol. 2000;3:439–449. - PubMed

Publication types