. 2024 Jan;11(1):e200185.
doi: 10.1212/NXI.0000000000200185. Epub 2023 Dec 15.

Single-Cell Profiling Indicates a Proinflammatory Role of Meningeal Ectopic Lymphoid Tissue in Experimental Autoimmune Encephalomyelitis

Affiliations

Single-Cell Profiling Indicates a Proinflammatory Role of Meningeal Ectopic Lymphoid Tissue in Experimental Autoimmune Encephalomyelitis

Jolien Diddens et al. Neurol Neuroimmunol Neuroinflamm. 2024 Jan.

Abstract

Background and objectives: The factors that drive progression in multiple sclerosis (MS) remain obscure. Identification of key properties of meningeal inflammation will contribute to a better understanding of the mechanisms of progression and how to prevent it.

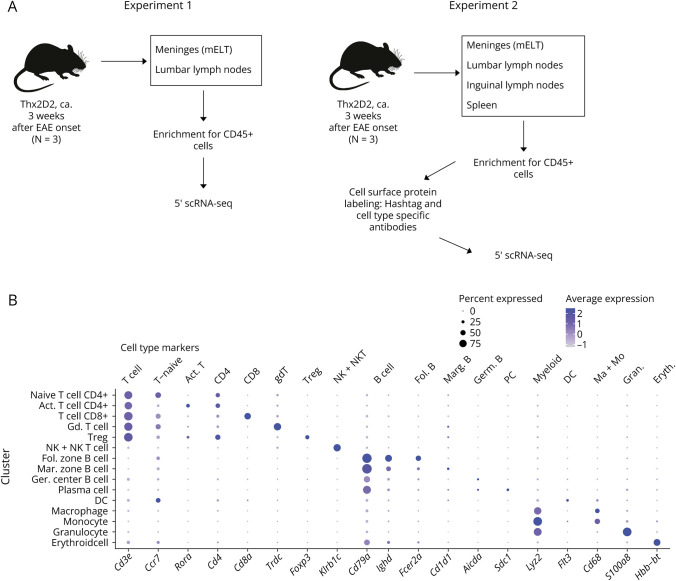
Methods: Applying single-cell RNA sequencing, we compared gene expression profiles in immune cells from meningeal ectopic lymphoid tissue (mELT) with those from secondary lymphoid organs (SLOs) in spontaneous chronic experimental autoimmune encephalomyelitis (EAE), an animal model of MS.

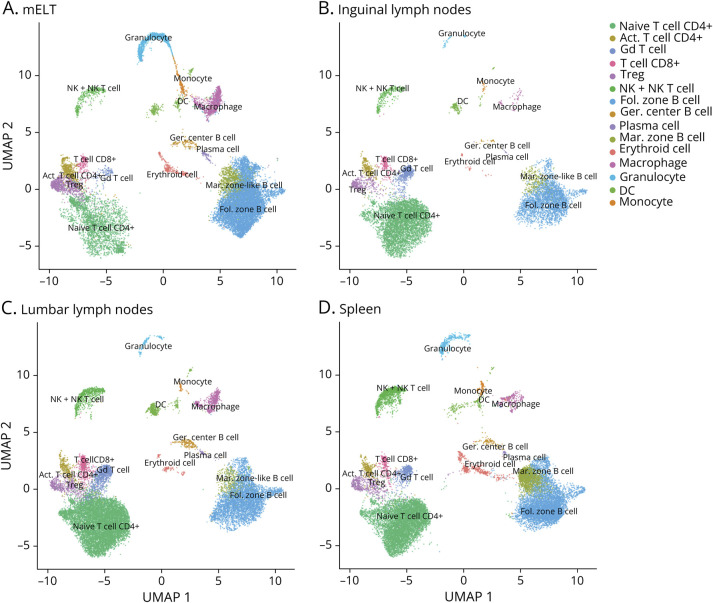
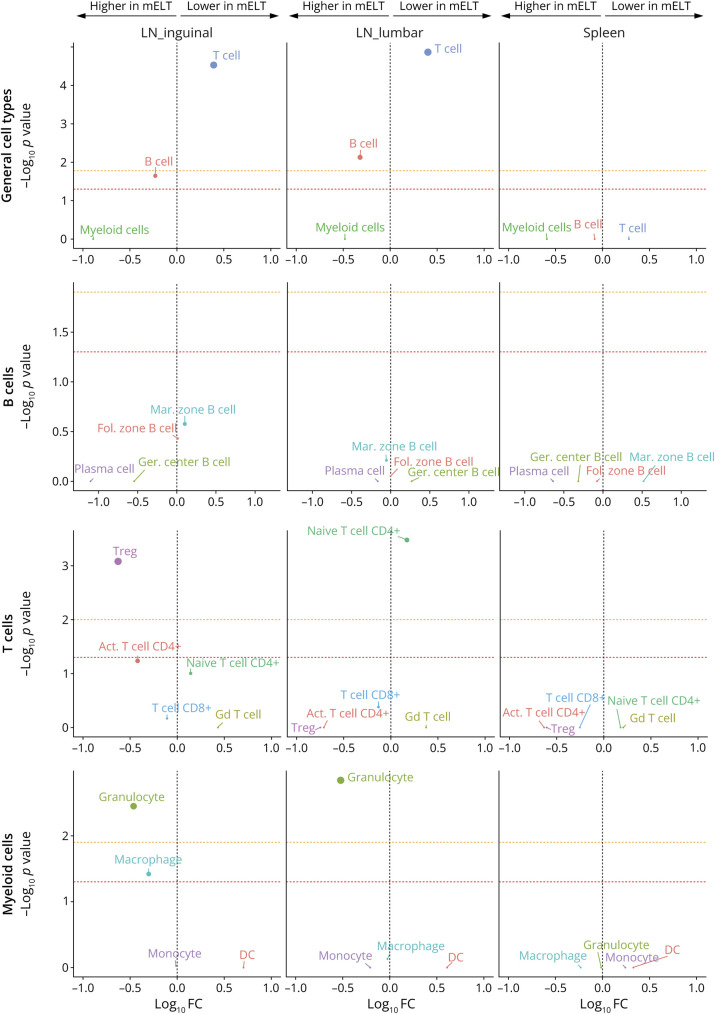
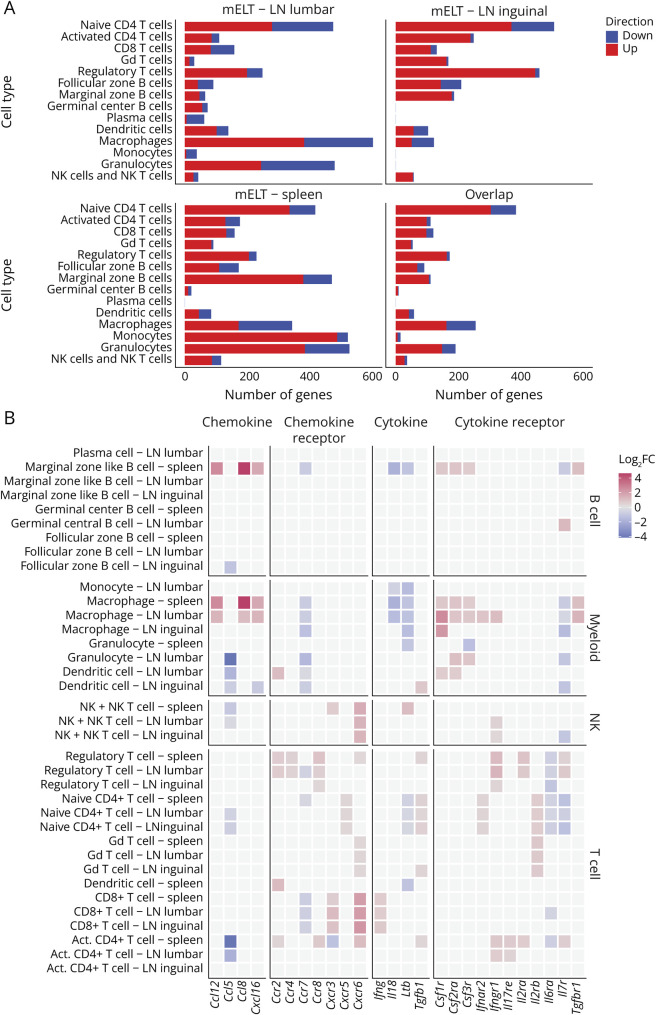
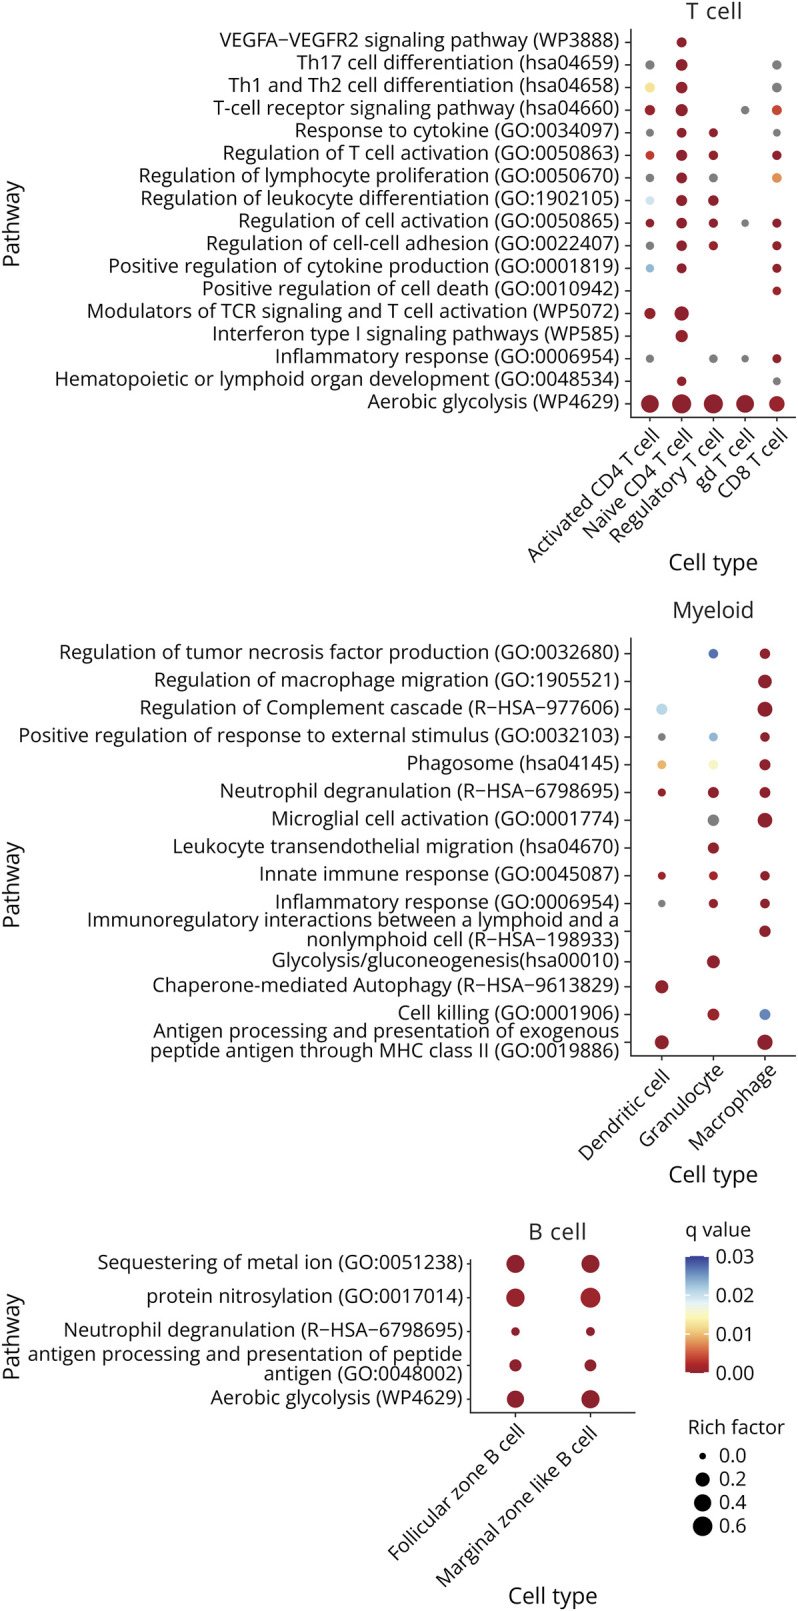
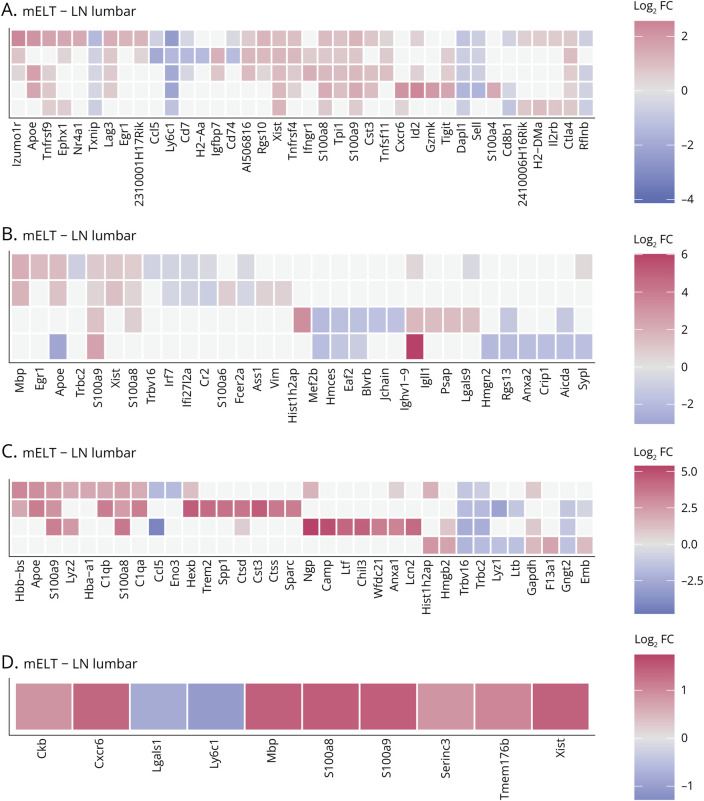
Results: Generally, mELT contained the same immune cell types as SLOs, suggesting a close relationship. Preponderance of B cells over T cells, an increase in regulatory T cells and granulocytes, and a decrease in naïve CD4+ T cells characterize mELT compared with SLOs. Differential gene expression analysis revealed that immune cells in mELT show a more activated and proinflammatory phenotype compared with their counterparts in SLOs. However, the increase in regulatory T cells and upregulation of immunosuppressive genes in most immune cell types indicate that there are mechanisms in place to counter-regulate the inflammatory events, keeping the immune response emanating from mELT in check.

Discussion: Common features in immune cell composition and gene expression indicate that mELT resembles SLOs and may be regarded as a tertiary lymphoid tissue. Distinct differences in expression profiles suggest that mELT rather than SLOs is a key driver of CNS inflammation in spontaneous EAE. Our data provide a starting point for further exploration of molecules or pathways that could be targeted to disrupt mELT formation.


Conflict of interest statement

J. Diddens, G. Lepennetier, V. Friedrich, M. Pfaller, and T. Georgieva report no disclosures relevant to the manuscript. R.M. Brand is a fellow of the Hertie Foundation (medMS Doctoral Program). B. Hemmer has served on scientific advisory boards for Novartis and Sandoz; he has served as DMSC member for AllergyCare, Sandoz, Polpharma, Biocon, and TG therapeutics; his institution received research grants from Roche for multiple sclerosis research. He has received honoraria for counseling (Gerson Lehrmann Group). He holds part of 2 patents; one for the detection of antibodies against KIR4.1 in a subpopulation of patients with multiple sclerosis and the other for genetic determinants of neutralizing antibodies to interferon. All conflicts are not relevant to the topic of the study. K. Lehmann-Horn has received research support (to TUM) from Novartis and honoraria and compensation for travel expenses from Novartis, F. Hoffmann-La Roche, Biogen, Teva, Hexal, and Merck Serono. Go to Neurology.org/NN for full disclosures.

Figures

Figure 1
Figure 1. Study Design and Cell Cluster Definition
(A) overview of the study design, (B) Dotplot depicting expression of selected marker genes for specific cell types in cell clusters. Dot size encodes percentage of cells expressing the gene, color encodes the average gene expression level per cell. The Y-axis names the 15 specific clusters. The genes named on the lower X-axis define the cell types in the upper X-axis (e.g., expression of FoxP3 defines Tregs).
Figure 2
Figure 2. Meningeal Ectopic Lymphoid Tissue Strongly Resembles Secondary Lymphoid Organs
Uniform Manifold Approximation and Projection (UMAP) plot representing 15 color-coded cell clusters identified in using single-cell sequencing, split per tissue: mELT (A), inguinal (B) and lumbar (C) lymph nodes, and spleen (D).
Figure 3
Figure 3. Distinct Changes in Cell Composition Distinguish Meningeal Ectopic Lymphoid Tissue From Secondary Lymphoid Organs
Plot of differences in cluster abundance in mELT compared with inguinal lymph nodes, lumbar lymph nodes, and spleen, plotting fold change (log10) against p value (-log10) based on the Welch t test (see methods for details). Horizontal dotted lines indicate significance threshold (p = 0.05), before (red) and after (orange) Bonferroni correction for multiple testing. n = 6 for mELT and lumbar LN, n = 3 for inguinal LN, and n = 2 for spleen.
Figure 4
Figure 4. Gene Expression Analysis Defines the Pro- and Anti-inflammatory Profile of Meningeal Ectopic Lymphoid Tissue
(A) Number of differentially expressed genes (DEG) between mELT and SLOs per cell cluster. x-axis represents the number of DEGs between mELT and lumbar lymph nodes (LN), inguinal LN, and spleen. The overlap contains all genes significantly differentially expressed between mELT and at least 2 of 3 of the SLOs. Downregulated genes are shown in blue; upregulated genes are shown in red. The y-axis shows the cell clusters. Ribosomal protein genes were not counted. (B) Cytokine-related gene expression differences between mELT and SLOs. Color reflects log2 fold change (FC) between mELT and the indicated SLOs (LN lumbar, LN inguinal, or spleen). Gray squares mean there was no significant difference (significance level p = 0.05). Cytokine genes shown are the ones for which the authors found significant differences in at least 2 of 3 tissue comparisons for at least one of the cell types.
Figure 5
Figure 5. Functional Enrichment Analysis for Genes Differentially Expressed Between mELT and SLOs Using Metascape
The overlap gene list (see Figure 4A) was used as input for the functional enrichment analysis. Figure shows a summary of the statistically most enriched pathways (adjusted p value<0.001 for at least 1 cell type) for T-cell, B-cell, and myeloid cell subtypes. Redundant pathways were collapsed into a single biological theme. The dot size reflects the rich factor (ratio of the DEG number and the total number of genes annotated in this GO term) and its color the corresponding statistical significance (q value, Bonferroni corrected). For gray dots, the pathway was significant based on p value, but not on q value. Absence of a dot indicates the annotation was not significantly enriched for this cell type. Cell clusters that are missing for specific tissue comparisons were not analyzed because either too little cells were picked up (<50 cells), or the amount of differentially expressed genes was too small (<20). Ribosomal protein genes were not considered for functional enrichment analysis. Complete functional enrichment analysis results are summarized in eTable 6 (links.lww.com/NXI/A947).
Figure 6
Figure 6. Differential Gene Expression in Meningeal Ectopic Lymphoid Tissue Compared With Lumbar Lymph Nodes
Top 10 differentially expressed genes per cell cluster between mELT and lumbar lymph nodes for T cells (A), B cells (B), myeloid cells (C), and the NK- and NKT-cell cluster (D). Heatmaps showing average log2 fold change (FC) for the top 10 genes (highest FC) for each cell cluster. Genes are ordered by the cluster in which they were selected; if they were in the top 10 of multiple cell clusters, they were shown only once. Genes that show higher expression in mELT are shown in red (positive FC) and genes showing lower expression in mELT (negative FC) in blue. Genes that were not significantly differentially expressed are shown in gray. Cell clusters that are missing for specific tissue comparisons were not analyzed because too little cells were picked up in that particular tissue (<50 cells). Ribosomal protein genes were not considered. A similar figure for the top 10 differentially expressed genes between meningeal ectopic lymphoid tissue and inguinal lymph nodes, or spleen, can be found in eFigure 2 (links.lww.com/NXI/A950).

Similar articles

Cited by

References

    1. Serafini B, Rosicarelli B, Magliozzi R, Stigliano E, Aloisi F. Detection of ectopic B-cell follicles with germinal centers in the meninges of patients with secondary progressive multiple sclerosis. Brain Pathol. 2004;14(2):164-174. doi:10.1111/j.1750-3639.2004.tb00049.x - DOI - PMC - PubMed
    1. Zhan J, Kipp M, Han W, Kaddatz H. Ectopic lymphoid follicles in progressive multiple sclerosis: from patients to animal models. Immunology. 2021;164(3):450-466. doi:10.1111/imm.13395 - DOI - PMC - PubMed
    1. Negron A, Stüve O, Forsthuber TG. Ectopic lymphoid follicles in multiple sclerosis: centers for disease control? Front Neurol. 2020;11:607766. doi:10.3389/fneur.2020.607766 - DOI - PMC - PubMed
    1. Jones GW, Hill DG, Jones SA. Understanding immune cells in tertiary lymphoid organ development: it is all starting to come together. Front Immunol. 2016;7:401. doi:10.3389/fimmu.2016.00401 - DOI - PMC - PubMed
    1. Lehmann-Horn K, Wang SZ, Sagan SA, Zamvil SS, von Büdingen HC. B cell repertoire expansion occurs in meningeal ectopic lymphoid tissue. JCI Insight. 2016;1(20):e87234. doi:10.1172/jci.insight.87234 - DOI - PMC - PubMed