. 2023 Dec 21;186(26):5690-5704.e20.
doi: 10.1016/j.cell.2023.11.024. Epub 2023 Dec 14.

Genomic surveillance reveals dynamic shifts in the connectivity of COVID-19 epidemics

Nathaniel L Matteson  1 Gabriel W Hassler  2 Ezra Kurzban  3 Madison A Schwab  3 Sarah A Perkins  3 Karthik Gangavarapu  4 Joshua I Levy  3 Edyth Parker  3 David Pride  5 Abbas Hakim  6 Peter De Hoff  6 Willi Cheung  6 Anelizze Castro-Martinez  7 Andrea Rivera  8 Anthony Veder  8 Ariana Rivera  8 Cassandra Wauer  8 Jacqueline Holmes  8 Jedediah Wilson  8 Shayla N Ngo  8 Ashley Plascencia  8 Elijah S Lawrence  8 Elizabeth W Smoot  8 Emily R Eisner  8 Rebecca Tsai  8 Marisol Chacón  8 Nathan A Baer  8 Phoebe Seaver  8 Rodolfo A Salido  8 Stefan Aigner  8 Toan T Ngo  8 Tom Barber  8 Tyler Ostrander  8 Rebecca Fielding-Miller  9 Elizabeth H Simmons  10 Oscar E Zazueta  11 Idanya Serafin-Higuera  12 Manuel Sanchez-Alavez  13 Jose L Moreno-Camacho  14 Abraham García-Gil  14 Ashleigh R Murphy Schafer  15 Eric McDonald  15 Jeremy Corrigan  15 John D Malone  15 Sarah Stous  15 Seema Shah  15 Niema Moshiri  16 Alana Weiss  3 Catelyn Anderson  3 Christine M Aceves  3 Emily G Spencer  3 Emory C Hufbauer  3 Justin J Lee  3 Alison J King  3 Karthik S Ramesh  3 Kelly N Nguyen  3 Kieran Saucedo  3 Refugio Robles-Sikisaka  3 Kathleen M Fisch  17 Steven L Gonias  18 Amanda Birmingham  19 Daniel McDonald  19 Smruthi Karthikeyan  19 Natasha K Martin  20 Robert T Schooley  20 Agustin J Negrete  21 Horacio J Reyna  21 Jose R Chavez  21 Maria L Garcia  21 Jose M Cornejo-Bravo  22 David Becker  23 Magnus Isaksson  23 Nicole L Washington  23 William Lee  23 Richard S Garfein  24 Marco A Luna-Ruiz Esparza  25 Jonathan Alcántar-Fernández  25 Benjamin Henson  26 Kristen Jepsen  26 Beatriz Olivares-Flores  27 Gisela Barrera-Badillo  27 Irma Lopez-Martínez  27 José E Ramírez-González  27 Rita Flores-León  27 Stephen F Kingsmore  28 Alison Sanders  29 Allorah Pradenas  29 Benjamin White  29 Gary Matthews  29 Matt Hale  29 Ronald W McLawhon  29 Sharon L Reed  29 Terri Winbush  29 Ian H McHardy  30 Russel A Fielding  30 Laura Nicholson  30 Michael M Quigley  30 Aaron Harding  31 Art Mendoza  31 Omid Bakhtar  31 Sara H Browne  32 Jocelyn Olivas Flores  33 Diana G Rincon Rodríguez  34 Martin Gonzalez Ibarra  34 Luis C Robles Ibarra  35 Betsy J Arellano Vera  36 Jonathan Gonzalez Garcia  37 Alicia Harvey-Vera  38 Rob Knight  39 Louise C Laurent  7 Gene W Yeo  40 Joel O Wertheim  41 Xiang Ji  42 Michael Worobey  43 Marc A Suchard  44 Kristian G Andersen  45 Abraham Campos-Romero  25 Shirlee Wohl  3 Mark Zeller  46
Affiliations

Genomic surveillance reveals dynamic shifts in the connectivity of COVID-19 epidemics

Nathaniel L Matteson et al. Cell. .

Abstract

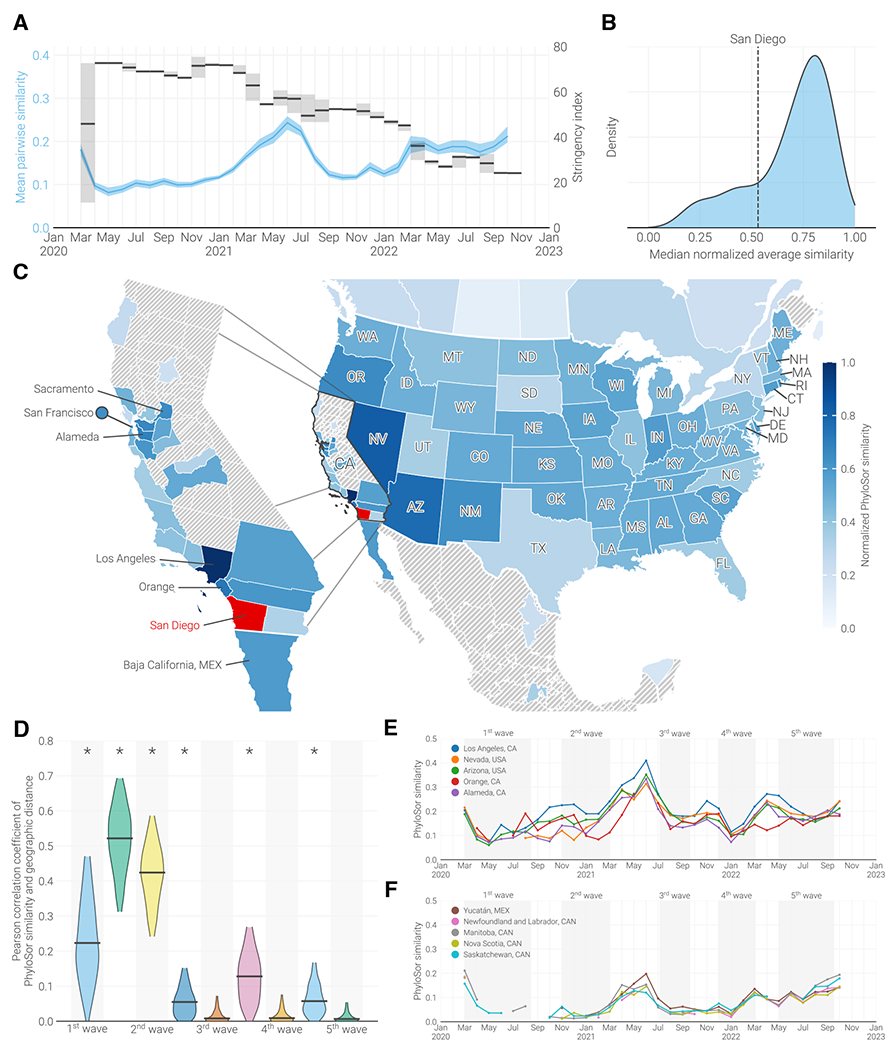
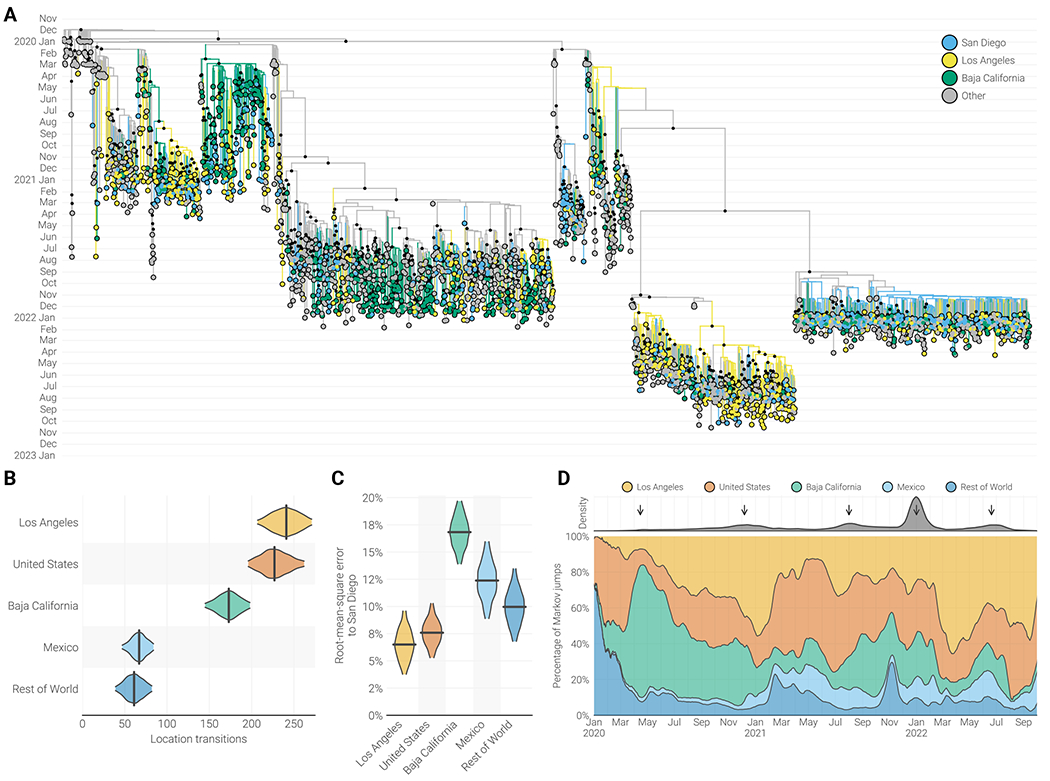
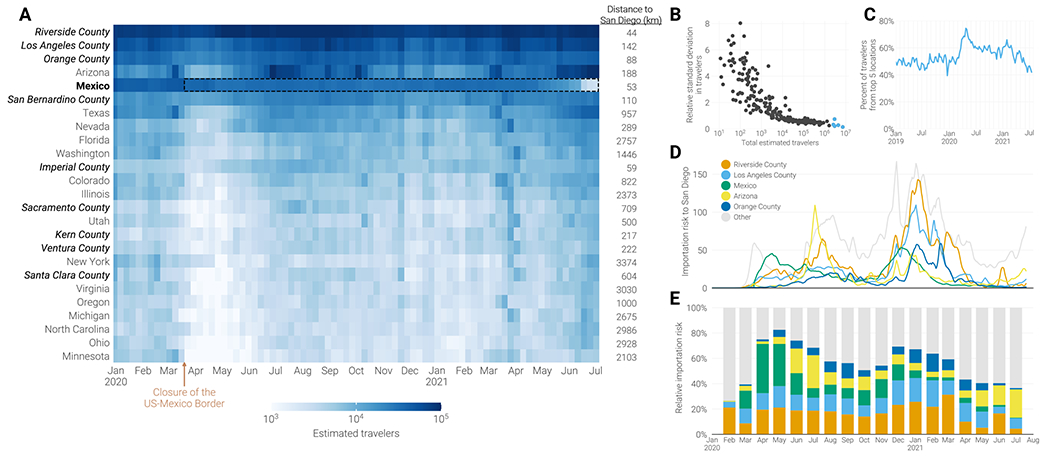
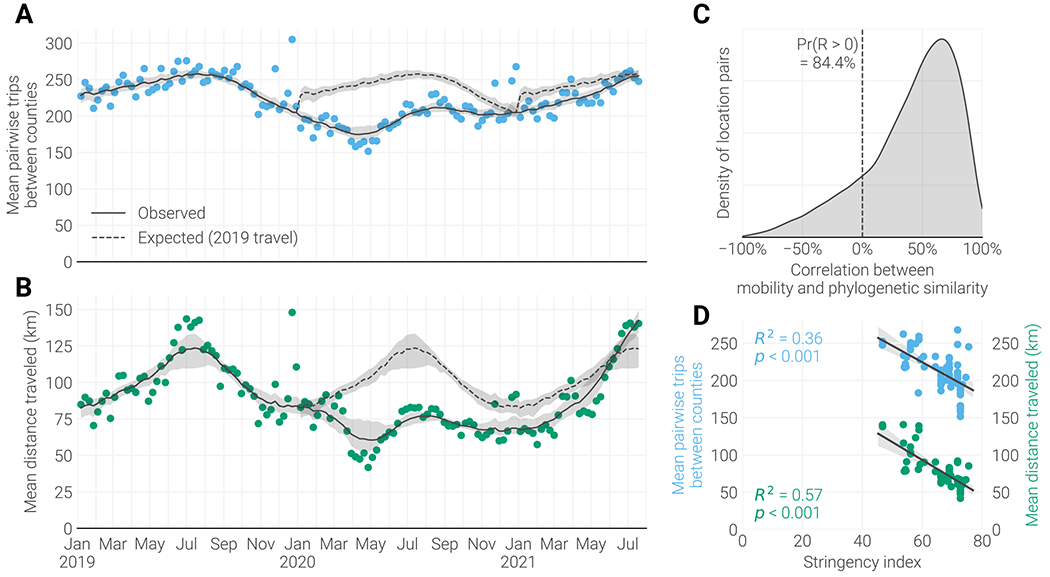
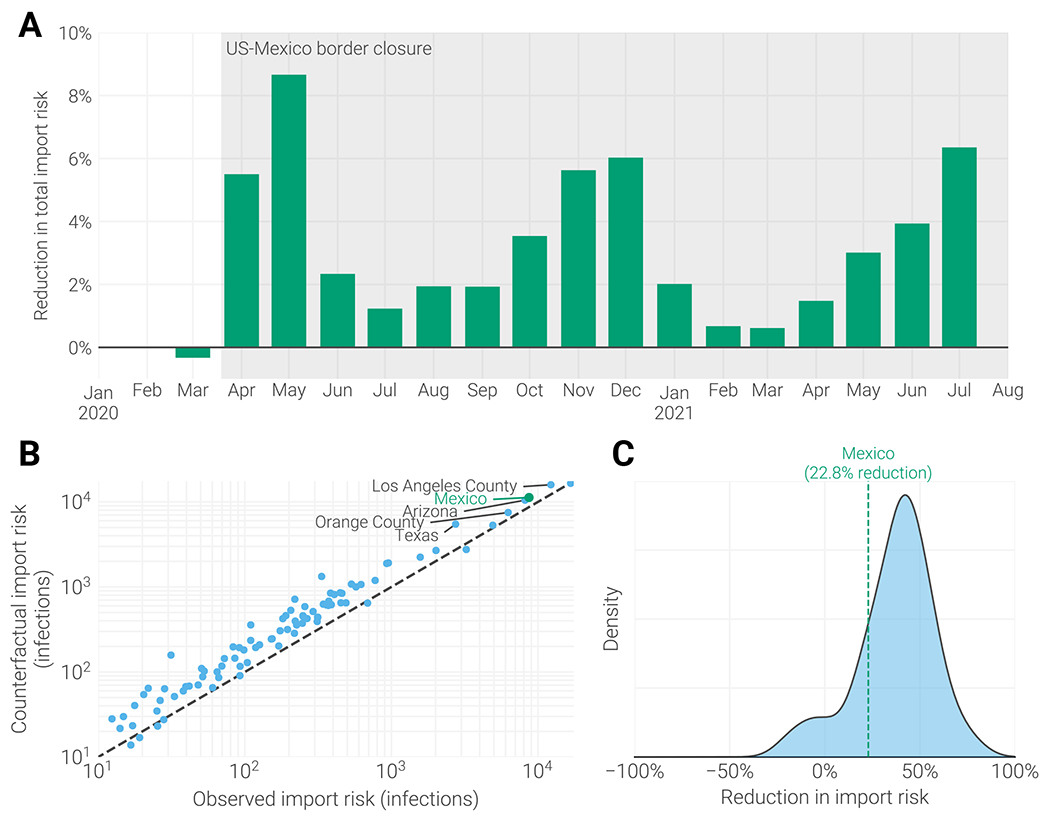
The maturation of genomic surveillance in the past decade has enabled tracking of the emergence and spread of epidemics at an unprecedented level. During the COVID-19 pandemic, for example, genomic data revealed that local epidemics varied considerably in the frequency of severe acute respiratory syndrome coronavirus 2 (SARS-CoV-2) lineage importation and persistence, likely due to a combination of COVID-19 restrictions and changing connectivity. Here, we show that local COVID-19 epidemics are driven by regional transmission, including across international boundaries, but can become increasingly connected to distant locations following the relaxation of public health interventions. By integrating genomic, mobility, and epidemiological data, we find abundant transmission occurring between both adjacent and distant locations, supported by dynamic mobility patterns. We find that changing connectivity significantly influences local COVID-19 incidence. Our findings demonstrate a complex meaning of "local" when investigating connected epidemics and emphasize the importance of collaborative interventions for pandemic prevention and mitigation.

Keywords: COVID-19; SARS-CoV-2; genomic epidemiology; mobility; phylogenetics; travel restrictions; viral sequencing.


Conflict of interest statement

Declaration of interests K.G.A. has received consulting fees on SARS-CoV-2 and the COVID-19 pandemic.

Figures

Figure 1.
Figure 1.. Regional similarity of SARS-CoV-2 genomes over time.
(A) Primary axis, in blue, indicates temporal trends in the mean pairwise PhyloSor similarity of North American locations. Shaded region indicates 95% confidence interval as calculated by bootstrapping locations 100 times. Secondary axis, in black shows the mean stringency of the US government’s response to COVID-19. Higher values indicate a stricter response. Shaded area refers to the range of stringency values observed in a given month. (B) Distribution of median min-max normalized average PhyloSor similarity for all locations in North America. The median normalized phylogenetic similarity of San Diego to all other locations is indicated by the dashed vertical line. (C) Map showing each location’s median min-max normalized PhyloSor similarity to San Diego for the period of March 2020–August 2022. Here location refers to the county level within California and the state level in the rest of the United States, Canada, and Mexico. Each location is colored by their median value, and locations which were not included in the analysis are hashed out in gray. California is outlined in black and shown in greater detail in the inset on the left. San Diego is indicated in red. Some parts of Canada, Mexico, and the United States are excluded for clarity. (D) Pearson correlation coefficient between median PhyloSor similarity to San Diego and log-normalized centroid-centroid distance to San Diego for each period of the pandemic. Waves of cases are indicated by a gray box, while troughs reside between successive waves. Wave definitions can be found in Supp. Figure 6. Confidence intervals calculated by bootstrapping 1000 times. An asterisk indicates that the p-value of correlation is less than 0.05. (E-F) Temporal differences in PhyloSor similarity to San Diego for the 5 locations with the highest (E) and lowest (F) median normalized PhyloSor similarity to San Diego.
Figure 2.
Figure 2.. Phylogenetic analysis of SARS-CoV-2 in the Californias.
(A) Maximum clade credibility tree of whole genome SARS-CoV-2 sequences sampled from Baja California, Los Angeles County, San Diego, and the rest of the world. Black circles at internal nodes indicate posterior support greater than 0.5. (B) Median number of transitions between each location and San Diego inferred by phylogeographic reconstruction. Black bar indicates the median value. (C) Root-mean-square error between the estimated source composition of introductions into each location compared to San Diego. (D) Proportion of location transitions between San Diego and all other locations in the discrete state analysis. Top facet indicates the temporal density of location transitions across the posterior distribution of trees. Arrows are used to show periods of increased location transitions.
Figure 3.
Figure 3.. Dynamics of cross-border transmission.
(A) Boundary of approximate Health and Human Service Agency (HHSA) regions within San Diego. ZIP codes are colored according to the HHSA region they are in and their opacity is determined by their population (darker colors indicate a larger population). Scale bar indicates a distance of 10 miles. (B) Percentage of location transitions from either Baja California (in green) or all other locations (in orange) into San Diego that were inferred to land in each of the county’s HHSA regions. Dots indicate the median value while bars show the 95% highest posterior density interval. (C) Relative difference in percentage of location transitions originating in either Baja California or outside Baja California for each of San Diego’s HHSA region indicated in panel B. Probability refers to the percentage of trees in the posterior in which the proportion of location transitions from Baja California is greater than the proportion from all other locations combined. (D-G) Correlation between the magnitude of location transitions and the estimated number of infections at the origin for each location pair indicated. R2 was determined using ordinary least squares regression. In order to limit the impact of vaccines on our infection calculations, we only show the correlation for dates prior to May 5th, 2021 when at least 50% of San Diego’s population received at least one dose of a SARS-CoV-2 vaccine,.
Figure 4.
Figure 4.. SARS-CoV-2 import risk into San Diego.
(A) Weekly estimated number of travelers arriving into San Diego from January 2020-June 2021. Locations are sorted by the total number of estimated visitors over this period and only the top 25 are shown. Location names are styled depending on their administrative level: California counties are italicized, countries are bolded, and US states weighted normally. The centroid-centroid distance of each location to San Diego is listed to the right of the plot. A black dashed box indicates the closure of the US-Mexico border to non-essential travel from March 19th, 2020 to November 8th, 2021. (B) Scatter plot of each locations’ total estimated travelers into San Diego and the relative standard deviation in estimated travelers for the period indicated by panel A. The five locations with the greatest total estimated travelers into San Diego are highlighted in blue. (C) Proportion of travelers arriving into San Diego from the five locations with the greatest total estimated travelers (top-most five locations in panel A). (D) Import risk into San Diego. Import risk was estimated based on the number of infectious travelers relative to the population size and the total number of travelers at the origin. Only the five locations with the greatest total import risk into San Diego are shown. All other locations are colored in gray. (E) Relative import risk into San Diego Locations are colored as in panel D, with gray representing all locations outside the top five locations.
Figure 5.
Figure 5.. Mobility changes in North America.
(A) Mean weekly number of travelers traveling between each county in the US. Scatter points, in blue, indicate raw measurements. Temporal trend and 95% confidence intervals, indicated by the solid black line and shaded area, were calculated by bootstrapping LOESS regression 1000 times. Temporal trend from 2019 is transposed to 2020-2021, dashed line and shading, in order to visualize changes independent of season. (B) Mean weekly distance traveled by travelers in the US. Scatter points indicate raw measurements, while temporal trend and 95% confidence intervals were calculated by bootstrapping LOESS regression 1000 times. As with A, temporal trend from 2019 is transposed to 2020-2021, dashed line and shading, in order to visualize changes independent of season. (C) Distribution in Pearson correlation coefficients between mobility and PhyloSor similarity for each US location pair included in the PhyloSor analysis (see Methods). Dashed line labels the percentage of location pairs with a correlation coefficient greater than 0 (84.4%). (D) Primary axis, in blue, shows the weekly correlation between the stringency of the US government’s response to COVID-19 and the mean number of pairwise trips between US counties. Secondary axis, in green, shows the correlation between stringency and the mean distance traveled. For both axes, strength of correlation was determined using Pearson correlation coefficient. Because the stringency index aggregates a number of response indicators, many of which have little effect on mobility, correlation was only determined for dates after the first official stay-at-home order (March 15th, 2020).
Figure 6.
Figure 6.. Impact of US-Mexico border closure.
(A) Percentage reduction in the total import risk into San Diego when travel from Mexico is held at 2019-levels compared to observed travel. (B) Plot of total counterfactual import risk (calculated using mobility estimates from 2019) vs. observed import risk. To limit the impact of variability resulting from low traveler counts, only locations with an absolute import risk greater than 10 infected travelers are shown (accounting for 45% of all locations and 99.8% of the total import risk into San Diego). The five locations with the greatest difference between the counterfactual and observed import risk are labeled, import risk from Mexico is indicated with a green point. (C) Distribution of the relative reduction from the counterfactual to the observed import risk for each location in panel B. Mexico’s relative reduction of 22.8% is indicated by the dashed vertical bar.

References

    1. Koo JR, Cook AR, Park M, Sun Y, Sun H, Lim JT, Tam C, and Dickens BL (2020). Interventions to mitigate early spread of SARS-CoV-2 in Singapore: a modelling study. Lancet Infect. Dis 20, 678–688. - PMC - PubMed
    1. Chang S, Pierson E, Koh PW, Gerardin J, Redbird B, Grusky D, and Leskovec J (2021). Mobility network models of COVID-19 explain inequities and inform reopening. Nature 589, 82–87. - PubMed
    1. Lucchini L, Centellegher S, Pappalardo L, Gallotti R, Privitera F, Lepri B, and De Nadai M (2021). Living in a pandemic: changes in mobility routines, social activity and adherence to COVID-19 protective measures. Sci. Rep 11, 24452. - PMC - PubMed
    1. Hill V, Plessis D, Peacock TP, Aggarwal D, Colquhoun R, Carabelli AM, Ellaby N, Gallagher E, Groves N, Jackson B, et al. (2022). The origins and molecular evolution of SARS-CoV-2 lineage B.1.1.7 in the UK. Virus Evol 8, veac080. - PMC - PubMed
    1. McCrone JT, Hill V, Bajaj S, Pena RE, Lambert BC, Inward R, Bhatt S, Volz E, Ruis C, Dellicour S, et al. (2022). Context-specific emergence and growth of the SARS-CoV-2 Delta variant. Nature 610, 154–160. - PMC - PubMed

Publication types