. 2023 Dec 15;14(1):8372.
doi: 10.1038/s41467-023-44081-6.

BRD9 determines the cell fate of hematopoietic stem cells by regulating chromatin state

Affiliations

BRD9 determines the cell fate of hematopoietic stem cells by regulating chromatin state

Muran Xiao et al. Nat Commun. .

Abstract

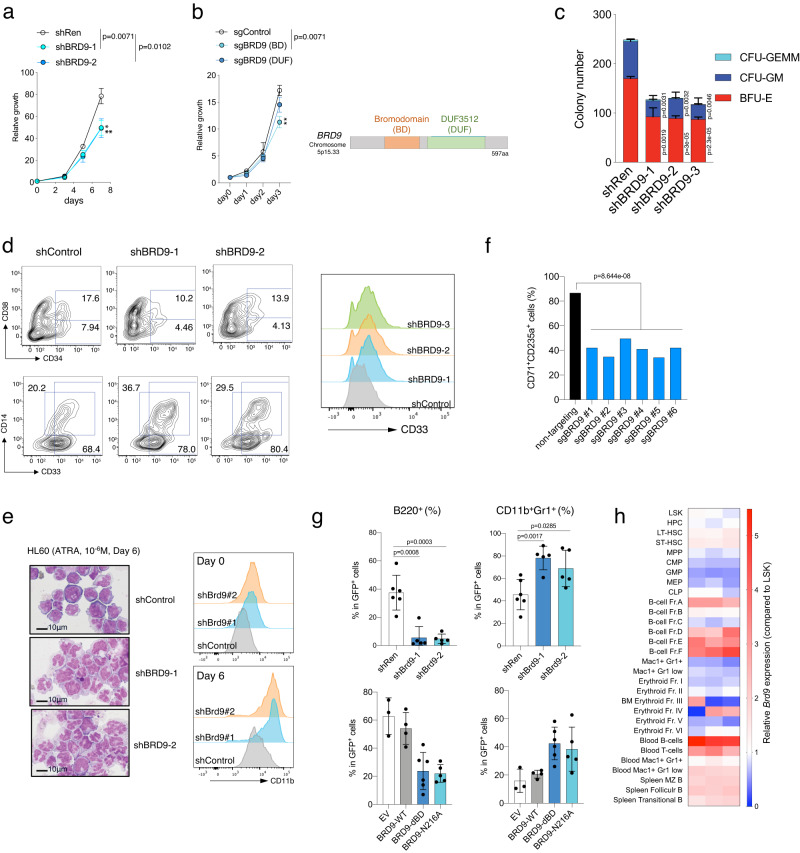
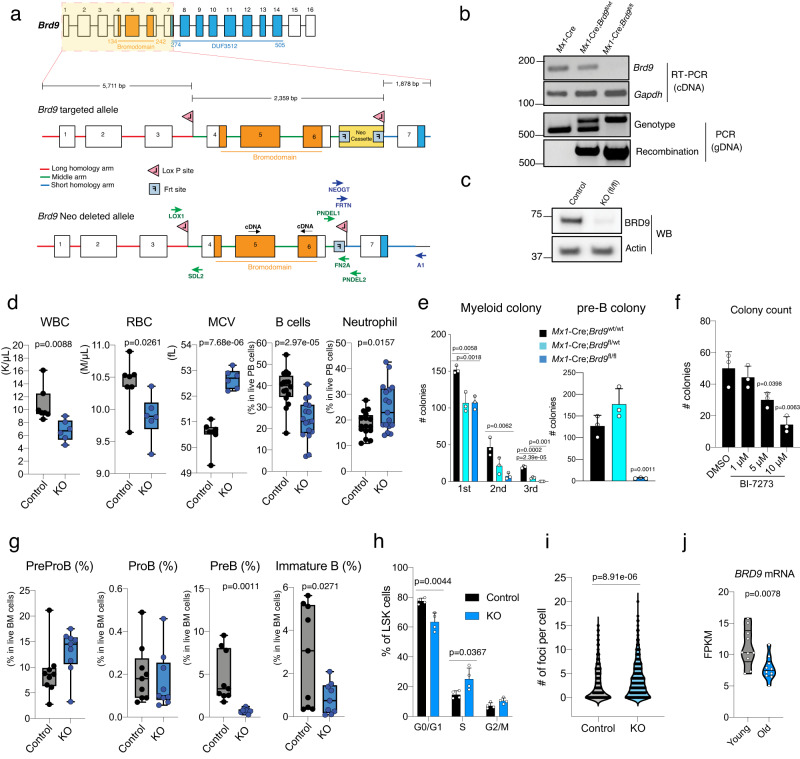
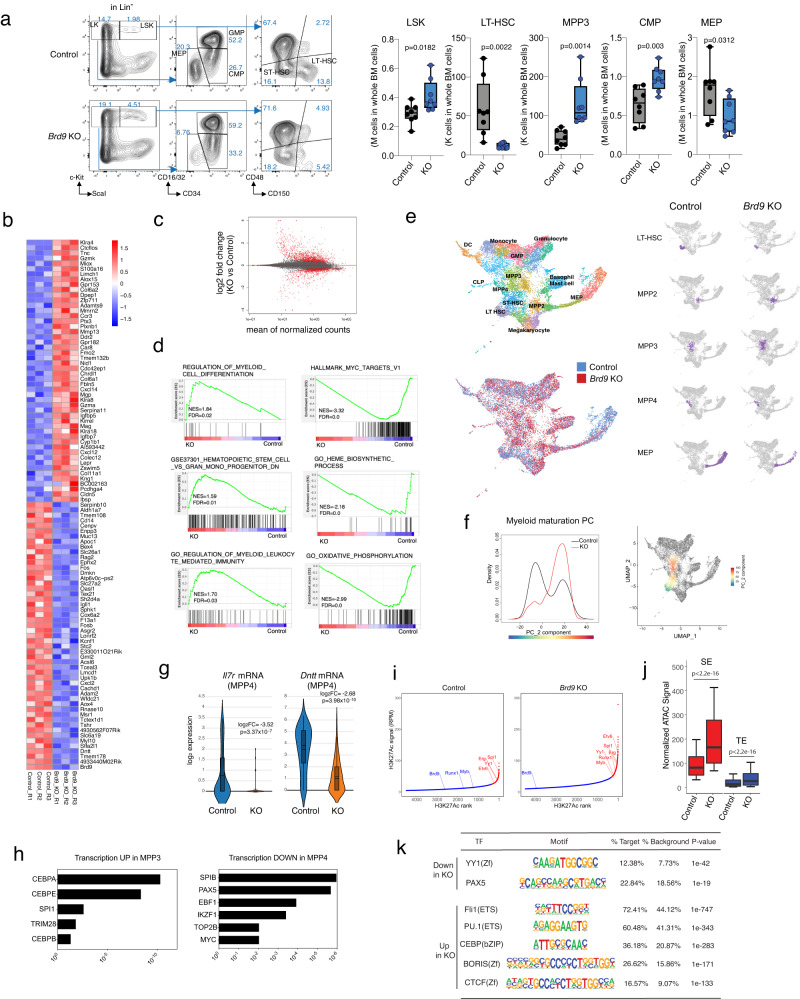
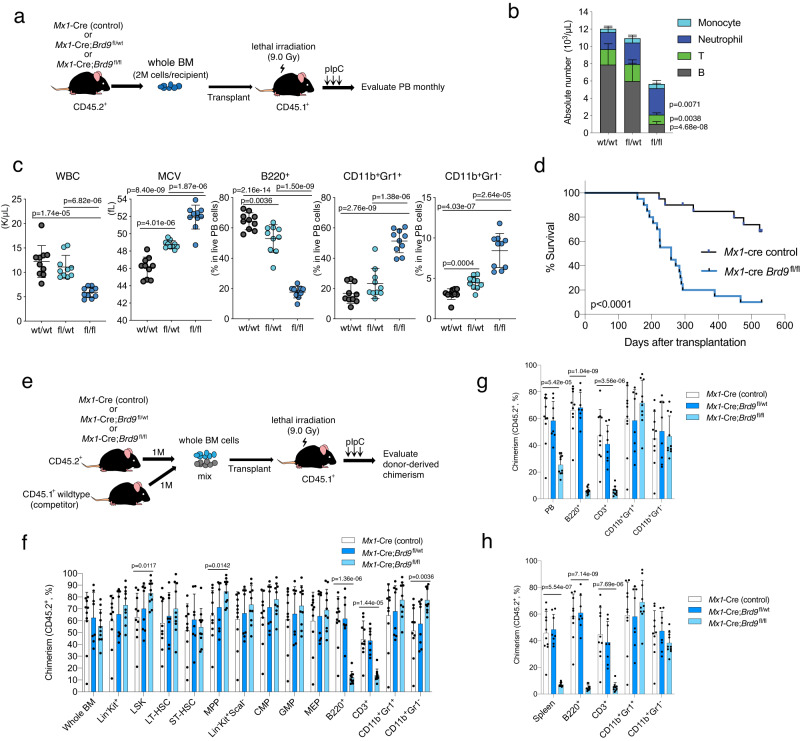
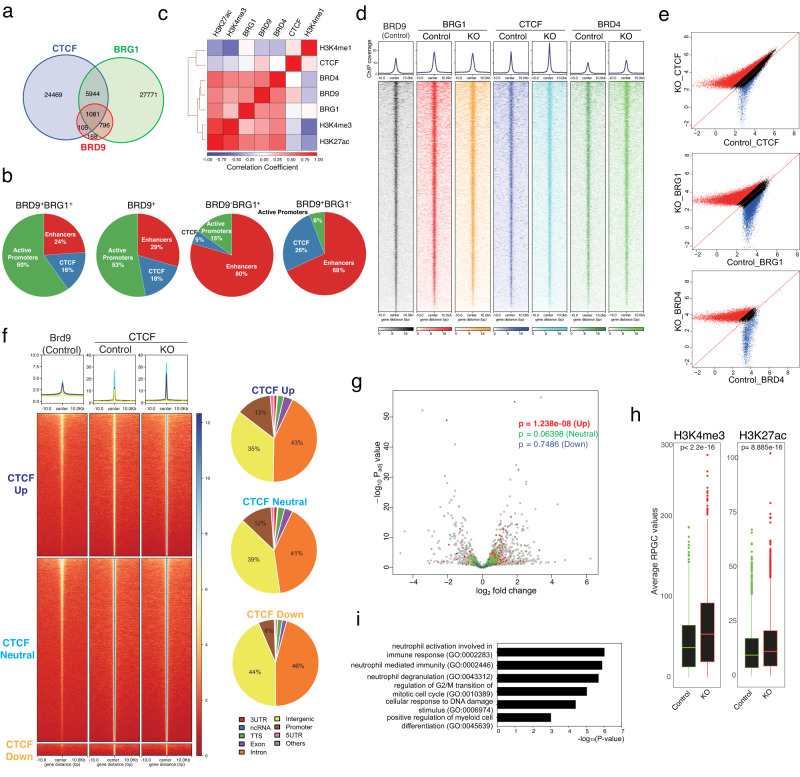
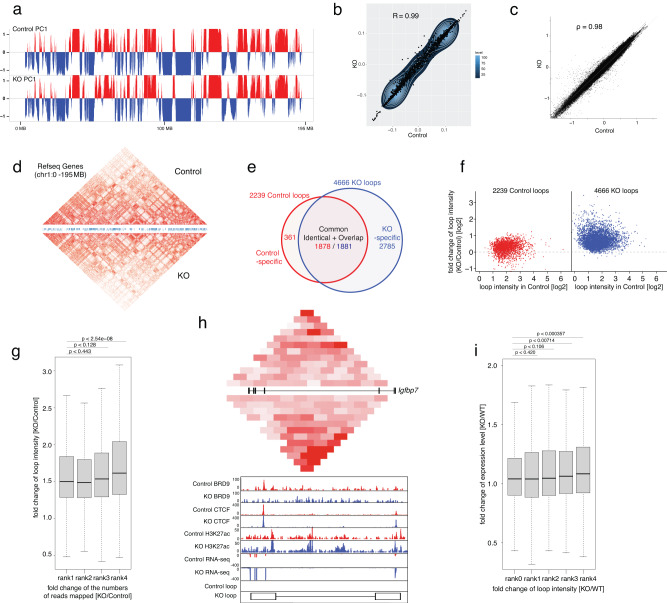
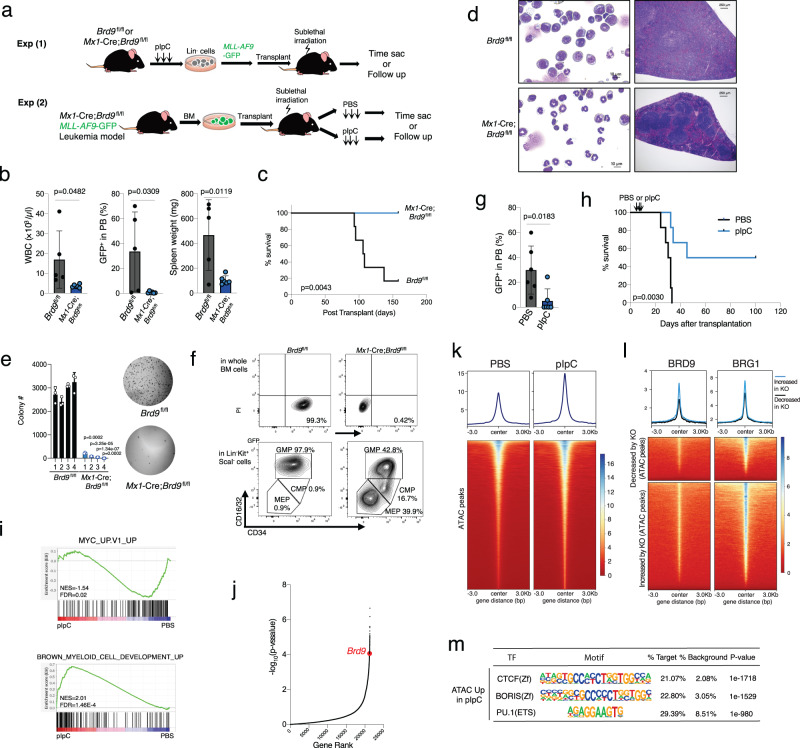
ATP-dependent chromatin remodeling SWI/SNF complexes exist in three subcomplexes: canonical BAF (cBAF), polybromo BAF (PBAF), and a newly described non-canonical BAF (ncBAF). While cBAF and PBAF regulate fates of multiple cell types, roles for ncBAF in hematopoietic stem cells (HSCs) have not been investigated. Motivated by recent discovery of disrupted expression of BRD9, an essential component of ncBAF, in multiple cancers, including clonal hematopoietic disorders, we evaluate here the role of BRD9 in normal and malignant HSCs. BRD9 loss enhances chromatin accessibility, promoting myeloid lineage skewing while impairing B cell development. BRD9 significantly colocalizes with CTCF, whose chromatin recruitment is augmented by BRD9 loss, leading to altered chromatin state and expression of myeloid-related genes within intact topologically associating domains. These data uncover ncBAF as critical for cell fate specification in HSCs via three-dimensional regulation of gene expression and illuminate roles for ncBAF in normal and malignant hematopoiesis.


Conflict of interest statement

O.A.-W. has served as a consultant for H3B Biomedicine, Foundation Medicine Inc, Merck, and Janssen, Loxo Oncology/Lilly and is on the Scientific Advisory Board of Envisagenics Inc and Harmonic Discovery Inc.; O.A.-W. has received prior research funding from H3B Biomedicine, Loxo Oncology/Lilly, Minovia Therapeutics, and Nurix Therapeutics unrelated to the current manuscript. D.I. has received prior research funding from Abbvie and Sumitomo Dainippon Pharma unrelated to the current manuscript. The remaining authors declare no competing interests.

Figures

Fig. 1
Fig. 1. BRD9 is required for normal differentiation and stemness of HSCs.
a The number of viable human CD34+ cord blood cells over the course of 7 days, beginning 3-days post-transduction of shRNAs. n = 3 independent experiments; error bars, means ± s.e.m. b The number of K562 cells with sgControl, sgBRD9 targeting bromodomain (BD) or domain of unknown function (DUF), over the course of 3 days. The domain structure of wild-type BRD9 is indicated (right). n = 3 independent experiments; error bars, means ± s.e.m. c Colony formation of human CD34+ cord blood transduced with a scramble (control) or BRD9 targeting shRNA. Cells were sorted on the basis of GFP positivity 3 days after lentiviral transduction and colonies were scored 10 days after plating in methylcellulose. n = 3 independent experiments; mean and s.e.m are plotted. d Expression of the surface markers for HSCs (CD34 and CD38) and for myeloid differentiation (CD11b and CD14), as assessed by flow cytometry 10 days after plating under the condition with the supplement for CD34 expansion and myeloid differentiation. The proportion of CD34+, CD34+CD38, CD33+, and CD14+ are indicated. Representative histograms of CD33 staining in shControl and shBRD9 HSCs are shown on the right. e Representative cytospin images (left) and histograms of CD11b staining (right) in HL60 cells with shControl and shBRD9 after all-trans retinoic acid (ATRA) treatment (10−6M) for 6 days (n = 3 independent experiments). Bar: 10 µm. f The proportion of CD71+CD235a+ cells in K562 cells with BRD9 KO after hemin treatment for 3 days. Two sgRNAs and three independent single cell clones per sgRNA were used. g Frequency of B220+ (left) and CD11b+Gr1+ (right) cells in GFP+ donor-derived peripheral blood cells in the transplant model of normal BM cells transduced with shRen (shControl, n = 6 independent samples), shBrd9 (n = 6 independent samples), empty vector (EV, n = 3 independent samples), BRD9-WT (n = 4 independent samples), dBD (n = 6 independent samples), and N216A mutants (n = 5 independent samples). Error bars, means ± s.e.m. h Heatmap of Brd9 mRNA expression evaluated quantitative RT-PCR in each hematopoietic stem and progenitor cells (HSPCs) and mature cells. The relative expression levels against that of LSK are shown. Two-tailed Student’s t test. Source data are provided as a Source Data file.
Fig. 2
Fig. 2. Generation and characterization of Brd9 knockout murine model.
a Target scheme for Brd9 conditional knockout (cKO) mice. Brd9 targeted alle and Brd9 Neo Cassette deleted allele are indicated. Primers were designed for confirming LoxP insertion, Neo Cassette deletion, and genotyping. b Successful deletion and recombination of Brd9 in the cKO bone marrow (BM) 4 weeks post-pIpC injections. PCR by using cDNA and genomic DNA from pIpC-treated mice bone marrow cells to validate Brd9 exon 4–6 deletion (Representative images of n = 3 independent experiments). Primers PNDEL1/PNEDL2 and LOX1/PNDEL2 were used for genotype and recombination, respectively. c Western blot for murine BRD9 in whole BM cells derived from pIpCed Mx1-Cre;Brd9WT/WT (Control) mice and Mx1-Cre;Brd9fl/fl mice cKO (fl/fl) mice (Representative images of n = 3 independent experiments). d Brd9 cKO mice developed a cytopenia phenotype with macrocytosis 3 months post-pIpC. Whole blood counts of white blood cells (WBCs), red blood cells (RBCs), and mean corpuscular volume (MCV) and frequency of B cells and neutrophils in Mx1-Cre;Brd9WT/WT (Control) mice and Mx1-Cre;Brd9fl/fl mice cKO (KO) mice. n = 6 each in WBC, RBC, and MCV; n = 16 (Control) and n = 17 (KO) in B cells and Neutrophils, both males and females. For box and whiskers plots throughout, bar indicates median, box edges first and third quartile values, and whisker edges minimum and maximum values. p value relative to control by a two-sided t-test. e Colony formation of whole BM cells. Colonies were scored 10 days after plating in methylcellulose in M3434 and M3630, for myeloid colonies and pre-B colonies, respectively. n = 3 independent experiments; mean and s.e.m are plotted. Statistical significance was calculated with two-tailed unpaired t-test. f Colony formation of wildtype whole BM cells treated with DMSO and BI-7273 (BRD9 bromodomain inhibitor) for 24 h, respectively. Colonies were scored 10 days after plating in methylcellulose M3630 for Pre-B colonies. n = 3 independent experiments; mean and s.e.m are plotted. p value relative to control by a two-sided t-test. g Frequency of PreProB, ProB, PreB, and Immature B cells in BM of 24-week-old Mx1-Cre;Brd9WT/WT (Control) mice and Mx1-Cre;Brd9fl/fl mice cKO (KO) mice. n = 9 each, both males and females. For box and whiskers plots, bar indicates median, box edges first and third quartile values, and whisker edges minimum and maximum values. p value relative to control by a two-sided t-test. h Percentages of bromodeoxyuridine (BrdU)+ (S), DAPI+BrdU (G2/M), DAPI-BrdU- (G0/G1) LSK cells in the BM of primary 12-week-old Brd9 KO and control mice. n = 4 independent experiments, males; mean and s.e.m are plotted. p value relative to control by a two-sided t-test. i The number of foci in gH2AX (a marker of DNA damage)-staining of Brd9 KO and control LinKit+ cells. p values were calculated relative to the control group by two-sided t-tests and are indicated in the figures. j BRD9 mRNA levels in young and old human LinCD34+CD38 cells (n = 10 per age group). p value relative to control by a two-sided t-test. Source data are provided as a Source Data file.
Fig. 3
Fig. 3. BRD9 loss transcriptionally alters the cell fate specification of HSCs in vivo.
a FACS analysis and gating strategy of BM cells from representative primary mice for evaluating the ratio of stem and progenitor fraction. Box-and-whisker plots of numbers of LSK, LT-HSCs, MPP3, CMPs, and MEPs in BM of primary 6-month-old Brd9fl/fl (Control) and Mx1-Cre;Brd9fl/fl (KO). n = 8 independent samples, both males and females; error bars, means ± s.e.m. For box and whiskers plots, bar indicates median, box edges first and third quartile values, and whisker edges minimum and maximum values. p value relative to control by a two-sided t-test. b Heatmap showing the top 50 up- or down-regulated genes evaluated by RNA-seq in BRD9 KO HSPCs. c MA plot showing differentially expressed genes (adjusted p value < 0.1). p values were obtained by applying Wald test to absolute values of log2FC and adjusted using the Benjamini-Hochberg correction. d GSEA enrichment plot for dysregulated genes in RNA-seq of KO vs. Control. e Identification of different hematopoietic clusters in Control and KO LincKit+ cells base on UMAP analysis from single-cell RNA sequencing (scRNA-seq). The estimated fractions of stem, progenitor, and mature cells are labeled and highlighted. f Cellular densities along Myeloid maturation PC and the scaled values of the maturation PC visualized on UMAP space. g The violin plots of Il7r and Dntt mRNA expression in the indicated cluster, where 158 and 148 cells belong to Control and KO, respectively. Box plot and kernel density plot of log2 expression values are shown. p values were obtained by negative binomial test and adjusted using the Benjamini-Hochberg correction. In the box-and-whisker plots, the 0th, 25th, 50th, 75th and 100th percentiles and mean (dashed lines) are shown. h Transcriptional factor motif analysis of genes upregulated in MPP3 (left) and downregulated in MPP4 (right) of KO mice. p values are indicated and generated via Enricher. i Enhancers ranked by H3K27ac ChIP-seq signals in HSPCs of Control and KO mice. SEs (red) and TEs (blue) were identified using HOMER software. j Normalized ATAC-seq signal (RPGC) at SE and TE (detected with HOMER fdr <0.001) in HSPCs. One biologically independent sample in each group was used. Results of additional biologically independent samples are shown in Supplementary Fig. 5f. The p values were obtained by two-sided Wilcoxon rank sum test. In the box-and-whisker plots, the 10th, 25th, 50th, 75th and 90th percentiles are shown. k Transcriptional factor motif analysis of typical enhancers (TE) by comparing TE peaks between Control and KO HSPCs. Source data are provided as a Source Data file.
Fig. 4
Fig. 4. BRD9 loss disturbs the cell fate of HSCs in a cell-autonomous fashion.
a Schema of non-competitive BM transplantation assays. b Absolute number of B220+, CD3+, CD11b+Gr1+, CD11b+Gr1 cells in the PB of each group. n = 10 independent samples; mean and s.e.m are plotted. p value relative to control by a two-sided t-test. c Plots of WBC, MCV, and the proportion of B220+, CD11b+Gr1+, and CD11b+Gr1 cells in PB of recipient mice. n = 10 independent samples; error bars, means ± s.e.m. Statistical significance was calculated with two-tailed unpaired t-test. d Kaplan-Meier survival of each recipient group. p value was calculated by log-rank test. e Schema of competitive BM transplantation assays. Percent of donor-derived (CD45.2+) cells of each indicated population in BM (f), PB (g), and spleen (h) following 5 months of transplantation. n = 10 independent samples in Mx1-cre control and Mx1-cre;Brd9fl/fl group, n = 8 independent samples in Mx1-cre;Brd9fl/wt group (both males and females). Mean and s.e.m are plotted. p values were calculated by two-sided t-test. Source data are provided as a Source Data file.
Fig. 5
Fig. 5. BRD9 loss enhances CTCF localization resulting in active transcription.
a Venn diagram of peaks from BRD9, BRG1, and CTCF evaluated by ChIP-seq experiments. b The proportion of BRD9+BRG1+(ncBAF), BRD9+ (ncBAF + ncBAF-independent BRD9 targets), BRD9-BRG1+ (BAFs other than ncBAF) and BRD9+BRG1 (ncBAF-independent BRD9 targets) peaks at CTCF, active promoters and enhancers. c Heatmap representing the correlations between average ChIP-seq reads (log2[reads per genome coverage (RPGC)]) over a merged set of BRD9, BRG1, CTCF, BRD4, H3K4me1, H3K4me3, and H3K27ac peaks. d The average ChIP enrichment profile of BRD9, BRG1, CTCF, and BRD4. Heatmap illustrating the ChIP-seq signal 10 kb up and downstream at BRD9 peaks (q < 0.05). e Scatterplot of log2 average RPGC values of CTCF, BRG1, and BRD4 in control vs. KO condition (Red and Blue: ratio of average RPGC values > 1.5, Black: otherwise). f The average ChIP enrichment profile of BRD9 and CTCF (top) over the peak regions in three groups: CTCF Up (dark blue, fold change >1.5), CTCF Neutral (light blue, 1.5 ≥ fold change ≥ 1/1.5), and CTCF Down (yellow, fold change <1/1.5) in KO compared to Control. Heatmap illustrating the ChIP-seq signal 10 kb up and downstream. The genomic distribution of each group is shown on the right. g Volcano plot of DEGs in Brd9 KO HSPCs. Genes whose promoter-TSS sites locate on CTCF peaks in CTCF Up (red), CTCF Neutral (green), CTCF Down (blue) are highlighted and p values of two-sided t-test were indicated. h Correlation between the active histone marks (H3K4me3, left; H3K27ac, right) and the promoter-located CTCF peaks of CTCF Up group in Control and KO conditions. One biologically independent sample in each group was used. p values of two-sided t-test were indicated. In the box-and-whisker plots, the lower and upper hinges correspond to the 25th and 75th percentiles. The whiskers extend from the hinges to the values no further than 1.5 x the inter-quartile ranges. Data points beyond the whiskers are shown as dot plots. i GO terms enrichment of the promoter-located CTCF peaks of CTCF Up group. p values are generated via Enricher. Source data are provided as a Source Data file.
Fig. 6
Fig. 6. The roles of BRD9/CTCF in chromatin three-dimensional organization.
a The global arrangement of active (red) and inactive (blue) compartments on chr1 in Control (top panel) and KO (second panel) cells. b Genome-wide comparison of the eigenvector values between Control (x axis) and KO (y axis) cells. c Genome-wide comparison of the insulation scores between Control (x axis) and KO (y axis) cells. d Comparison of TADs between Control and KO cells. A heatmap of the Knight-Ruiz balanced observed/expected interaction frequencies (loop intensities) on chr1 as (a) is compared between Control (upper portion) and KO (lower portion) cells. e Numbers of the chromatin loops detected in Control and KO cells. The numbers of common (identical and overlapped i.e., both anchors overlap), Control-specific and KO-specific loops are shown. f Fold change of loop intensities from Control to KO cells of chromatin loops detected in Control (left, red) and KO (right, blue) cells. X and y axes represent the loop intensities detected in Control and the fold change of loop intensities (KO/Control), respectively. g Relationship between loop intensity and CTCF enrichment in loop anchors. A boxplot of fold changes of loop intensities in KO relative to Control cells (KO/Control) for four groups of loops showing distinct levels of fold change of CTCT enrichment in KO relative to Control cells (KO/Control) is shown. The 5027 loops in the default set were ranked by the fold change of CTCT enrichment from low to high in rank 1 to rank 4 (each ~1257 loops). Hereinafter, the exact p values computed by two-sided Mann–Whitney tests are presented, and in each boxplot, bar indicates median, box edges first and third quartile values, and whisker edges minimum and maximum values. h Comparison of the profiles of contact frequencies, BRD9, CTCF, H3K27ac, and transcription around Igfbp7 locus between Control and KO samples. The combined mapping data presents HiC interaction frequencies, ChIP-seq profiles of BRD9, CTCF, and H3K27ac, and RNA expression on Igfbp7 locus in both Control and KO. The balanced HiC two-dimensional contact matrix is compared between Control (above) and KO sample (below) in top panel. The exon and intron structure of Igfbp7 is given in between. The color intensity presents represents level of interaction frequency computed at 5 kb resolution. ChIP-seq and RNA-seq profiles are presented below. The positions of loop anchors are shown at the bottom. The maximum y-axis value of ChIP-seq or RNA-seq signal is set as indicated. i Relationship between gene expression and loop intensity. A boxplot of fold changes of the expression level of one group of non-loop anchored genes and four groups of loop-anchored genes showing distinct levels of fold changes of loop intensities in KO relative to Control cells (KO/Control) is shown. In total, 1998 genes expressed (FPKM ≥ 0.5) in Control or KO cells were anchored by 1681 loops. A total of 2359 combinations of genes and loops were ranked by the fold change of loop intensities from low to high in rank 1 to rank 4 (each ~590 combinations). Rank 0 represents a group of 2402 non loop anchored genes, located outside of loops (of similar expression levels in Control and KO cells) The p values of rank 1 to 4 were computed against rank 0. The results here are based on biological triplicate of HiC, biological duplicate of BRD9, CTCF, and H3K27ac ChIP, and biological triplicate of RNA-seq datasets for each Control and KO sample. Source data are provided as a Source Data file.
Fig. 7
Fig. 7. BRD9 loss inhibited leukemia development and maintenance in vivo.
a Schema of two different transplant models for the development (Experiment 1) and the maintenance (Experiment 2) of MLL-AF9-induced AML. b WBC count, GFP+ rate in the PB, and spleen weight of Brd9fl/fl (n = 5 independent samples, males) and Mx1-Cre;Brd9fl/fl (n = 6 independent samples, males) recipient mice in Experiment 1. Error bars, means ± s.e.m. p value relative to control by a two-sided t-test. c Kaplan-Meier survival of each recipient group. p value was calculated by log-rank test. d Representative images of the BM cytospin (left) and spleen (right). Bar: 10 µm (left), 250 µm (right). e The number of colonies serially replated in methylcellulose M3434 (left). n = 3 independent experiments; mean and s.e.m are plotted. p value relative to control by a two-sided t-test. Representative images (right) of the second colony. f Representative FACS plots of data of GFP+ cells and of GMP, CMP, and MEP in Linc-Kit+ScaI cells. g GFP positive rate in the PB live cells 14 days after pIpC injection. n = 6 independent samples, males; Error bars, means ± s.e.m. p value relative to control by a two-sided t-test. h Kaplan–Meier survival of each recipient group in Experiment 2 (PBS vs. pIpC). p value was calculated by log-rank test. i GSEA enrichment plot for MYC and myeloid development-associated genes in RNA-seq of pIpC-treated group vs. PBS-treated group. j Rank plot for the −log10 (p value) associated with each sgRNA in the screen using the murine AML model and negative-enrichment whole-genome CRISPR–Cas9 pooled lentiviral screen (p values were calculated using a Wilcoxon matched-pairs signed rank test). k The average ATAC peaks enrichment profile in PBS or pIpC-treated MLL-AF9 GFP+ BM cells. Heatmap illustrating the ChIP-seq signal 3 kb up and downstream. l The average ChIP enrichment profile of BRD9 and BRG1 in the cluster of decreased by KO (top) and increased by KO (bottom) shown in Supplementary Fig. 4f. m Transcriptional factor motif analysis of increased ATAC peaks in pIpC-treated KO group. Source data are provided as a Source Data file.

References

    1. Narlikar GJ, Sundaramoorthy R, Owen-Hughes T. Mechanisms and functions of ATP-dependent chromatin-remodeling enzymes. Cell. 2013;154:490–503. doi: 10.1016/j.cell.2013.07.011. - DOI - PMC - PubMed
    1. Lickert H, et al. Baf60c is essential for function of BAF chromatin remodelling complexes in heart development. Nature. 2004;432:107–112. doi: 10.1038/nature03071. - DOI - PubMed
    1. Priam P, et al. SMARCD2 subunit of SWI/SNF chromatin-remodeling complexes mediates granulopoiesis through a CEBPvarepsilon dependent mechanism. Nat. Genet. 2017;49:753–764. doi: 10.1038/ng.3812. - DOI - PubMed
    1. Witzel M, et al. Chromatin-remodeling factor SMARCD2 regulates transcriptional networks controlling differentiation of neutrophil granulocytes. Nat. Genet. 2017;49:742–752. doi: 10.1038/ng.3833. - DOI - PMC - PubMed
    1. Alpsoy A, Dykhuizen EC. Glioma tumor suppressor candidate region gene 1 (GLTSCR1) and its paralog GLTSCR1-like form SWI/SNF chromatin remodeling subcomplexes. J. Biol. Chem. 2018;293:3892–3903. doi: 10.1074/jbc.RA117.001065. - DOI - PMC - PubMed

Publication types

MeSH terms

Associated data