. 2023 Dec 15;14(1):8354.
doi: 10.1038/s41467-023-43961-1.

Prion protein conversion at two distinct cellular sites precedes fibrillisation

Affiliations

Prion protein conversion at two distinct cellular sites precedes fibrillisation

Juan Manuel Ribes et al. Nat Commun. .

Abstract

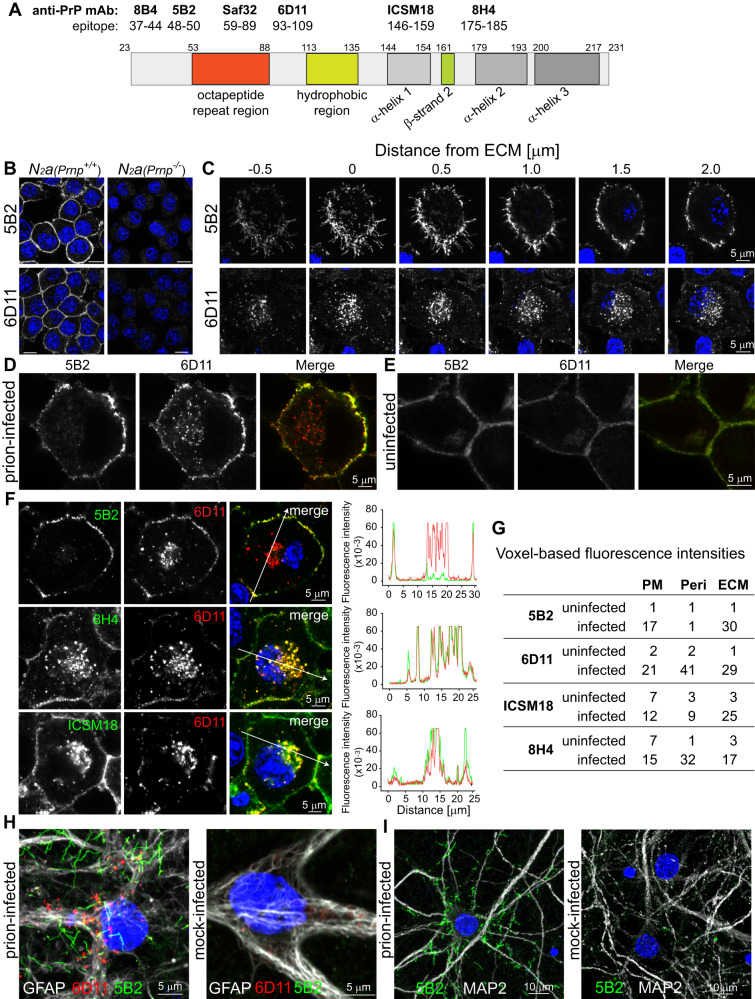
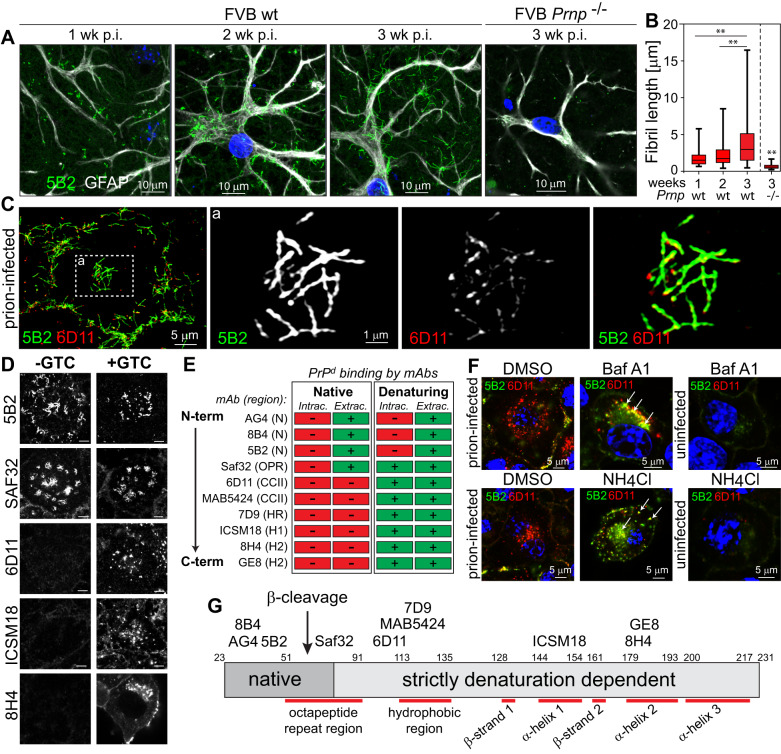
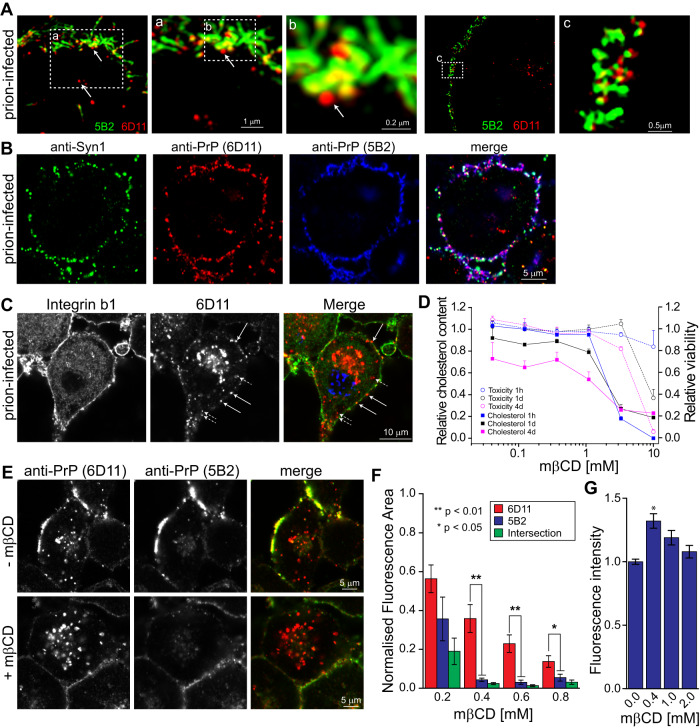
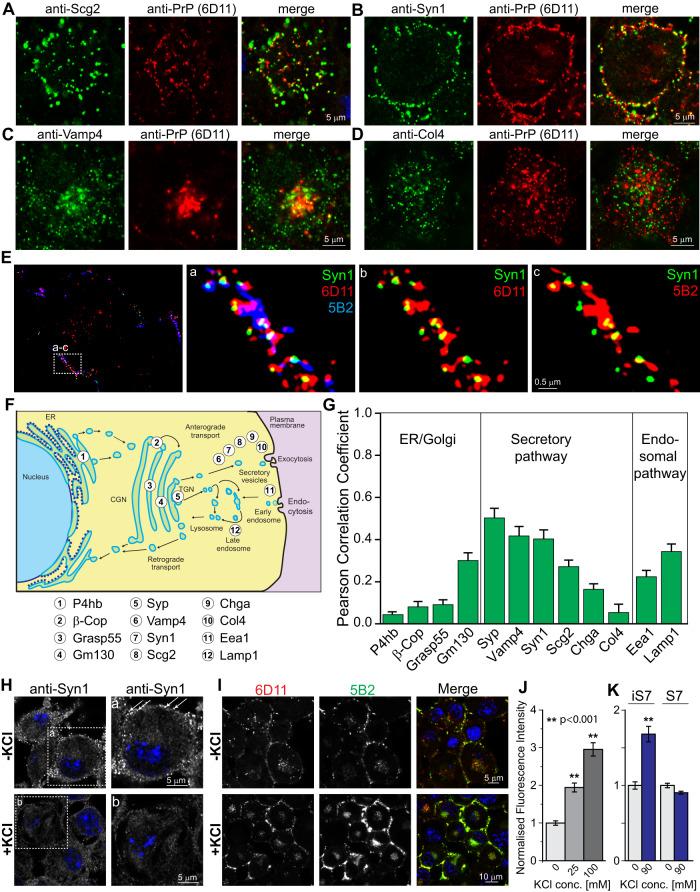
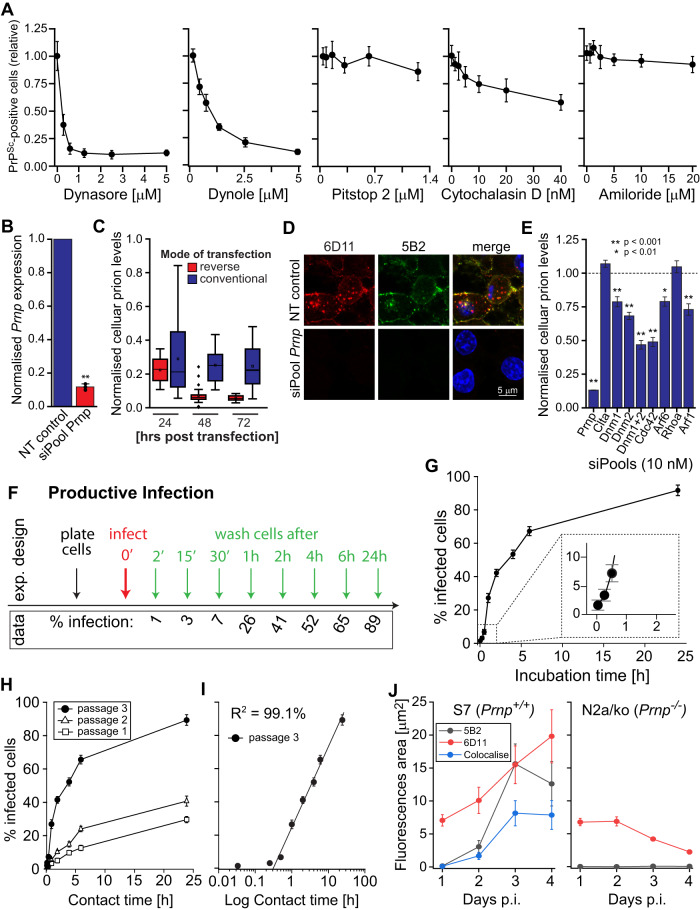
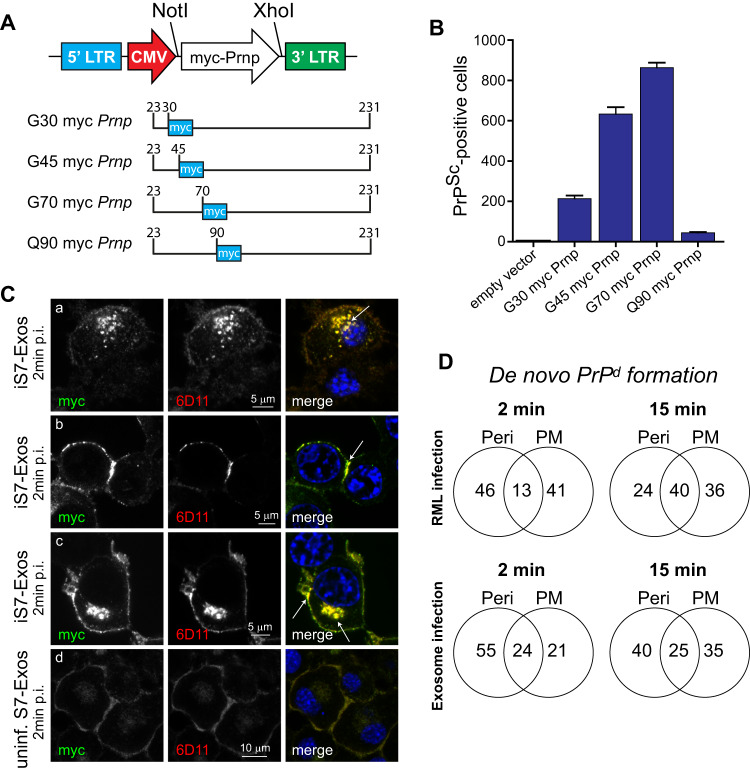
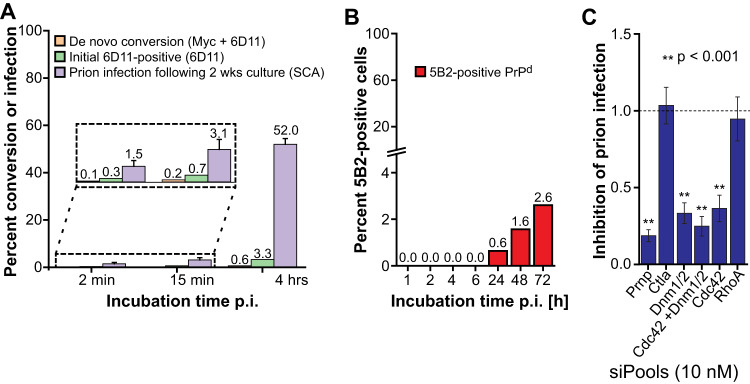
The self-templating nature of prions plays a central role in prion pathogenesis and is associated with infectivity and transmissibility. Since propagation of proteopathic seeds has now been acknowledged a principal pathogenic process in many types of dementia, more insight into the molecular mechanism of prion replication is vital to delineate specific and common disease pathways. By employing highly discriminatory anti-PrP antibodies and conversion-tolerant PrP chimera, we here report that de novo PrP conversion and formation of fibril-like PrP aggregates are distinct in mechanistic and kinetic terms. De novo PrP conversion occurs within minutes after infection at two subcellular locations, while fibril-like PrP aggregates are formed exclusively at the plasma membrane, hours after infection. Phenotypically distinct pools of abnormal PrP at perinuclear sites and the plasma membrane show differences in N-terminal processing, aggregation state and fibril formation and are linked by exocytic transport via synaptic and large-dense core vesicles.


Conflict of interest statement

The authors declare no competing interests.

Figures

Fig. 1
Fig. 1. Identification of phenotypically distinct PrPd aggregates in prion-infected cells using monospecific anti-PrP antibodies.
A Schematic diagram of validated anti-PrP monoclonal antibodies (mAbs) and their putative epitopes on the context of mouse PrP domains. B Exemplary data for anti-PrP mAb validation using N2a (Prnp-/-) wild-type (Prnp+/+) cells. For the full data set of anti-PrP mAbs tested see Supplementary Fig. 1A. Scale bars correspond to 10 µm. C Serial confocal sections of prion-infected S7 cells, labelled with anti-PrP mAbs 5B2 and 6D11, respectively. Cells were grown for extended cultures times, i.e. 6 days (see “Methods” section, “extended TC protocol”). D, E Co-labelling of prion-infected (D) and uninfected (E) S7 cells with 5B2 and 6D11. F Detection of perinuclear PrPd by core, but not by N-terminal anti-PrP mAbs in prion-infected S7 cells. Arrows in merged images depict orientation and placement of fluorescence intensity profiles, shown at the right hand side of image panels. For complete data set with all monospecific mAbs see Supplementary Fig. 2. G MAb-dependent differences in the detection of PrPd versus PrPc, mapped as normalised voxel-based intensities in cellular loci where PrPd deposits (PM plasma membrane, Peri perinuclear region, ECM extracellular matrix). For data see Supplementary Table 2. H Glial fibrillary acidic protein (GFAP)-positive astrocytes in cultures of primary neuronal cells from embryonic e17 mouse brains, infected with 10−5 dilutions of the prion strain RML (10% brain homogenate, w/v) and uninfected CD1 (10% brain homogenate, w/v, mock), triple-labelled with 5B2, 6D11 and anti-GFAP. I Primary hippocampal neuronal cultures from embryonic e17 mouse brains were isolated, cultured for 6 days and incubated with 1 µM AraC. The following day, cells were infected with a 10−5 dilution of RML (10%, w/v) or uninfected CD1 (10%, w/v, mock-infected) brain homogenate, respectively. Three weeks after infection, cells were fixed and double-labelled with 5B2 and anti-Map2. Source data are provided as a Source Data file.
Fig. 2
Fig. 2. Elongation and structural features of fibril-like PrPd aggregates and crypticity of PrPd epitopes.
A Time-dependent growth of 5B2-positive PrPd fibrils in primary astrocytes of FVB-wt (Prnp+/+), but not in those of FVB-ko (Prnp -/-) mice, following infection with RML. B Lengths of fibril-like PrPd aggregates in FVB-wt versus FVB-ko mice. Significance levels for time-dependent fibril growth in FVB-wt (Prnp+/+) mice and for FVB-wt versus FVB-ko were assessed from 2 independent experiments with at least 30 replicates per group using Kruskal–Wallis test with Dunn’s multiple comparisons with **p < 0.001. The statistical difference in rod length between FVB-wt versus FVB-ko mice at 3 weeks was determined by unpaired Mann–Whitney U Test; ** denotes a p-value < 0.001. For definition of boxplot elements see “Methods” section. C SIM images of fibril-like PrPd aggregates at the ECM of prion-infected S7 cells, cultured according to “standard TC protocol” in “Methods” section, labelled with 5B2 and 6D11 after guanidinium thiocyanate (GTC) treatment. Magnified area (a) denoted by dashed box. D Identification of cryptic epitopes in PrPd-bearing cells. Prion-infected S7 cells were incubated with anti-PrP mAbs in absence and presence of GTC. For complete image data set see Supplementary Fig. 4. Scale bars are 5 µm. E Summary of anti-PrP mAb binding to PrPd aggregates under native (-GTC) and denaturing (+GTC) conditions with corresponding PrP domains (for abbreviations of PrP regions see Supplementary Fig. 4). F Detection of intracellular 5B2-positive PrPd aggregates following a 16 h incubation with 6 nM bafilomycin A1 (BafA1) and 16 mM ammonium chloride (NH4Cl), respectively. Arrows denote intracellular 5B2-positive PrPd aggregates. G Model depicting cryptic, exposed and putative PrP-cleavage sites, respectively (modified from Rouvinski et al.). Source data are provided as a Source Data file.
Fig. 3
Fig. 3. The formation of PrPd fibrils at the plasma membrane is associated with vesicular trafficking and is sensitive to cholesterol-lowering.
A SIM images of prion-infected S7 cells, cultured according to “standard TC protocol” in “Methods” section, double-labelled with 5B2 and 6D11 at the level of the plasma membrane. Magnified areas a, b and c are denoted by dashed boxes. Arrows denote punctate 6D11-positive PrPd in juxtaposition with 5B2-positive PrPd fibrils. Estimated lateral resolution SIM: 100 nM. B Triple-labelling of prion-infected S7 cells with anti-Syn1, 6D11 and 5B2. For quantification of colocalisation, see Fig. 4G. C Prion-infected S7 cells, labelled with anti-integrin β1 and 6D11 show PrPd aggregates proximal to (short hatched arrows) and at the level of (long straight arrows) the plasma membrane. D Dose-response relationship of mβCD on cholesterol-lowering and cell viability in prion-infected S7 cells at the time points and mβCD concentrations specified. E Colabelling of PrPd with 6D11 and 5B2 at the plasma membrane in presence and absence of 0.4 mM mβCD at 16 h following mβCD addition. F Quantification of mβCD effects on total fluorescence above threshold and colabelling of PrPd with 6D11 in red, 5B2 in blue and 6D11/5B2 intersection in green at 16 h after addition of specified inhibitor concentrations. Data is normalised to vehicle control (1.0) and represents mean and SEM. Statistical significance was determined by ANOVA. G Dose-dependent effects of mβCD on PrPc levels at the plasma membrane during a 16 h-incubation as specified in “Methods section” “Quantifying relative PrPd fluorescence intensities”. Mean values and SEM of three independent experiments are shown. Statistical significance was assessed by ANOVA with Bonferroni multiple comparison test with at least 148 images per condition analysed. * denotes p-value < 0.01. Source data are provided as a Source Data file.
Fig. 4
Fig. 4. PrPd is segregated into exocytotic vesicles of the regulated secretory pathway.
AD Persistently prion-infected S7 cells were co-labelled with 6D11 and vesicular markers (A) Scg2, (B) Syn1 and (C) Vamp4 as well as with constitutively secreted Col4 (D). E SIM image of plasma membrane, triple-labelled with Syn1, 6D11 and 5B2. Magnified areas (a–c) are denoted by a dashed box in the first image. F Diagram of marker proteins used to map trafficking routes of 6D11-positive PrPd. G Levels of colocalisation between 6D11 and organelle/vesicular markers, expressed as Person correlation coefficients. Data from two independent experiments with at least 10 per protein are shown. For representative images and gene names we refer to Supplementary Fig. 7. H Neuronal depolarisation with 25 mM KCl led to rapid depletion of Syn1-positive vesicles in S7 cells. Cells were fixed at 5 min after incubation with KCl. Arrows in magnified areas denote synaptic vesicles. I Increased levels of co-labelled PrPd aggregates at the plasma membrane, following KCl-evoked depolarisation. Cells were fixed at 5 min after incubation with KCl. J Quantitative changes of co-labelled PrPd after depolarisation in dependence of the KCl concentration normalised to untreated cells from three independent experiments with at least 36 replicates per condition. For statistical analysis, ANOVA with Bonferroni correction for multiple comparisons was conducted. K Quantitative changes in surface PrP levels after KCl-evoked depolarisation in uninfected S7 versus prion-infected iS7 cells. Following fixation, cells were stained with anti-PrP antibody 8H4. Data from three independent experiments with at least 48 images per experiment were analysed. Data represent mean values ± SEM. Statistical significance was evaluated by Student’s t-test (p < 0.01). Source data are provided as a Source Data file.
Fig. 5
Fig. 5. Identification of PrPd internalisation pathways and the minimum contact time for productive cell infection.
A Persistently prion-infected S7 cells were incubated with endocytosis inhibitors for 3 days and changes in prion levels were determined. Mean values ± SEM of at least three independent experiments are shown (n = 12). For toxic threshold levels, SCA data and significance levels see Supplementary Tables 3 and 4. B Gene silencing of Prnp in S7 cells using pooled siRNA, determined by RT-qPCR; mean values + SD of three independent experiments shown (p < 0.01). C Time-dependent effect of Prnp silencing on prion levels following conventional (blue bars) and reverse (red bars) transfection of cells from two independent experiments. For definition of boxplot elements see “Methods” section. D Effect of Prnp knockdown on PrPd aggregates in chronically infected cells following reverse transfection with siPools against Prnp and a NT control. E Silencing of gene targets associated with endocytosis in persistently infected S7 cells and its effect on prion levels. For knockdown efficacies and gene names see Supplementary Table 5. F Schematic for assessing the minimum contact time for productive prion infection. S7 cells were plated out in parallel and infected with clarified RML homogenates (see “Methods” section “Minimum contact time for productive infection”) at a 10−4 dilution (v/v, red arrow), followed by gentle washing of cells with PBS at the specified time points (green arrows) to remove inoculum. Cells were grown to confluence and the proportion of infected cells determined. G Proportion of prion-infected S7 cells, determined by SCA, plotted against contact times after infection with RML. Inset: magnified area of the proportion of infected cells at early time points, 2′, 15′ and 1 h. H Relationship between contact time and proportion of infected cells following infection with RML during subsequent cell passages. I Replotted data from (G) as a semi-logarithmic (linear-log) graph. J Prion replication-permissive (S7) and -refractory (N2a/ko) cells were infected with prion-infected exosomes and the formation of 6D11-, 5B2-positive and double-positive PrPd determined. Data represent average values ± SD of three independent experiments. Source data are provided as a Source Data file.
Fig. 6
Fig. 6. Prion infection leads to PrP conversion at two distinct cellular locations.
A Cloning of N-terminal versions of myc-tagged Prnp into the retroviral vector pLNCX2. The position of insertion of the myc tag is depicted. Prnp chimera were expressed in PK1-10 Si8 Prnp double-knockdown cells (see “Methods” section). B Comparative susceptibilities of myc-tagged Prnp expressing cells after infection with a 10−4 dilution of RML prions (titre: 108.4 LD50 units/g). An empty vector confirms that cells transcriptionally silenced with hairpins against the 3’UTR of Prnp are refractory to prion infection. Data represents one experiment with 12 repeats. C G70 PrP-expressing cells, fixed at 2 min following infection with infected exosomes were colabelled with AF488-conjugated anti-myc and the discriminatory 6D11 mAbs. Detection of myc PrPd at distinct cellular locations is depicted by arrows in merged images: perinuclear (A), plasma membrane (B), perinuclear and plasma membrane (C) and mock-infected control cells (D). D Identifying the cellular sites of de novo conversion. Detection of de novo converted PrP in G70 PrP expressing cells at 2 min and 15 min after infection with RML and exosomes at perinuclear sites (Peri), the plasma membrane (PM), or both sites as represented by Venn diagrams in percent of total. At least 50 myc PrPd positive cells were analysed per condition by three investigators. Data represent the percentage occurrence of PrP conversion at the specified cellular loci. Source data are provided as a Source Data file.
Fig. 7
Fig. 7. De novo PrP conversion precedes the formation of FL-PrPd and is inhibited by transcriptional silencing of Cdc42 and dynamins.
A Quantitative analysis of contact times against the proportion of cells with evident de novo PrP conversion (Myc + 6D11) and initially infected (6D11) cells, respectively. G70 PrP-expressing cells were infected with RML for the specified times (post infection: p.i.), gently washed to remove the inoculum, fixed and labelled. For comparison, the proportion of infected cells after two weeks of tissue culture following exposure with prions at the specified contact times, data reblotted from Fig. 5G, are shown (violet bars). Mock-infected background-corrected data from 81 frames of about 60 cells per frame were scored as specified in “Methods” section. B Relationship between cell contact times after RML infection and the detection of 5B2-positive FL-PrPd. G70 PrP-expressing cells were infected with RML brain homogenate at a 10−4 dilution for the time periods specified above. Cells were subsequently fixed and labelled with 5B2 and 6D11, followed by fluorescence conjugated secondary antibodies. As above, the number of double-positive cells was scored. C Inhibition of prion infection by gene silencing of dynamins and Cdc42. G70 myc Prnp-expressing cells were transfected with siPools against the specified targets, followed by infection with exosomes. Levels of prion infection were determined from 4 independent experiments with at least 24 replicates per gene target by SCA and expressed as mean values ± SEM, relative to cells transfected with non-targeting control (1.0 ± 0.013). For statistical analysis Kruskal–Wallis test with Dunn’s multiple comparisons was conducted (**p < 0.001). For gene names see Supplementary Table 5. Source data are provided as a Source Data file.

References

    1. Griffith JS. Self replication and scrapie. Nature. 1967;215:1043–1044. doi: 10.1038/2151043a0. - DOI - PubMed
    1. Prusiner SB. Scrapie prions. Annu Rev. Microbiol. 1989;43:345–374. doi: 10.1146/annurev.mi.43.100189.002021. - DOI - PubMed
    1. Prusiner, S. B. Molecular biology and genetics of prion diseases. Cold Spring Harb. Symp. Quant. Biol.61, 473–493 (1996). - PubMed
    1. Weissmann C, et al. The role of PrP in pathogenesis of experimental scrapie. Cold Spring Harb. Symp. Quant. Biol. 1996;61:511–522. doi: 10.1101/SQB.1996.061.01.051. - DOI - PubMed
    1. Horiuchi M, et al. Generation of monoclonal antibody that distinguishes PrPSc from PrPC and neutralizes prion infectivity. Virology. 2009;394:200–207. doi: 10.1016/j.virol.2009.08.025. - DOI - PubMed

Publication types