. 2023 Dec 15;14(1):8357.
doi: 10.1038/s41467-023-43740-y.

Maternal dominance contributes to subgenome differentiation in allopolyploid fishes

Affiliations

Maternal dominance contributes to subgenome differentiation in allopolyploid fishes

Min-Rui-Xuan Xu et al. Nat Commun. .

Abstract

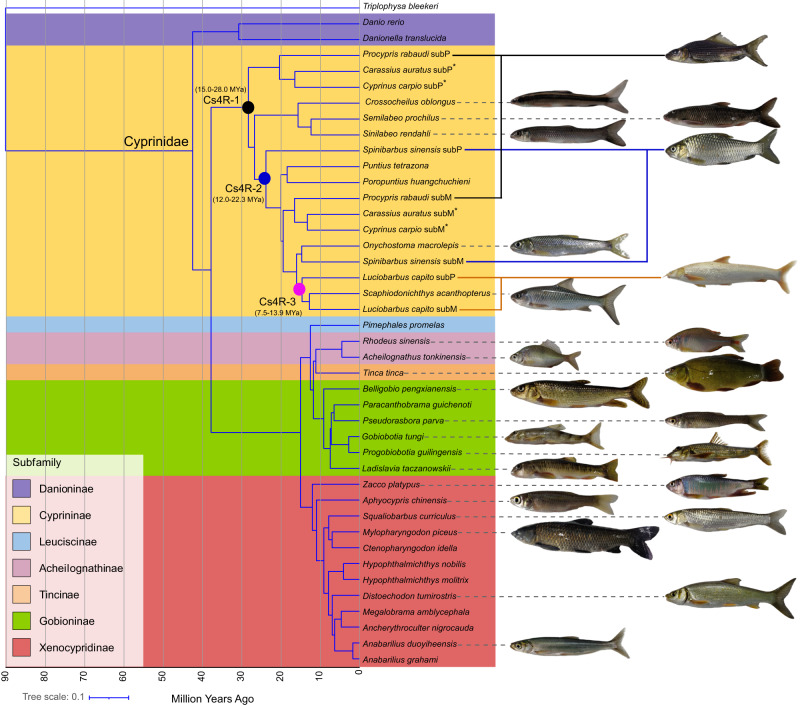
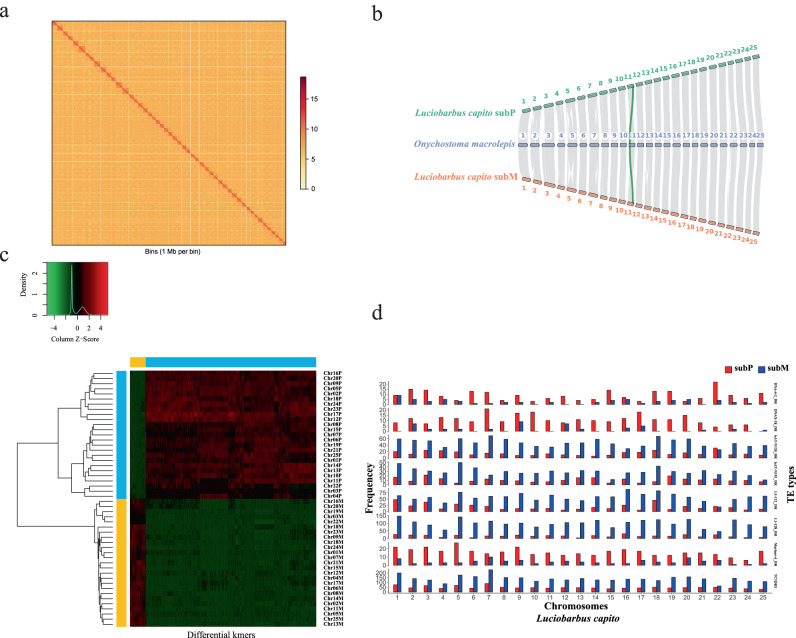
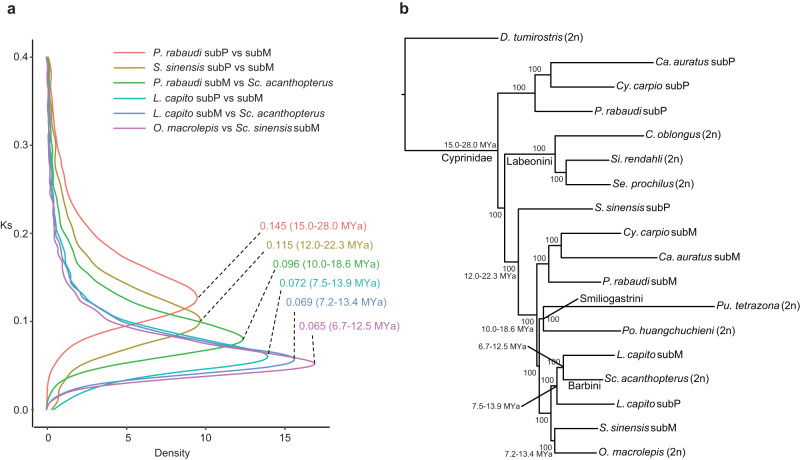
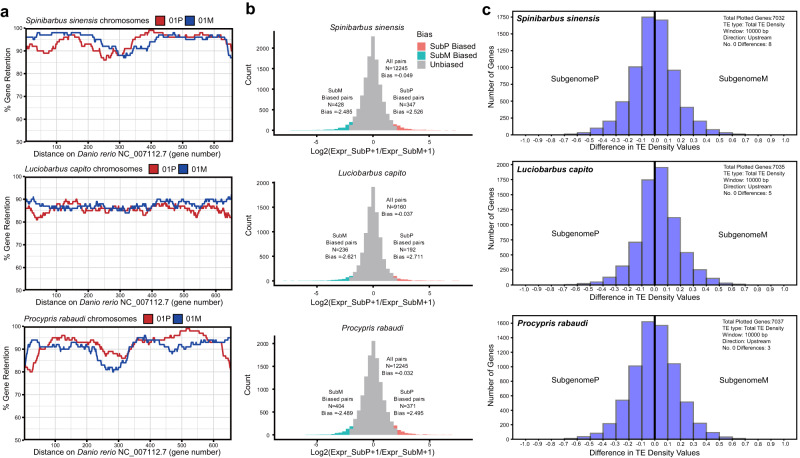
Teleost fishes, which are the largest and most diverse group of living vertebrates, have a rich history of ancient and recent polyploidy. Previous studies of allotetraploid common carp and goldfish (cyprinids) reported a dominant subgenome, which is more expressed and exhibits biased gene retention. However, the underlying mechanisms contributing to observed 'subgenome dominance' remains poorly understood. Here we report high-quality genomes of twenty-one cyprinids to investigate the origin and subsequent subgenome evolution patterns following three independent allopolyploidy events. We identify the closest extant relatives of the diploid progenitor species, investigate genetic and epigenetic differences among subgenomes, and conclude that observed subgenome dominance patterns are likely due to a combination of maternal dominance and transposable element densities in each polyploid. These findings provide an important foundation to understanding subgenome dominance patterns observed in teleost fishes, and ultimately the role of polyploidy in contributing to evolutionary innovations.


Conflict of interest statement

The authors declare no competing interests.

Figures

Fig. 1
Fig. 1. Phylogeny and divergence time of fishes within the Cyprinidae family.
Species tree constructed using IQ-TREE based on CDS of 300 one-to-one orthologues from 37 studied species was shown in Supplementary Fig. 13. Triplophysa bleekeri was used as the outgroup. Divergence time between all fishes or subgenomes of five allotetraploids was inferred by MCMCTree (Supplementary Fig. 12). All the fish images were created in this study. Black, blue and yellow solid circles represent the divergence timepoints of the diploid progenitor lineages for the three independent cyprinid-specific whole genome duplication (Cs4R). However, they do not represent the timepoints of the three WGDs. The numbers in parentheses represent the time of WGD. Fishes belonging to the corresponding subfamilies of the Cyprinidae family were shown using unique background color.
Fig. 2
Fig. 2. Evidence for the allotetraploid origin of L. capito.
a Intensity signal heat map of the high-throughput chromatin conformation capture (Hi-C) chromosome interaction. b Syntenic relationships between O. macrolepis and L. capito subP and subM. The green band showed one example of a collinearity gene between homologous chromosomes. c Heatmap and clustering of differential k-mers. The x-axis, differential k-mers; y-axis, chromosomes. The vertical color bar, each chromosome is assigned to subP and subM; the horizontal color bar, each k-mer is specific to subP and subM. d TE frequency on chromosomes showing subP and subM biased distributions in the tetraploid genome of L. capito. Evidence supporting the allotetraploid origin of S. sinensis and P. rabaudi was present in Supplementary Figs. 2 and 3.
Fig. 3
Fig. 3. Time estimates of polyploid events and phylogeny relationship between potential diploid ancestors and allotetraploids.
a Distribution of synonymous substitution rates (Ks) between species and between subP and subM. Numbers at distribution peaks indicate median Ks values. b The phylogenetic relationship of possible diploid ancestors and allotetraploid subgenomes. The ML tree based on CDS of 1669 one to one orthologs from 13 species was created by IQ-TREE. We used Distoechodon tumirostris as the outgroup.
Fig. 4
Fig. 4. Gene fractionation, gene expression and TE density of subgenomes.
a Subgenome fractionation of allotetraploids S. sinensis, L. capito, and P. rabaudi relative to the diploid Danio rerio. Gene retention in focal tetraploid subP (red) and subM (blue) was calculated in 100 gene sliding windows and displayed for chromosome 1 of each tetraploid species. Gene retention of the rest chromosomes of each tetraploid was showed in Supplementary Figs. 18–20; b Global subgenome expression bias in the brain tissue of studied tetraploid species, with biased gene counts colored according to subP (red) and subM (blue). Subgenome expression bias in the rest five tissues eye, gill, heart, liver and muscle of studied tetraploid species was shown in Supplementary Fig. 36; c Histograms of differences in TE density values of subP and subM syntelogs of S. sinensis, L. capito, andP. rabaudi. Density values were calculated for all TEs in a 10,000 bp window upstream of genes and difference values were calculated by subtracting TE density of subM syntelogs from subP syntelogs. Negative values represent higher TE density for subM syntelogs, whereas positive values reflect higher TE density for subP syntelogs.
Fig. 5
Fig. 5. Functional enrichment analysIs of tandem duplicate genes in three allotetraploid genomes.
PFAM domain analysis shows an enrichment of tandem duplicate genes associated with the immune system, including ‘PF07679 Immunoglobulin I-set domain’ of L. capito (FDR p-value = 0.00037), P. rabaudi (FDR p-value = 7.37e-05),and S. sinensis (FDR p-value = 0.00093).
Fig. 6
Fig. 6. Three-dimensional (3D) genome architectures, including A/B compartments and topological associated domains (TADs), of each subgenome from three allotetraploids.
a First principal component values representing A/B compartments in the Chr01P and Chr01M of S. sinensis, P. rabaudi, and L. capito. Positive PC values showing in red are designated as A compartments, and negative PC values indicating in blue represent B compartments. A/B compartments found in the rest chromosomes of three species are shown in Supplementary Figs. 45–47. b TE content in A/B compartments in subP and subM. c Gene number in A/B compartments in subP and subM. d Expression level of genes in A compartments was significantly higher than those in B compartments (Two-sample t-test; p < 0.001). e TAD structure in one representative region of homologous chromosomes from three allotetraploids. Black triangles show TADs. Yellow blocks indicate strong signal of chromatin interactions and blue blocks indicate weak signal of chromatin interactions. f Number of TAD (red) and conserved TAD (blue) identified in each subgenome. g Gene number in TAD boundaries in each subgenome. h TAD size in each subgenome. All the t statistical test used in this figure was two-sided, and the exact p values were also showed. It indicates non-significant in two-sample t-test results if p values were larger than 0.05. The sample size used for statistical analysis is shown as “n”.

References

    1. Otto SP, Whitton J. Polyploid incidence and evolution. Annu. Rev. Genet. 2000;34:401–437. doi: 10.1146/annurev.genet.34.1.401. - DOI - PubMed
    1. Van de Peer Y, Maere S, Meyer A. The evolutionary significance of ancient genome duplications. Nat. Rev. Genet. 2009;10:725–732. doi: 10.1038/nrg2600. - DOI - PubMed
    1. Comai L. The advantages and disadvantages of being polyploid. Nat. Rev. Genet. 2005;6:836–846. doi: 10.1038/nrg1711. - DOI - PubMed
    1. Ohno, S. Evolution by Gene Duplication. Springer Berlin Heidelberg, Berlin, Heidelberg (1970).
    1. Kasahara M. The 2R hypothesis: an update. Curr. Opin. Immunol. 2007;19:547–552. doi: 10.1016/j.coi.2007.07.009. - DOI - PubMed

Publication types

Associated data