. 2023 Dec 15;14(1):8375.
doi: 10.1038/s41467-023-43732-y.

Whole-genome sequencing reveals the molecular implications of the stepwise progression of lung adenocarcinoma

Affiliations

Whole-genome sequencing reveals the molecular implications of the stepwise progression of lung adenocarcinoma

Yasuhiko Haga et al. Nat Commun. .

Abstract

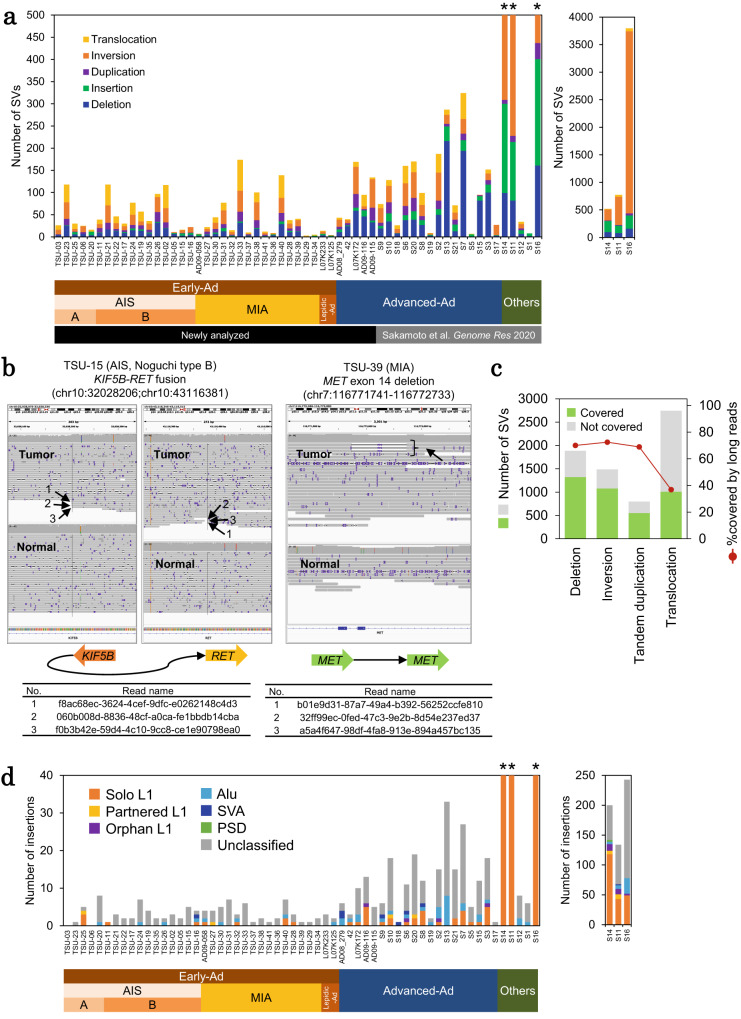
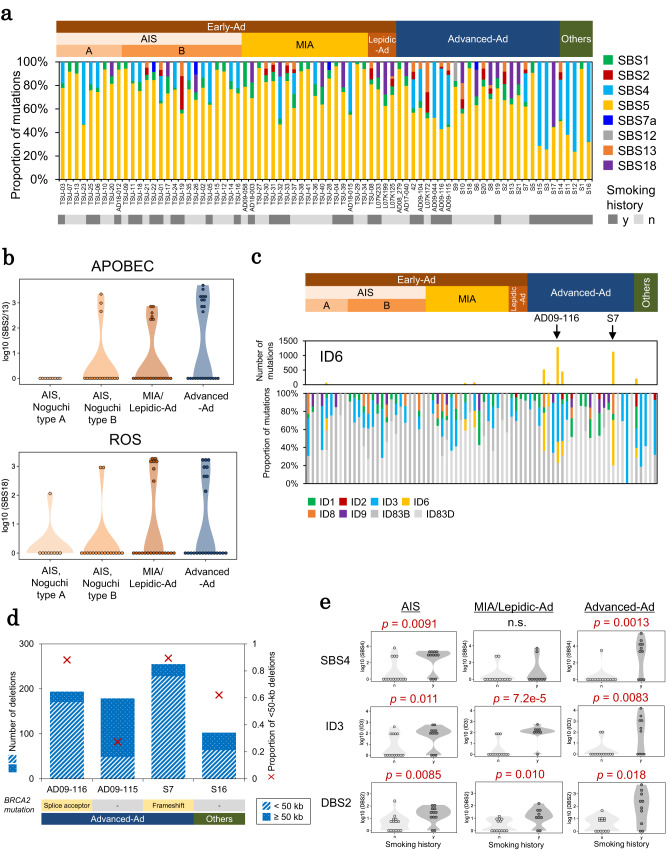
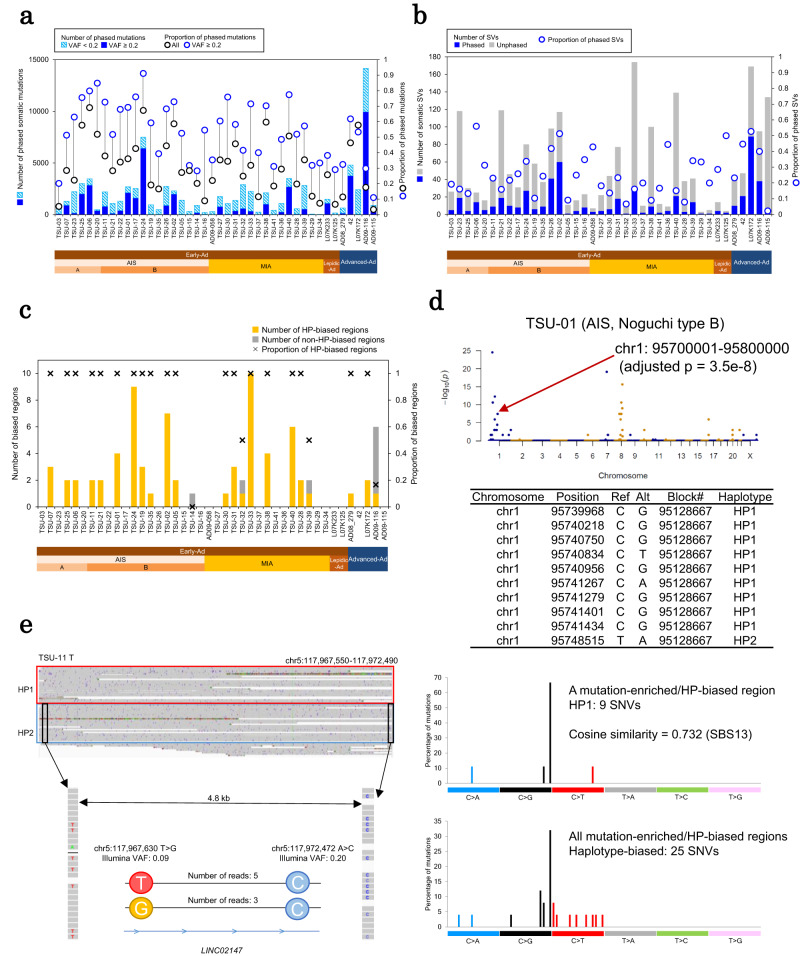
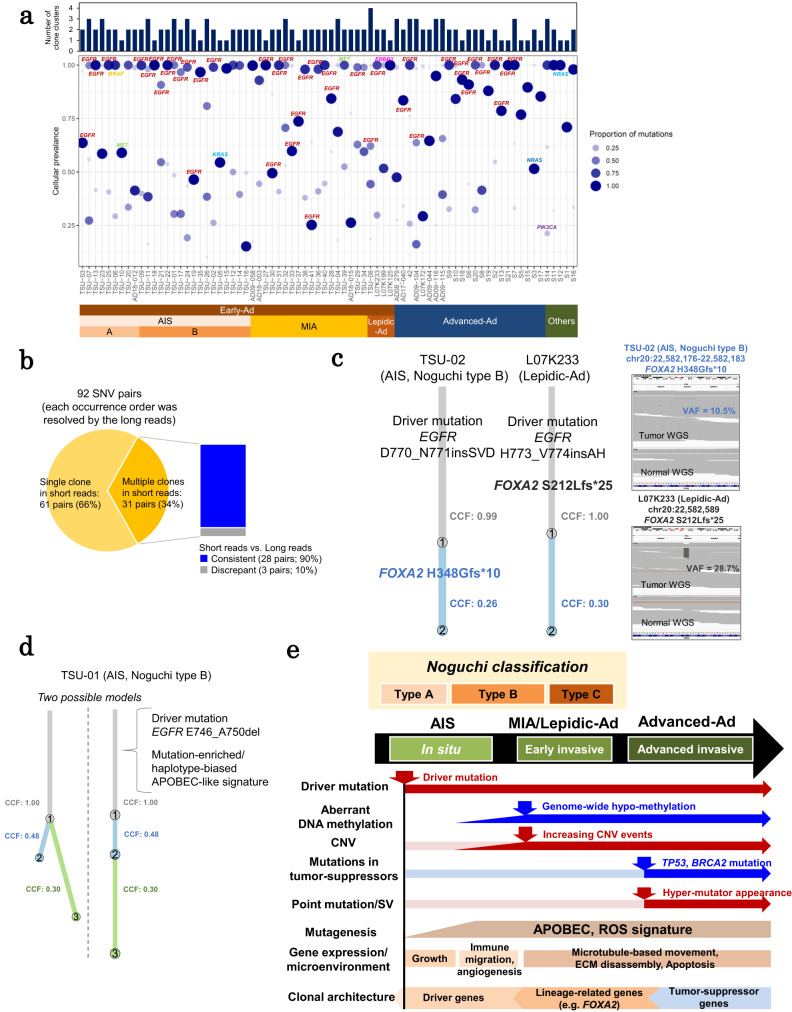
The mechanism underlying the development of tumors, particularly at early stages, still remains mostly elusive. Here, we report whole-genome long and short read sequencing analysis of 76 lung cancers, focusing on very early-stage lung adenocarcinomas such as adenocarcinoma in situ (AIS) and minimally invasive adenocarcinoma. The obtained data is further integrated with bulk and spatial transcriptomic data and epigenomic data. These analyses reveal key events in lung carcinogenesis. Minimal somatic mutations in pivotal driver mutations and essential proliferative factors are the only detectable somatic mutations in the very early-stage of AIS. These initial events are followed by copy number changes and global DNA hypomethylation. Particularly, drastic changes are initiated at the later AIS stage, i.e., in Noguchi type B tumors, wherein cancer cells are exposed to the surrounding microenvironment. This study sheds light on the pathogenesis of lung adenocarcinoma from integrated pathological and molecular viewpoints.


Conflict of interest statement

The authors declare no competing interests.

Figures

Fig. 1
Fig. 1. Basic characterization of cancer-related genes from AIS to advanced lung adenocarcinomas.
a Representative H&E images of Early-Ad cases with Noguchi classification. We analyzed 9, 19, 20 of Noguchi type A, B and C Early-Ad cases, respectively, in this study. Images show representative examples of tissue regions for each histological subtype, which were annotated by the pathologists. b The somatic mutation status of cancer-related genes. Point mutation and SV statuses of oncogenes, tumor-suppressor genes and other known mutated genes are shown in each case. c The proportion of cases with EGFR hotspot mutations (e.g., L858R, exon 18/19 deletions and exon 20 insertions), TP53 mutations, SMARCA4 and SMARCA2 mutations, and RBM10 mutations in the corresponding AIS, MIA/Lepidic-Ad and Advanced-Ad cases. When comparing Early-Ad and Advanced -Ad cases, the p-values are indicated by asterisks, **p < 0.05, ***p < 0.005. n.s.: not significant (p ≥ 0.05). The p-values were calculated by Fisher’s exact test (two-sided, no multiple comparison adjustments). d CNV status of cancer-related genes. Copy number gains for the representative oncogenes and genes frequently reported with amplifications in lung cancers (upper panel). Copy number losses are also shown for the representative tumor suppressor genes (lower panel). e Copy number profiles of representative cases. Cancer-related genes affected by copy number aberrations are shown in the inset. f Aberrant events in CDKN2A region in each case (left). Proportion of cases with CDKN2A aberrations in the corresponding AIS, MIA/Lepidic-Ad, and Advanced-Ad cases (right). CN copy number. Whole-gene deletion (>1): whole-gene deletions detected with ≥2 deletion breakpoint pairs, which possibly indicates homozygous deletions. Source data are provided as a Source Data file for (b).
Fig. 2
Fig. 2. Precise detection of somatic SVs by long read sequencing.
a Number of somatic SVs detected in long read WGS using Nanomonsv. The number of SVs for the three cases with the highest numbers of SVs (asterisk) is also shown in the separate graph. b An example of SVs in Early-Ad cases. Driver events (KIF5B-RET fusion and MET exon 14 deletion) for the corresponding cases. Both primary and supplementary alignments visualized by IGV. The truncated read names are provided in the bottom tables. c Long read coverage of SV junctions detected with short read WGS. d Number of insertions detected from long read WGS using Nanomonsv. Number of inserted sequences for three cases with the highest number of insertions (asterisk) is also shown in the separate graph. Source data are provided as a Source Data file for (a, b and c).
Fig. 3
Fig. 3. Patterns of somatic mutation accumulations.
a Somatic mutation abundances in the corresponding groups. The number of point mutations, SVs, and CNVs is shown in the upper, middle, and lower panels, respectively. The p-values were calculated by Wilcoxon rank sum test (two-sided, no multiple comparison adjustments). b Comparison of the number of somatic mutations between EGFR mutation–positive and –negative cases in early and advanced adenocarcinomas. The p-values were calculated by Wilcoxon rank sum test (two-sided, no multiple comparison adjustments) and are shown on top of each graph. n.s. not significant. Source data are provided as a Source Data file for (a and b).
Fig. 4
Fig. 4. Mutational patterns reveal mutagenic factors for cancer genomes.
a Proportion of single nucleotide substitutions (SBS) assigned to the COSMIC mutational signatures (v3.2). b Number of somatic mutations assigned to the APOBEC-associated signatures (SBS2 and SBS13) and the reactive oxygen species (ROS)-associated signature (SBS18) for each subtype in the upper and lower panels, respectively. c Proportion of indels (ID) assigned to the COSMIC mutational signatures (v3.2). Upper part of the graph, number of somatic mutations assigned to the ID6. Arrows indicate two cases with a high abundance of the ID6 signature. d Association between SV occurrence and BRCA2 mutation status. The number of deletions and the proportion of shorter (<50 kb) deletions are represented in the graph. e Tobacco-related mutational signatures and smoking history of each case. Comparison of the number of somatic mutations assigned to tobacco-related signatures (SBS4, ID3, and DBS2) between smokers and non-smokers in each adenocarcinoma subtype. The p-values were calculated by Wilcoxon rank sum test (two-sided, no multiple comparison adjustments) and are shown in the top of each graph. n.s. not significant. Source data are provided as a Source Data file for (a, b, c, d and e).
Fig. 5
Fig. 5. Epigenomic aberrations in early and advanced lung adenocarcinoma.
a Genome-wide methylation status of each case. The distribution of DNA methylation rates in each 50 kb genomic window is shown in the violin plot. DNA methylation rates of each normal counterpart shown as red dot plots. b Median genome-wide DNA methylation rates. The p-values were calculated by Wilcoxon rank sum test (two-sided, no multiple comparison adjustments). c An example of DNA hypomethylation. Unmethylated and methylated cytosine bases in CpG sites are colored in blue and red, respectively. d Association between differences in median genome-wide methylation rates (50 kb windows) from normal counterparts and number of copy number events and insertions. Each plot represents one case. Spearman correlation coefficient and p-values (two-sided, no multiple comparison adjustments) are shown in the inset. e DNA methylation patterns of LINE-1, Alu, and SVA in each subtype. f DNA methylation patterns of CpG islands, CpG shores, promoters, and possible enhancers in each subtype. Source data are provided as a Source Data file for (b, d, e and f).
Fig. 6
Fig. 6. Transcriptome patterns in early and advanced lung adenocarcinoma.
a Expression patterns of DEGs between AIS Noguchi type A and B in RNA-seq data. b GO terms enriched in the DEGs in (a). c Expression patterns of DEGs between AIS and MIA/Lepidic-Ad cases in RNA-seq data. d GO terms enriched in the DEGs in (c). e Spatial transcriptome analysis Visium for three representative cases (TSU-20, TSU-21, and TSU-33). Expression patterns of marker genes for well-differentiated tumor cells (NAPSA) and AMs (MARCO) are represented. f Enrichment scores of transcriptome signature genes in the corresponding histological types in Visium data. g Multiplexed fluorescence immunostaining (PhenoCycler) of serial sections of spatial transcriptome data for case TSU-21. Protein expression patterns of representative cell-type markers for the entire region and three regions-of-interests: (1) a macrophage-rich region, (2) a region with lymphocyte infiltration, and (3) a region nearby fibrotic foci characteristic to Noguchi type B tumors. Each antibody was used as a cell-type marker: Pan-cytokeratin, epithelial cells; CD19, B cells; CD4, T cells; CD68, macrophages; and α-SMA/ACTA2, myofibroblasts. h Spatial expression patterns of tumor cell markers in Visium data. i In situ gene expression profiling Xenium for case TSU-21. Clusters are represented in the spatial plot and the UMAP plot in the left and right panels, respectively. The statistics of Xenium data are shown in the margin of the spatial plot. The cell-type annotation is shown in the margin of the UMAP plot. j Xenium spatial expression pattern of an alveolar macrophage marker MARCO (left). Patterns of several macrophage markers in local regions (middle and right). Each dot represents a detected RNA molecule.
Fig. 7
Fig. 7. Haplotype-resolved genomic, epigenomic, and transcriptomic aberrations in early and advanced lung adenocarcinoma.
a Number and proportion of somatic point mutations assigned to haplotypes. b The number and proportion of SVs assigned to haplotypes. c Number and proportion of mutation-enriched and haplotype-biased regions. HP: haplotype. d An example of mutation-enriched and haplotype-biased regions in an AIS case. The graph shows all mutation-enriched windows in this case (top panel). The p-values were calculated by hypergeometric test using R function phyper (one-sided, adjusted by Bonferroni correction). List of somatic mutations in a mutation-enriched and haplotype-biased region (middle panel). The 96 substitution patterns of somatic mutations in the mutation-enriched and haplotype-biased regions (bottom panel). e An example of the somatic mutation pairs for which long reads directly resolve the occurrence order. Source data are provided as a Source Data file for (a, b, c and d).
Fig. 8
Fig. 8. Clonal architecture of early adenocarcinoma.
a Mutation clusters (clones) in all cases. The dots represent each clone and their size indicates the proportion of somatic mutations in the clone. The number of clones is shown in the bar graph. b Validation of estimated clone structures using long reads. The occurrence order of a total of 92 SNV pairs was directly resolved by long reads. The 61 SNV pairs were assigned to the same single clone population of the PyClone result. The breakdown (consistent/discrepant with the evaluation by the long reads) of the 31 SNV pairs assigned to the different multiple clones of the PyClone result were represented in the bar chart. c Estimated clone structures in two cases, TSU-02 (AIS Noguchi type B) and L07K233 (Lepidic-Ad), which harbored FOXA2 mutations. CCF cancer cell fraction. d Two candidates of clone structures in case TSU-01 (AIS Noguchi type B). e Summary of genome-wide and multi-modal characterization of lung adenocarcinomas from early to advanced cases. Source data are provided as a Source Data file for (a).

References

    1. Noguchi M, et al. Small adenocarcinoma of the lung. Histologic characteristics and prognosis. Cancer. 1995;75:2844–2852. doi: 10.1002/1097-0142(19950615)75:12<2844::AID-CNCR2820751209>3.0.CO;2-#. - DOI - PubMed
    1. Noguchi M. Stepwise progression of pulmonary adenocarcinoma-clinical and molecular implications. Cancer Metastasis Rev. 2010;29:15–21. doi: 10.1007/s10555-010-9210-y. - DOI - PubMed
    1. Nicholson AG, et al. The 2021 WHO classification of lung tumors: impact of advances since 2015. J. Thorac. Oncol. 2022;17:362–387. doi: 10.1016/j.jtho.2021.11.003. - DOI - PubMed
    1. Kadota K, et al. Prognostic significance of adenocarcinoma in situ, minimally invasive adenocarcinoma, and nonmucinous lepidic predominant invasive adenocarcinoma of the lung in patients with stage I disease. Am. J. Surg. Pathol. 2014;38:448–460. doi: 10.1097/PAS.0000000000000134. - DOI - PMC - PubMed
    1. Weinstein JN, et al. The cancer genome atlas pan-cancer analysis project. Nat. Genet. 2013;45:1113–1120. doi: 10.1038/ng.2764. - DOI - PMC - PubMed

Publication types