. 2023 Dec 15;14(1):8361.
doi: 10.1038/s41467-023-43780-4.

PAX3-FOXO1 uses its activation domain to recruit CBP/P300 and shape RNA Pol2 cluster distribution

Affiliations

PAX3-FOXO1 uses its activation domain to recruit CBP/P300 and shape RNA Pol2 cluster distribution

Yaw Asante et al. Nat Commun. .

Abstract

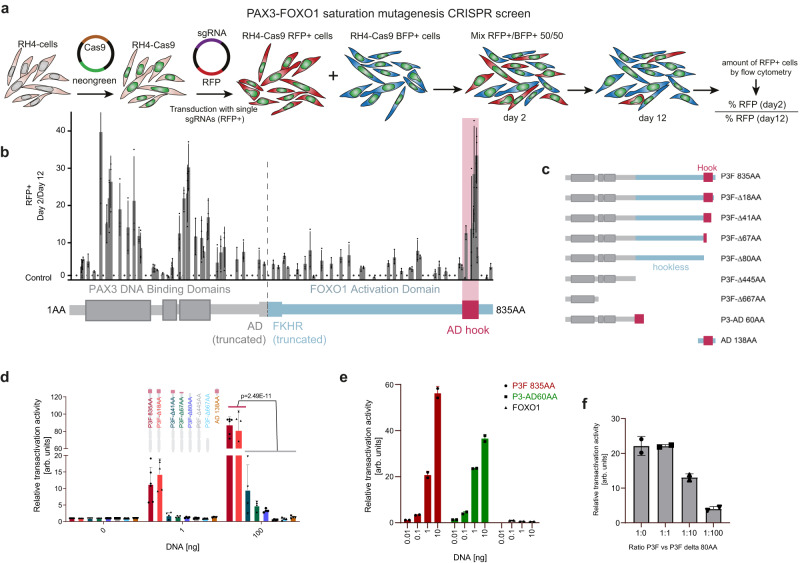
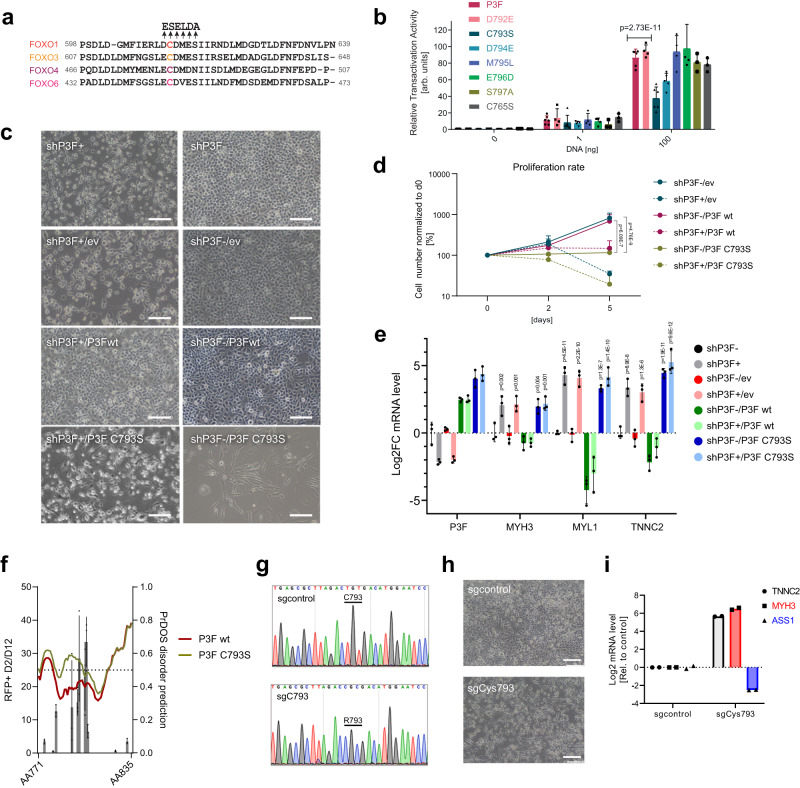
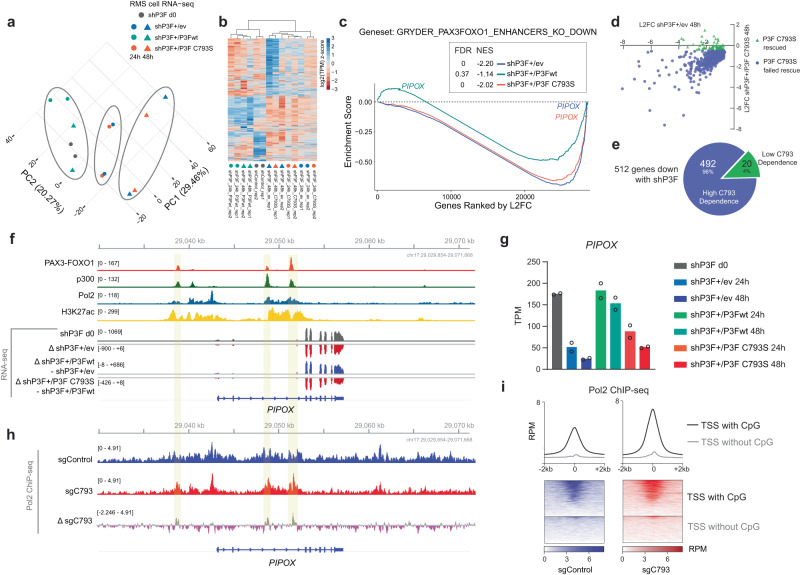
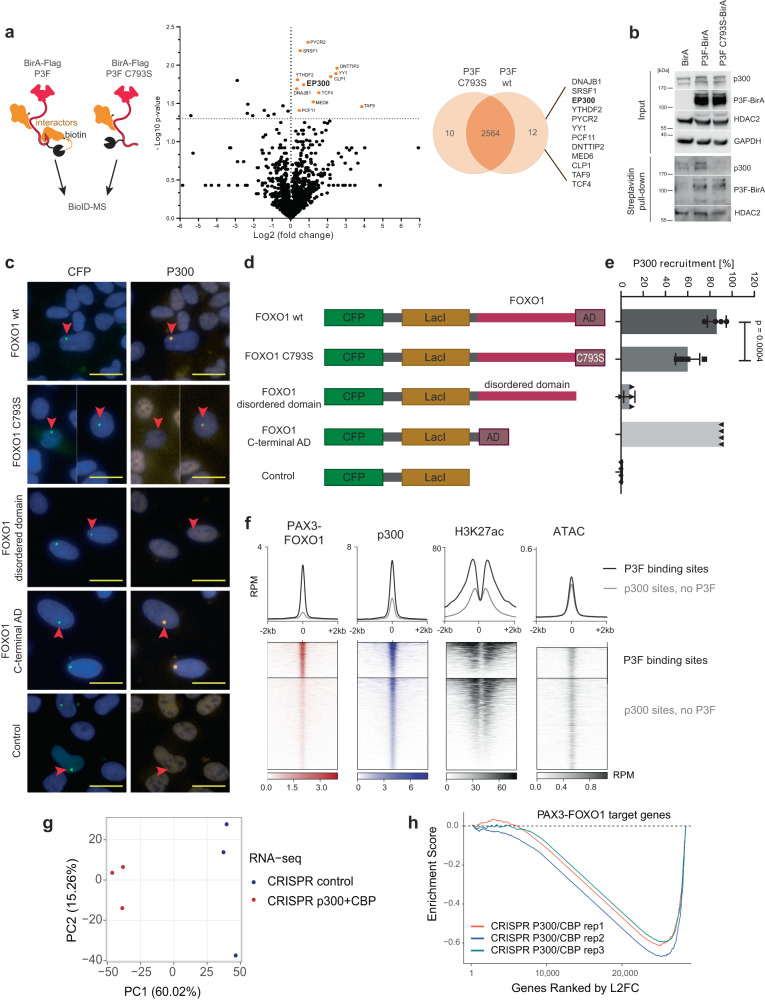
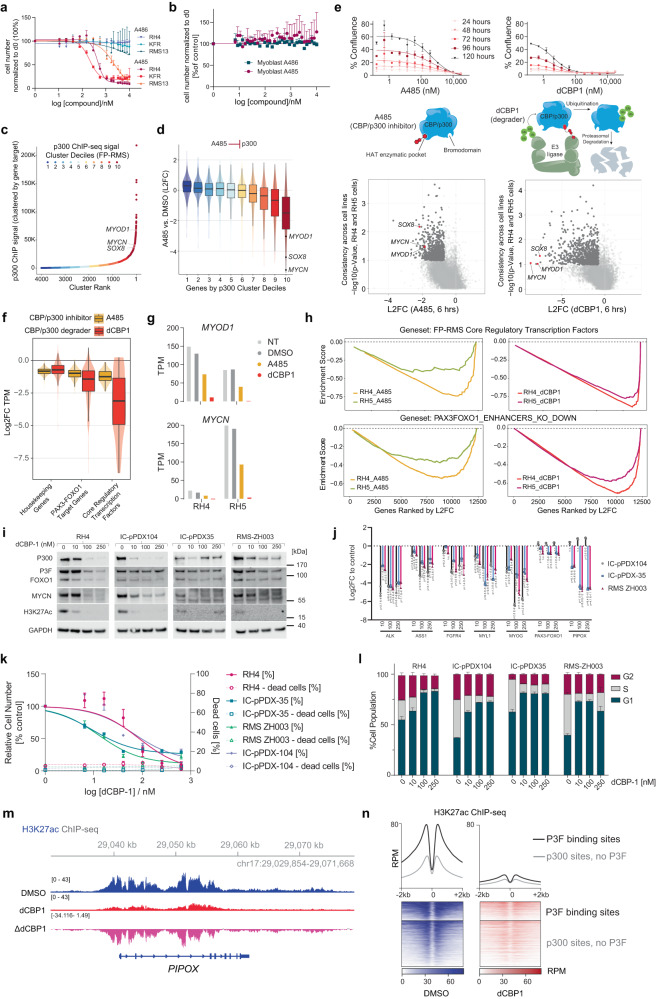
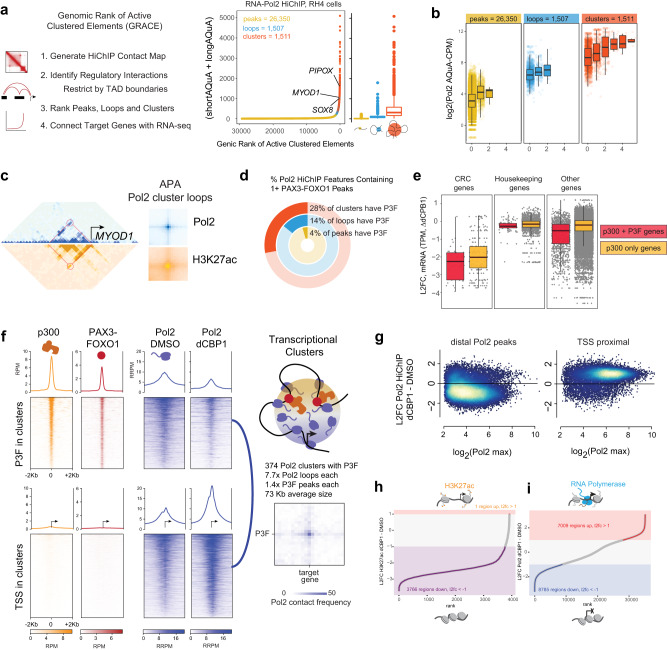
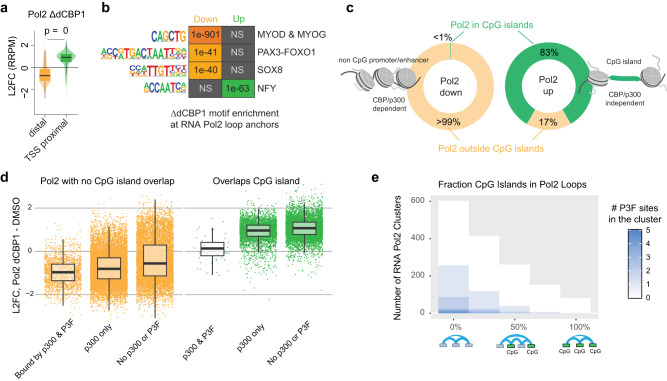
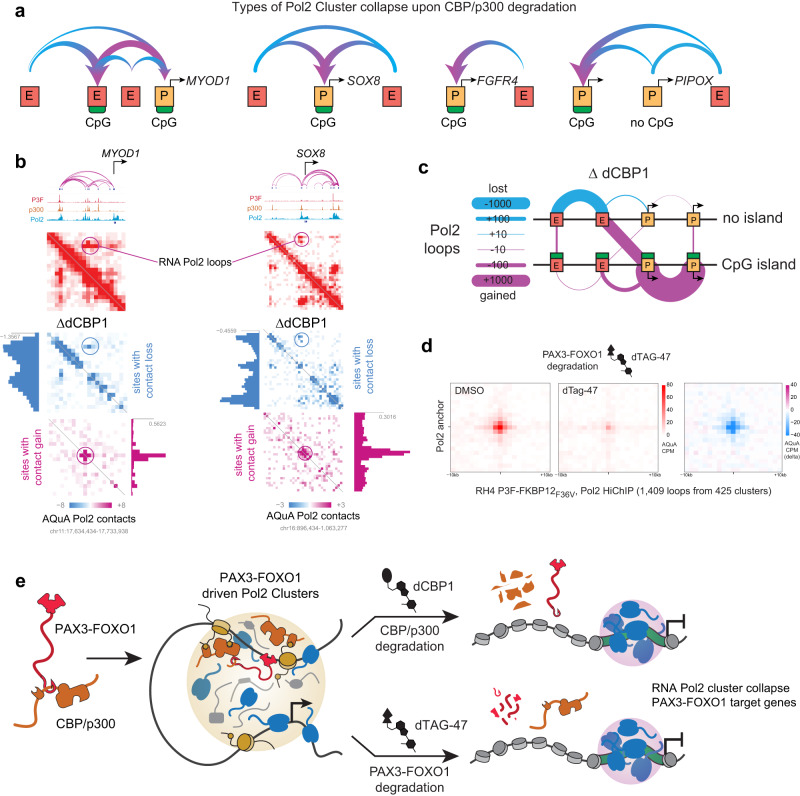
Activation of oncogenic gene expression from long-range enhancers is initiated by the assembly of DNA-binding transcription factors (TF), leading to recruitment of co-activators such as CBP/p300 to modify the local genomic context and facilitate RNA-Polymerase 2 (Pol2) binding. Yet, most TF-to-coactivator recruitment relationships remain unmapped. Here, studying the oncogenic fusion TF PAX3-FOXO1 (P3F) from alveolar rhabdomyosarcoma (aRMS), we show that a single cysteine in the activation domain (AD) of P3F is important for a small alpha helical coil that recruits CBP/p300 to chromatin. P3F driven transcription requires both this single cysteine and CBP/p300. Mutants of the cysteine reduce aRMS cell proliferation and induce cellular differentiation. Furthermore, we discover a profound dependence on CBP/p300 for clustering of Pol2 loops that connect P3F to its target genes. In the absence of CBP/p300, Pol2 long range enhancer loops collapse, Pol2 accumulates in CpG islands and fails to exit the gene body. These results reveal a potential novel axis for therapeutic interference with P3F in aRMS and clarify the molecular relationship of P3F and CBP/p300 in sustaining active Pol2 clusters essential for oncogenic transcription.


Conflict of interest statement

The authors declare no competing interests.

Figures

Fig. 1
Fig. 1. CRISPR/Cas9-based domain screening of P3F reveals a novel functionally important C-terminal domain.
a Scheme depicting the CRISPR/Cas9-based domain screen approach. RH4 cells stably expressing Cas9 (RH4-Cas9) were transduced with either a vector driving expression of sgRNAs directed against P3F and RFP or a control sgRNA directed against the AAVS1 region together with BFP. Two days after transduction RFP+ cells were mixed 1:1 with BFP+ cells. Percentage of RFP+ cells was determined at day 2 and 12 by flow cytometry. b Ratio of RFP+ cells on day 2 (D2) and day 12 (D12). Relative number of RFP+ cells was measured by flow cytometry. The horizontal dashed line indicates the mean of all controls (ratio 1.22). Plotted are mean and standard deviation for each sgRNA (n = 3 independent experiments). P3F domains (PAX3 in grey, FOXO1 in blue) are depicted schematically at the bottom, with the vertical dashed line indicating the breakpoint of the fusion. AD, activation domain; FKHR, forkhead domain. c Scheme depicting the truncated versions of P3F used for reporter assays. d Luciferase reporter assays measured 48 h after transfection of HEK 293 T cells with indicated P3F constructs. Depicted are mean and standard deviation for each construct normalized to an internal transfection control (Renilla luciferase) (n = 6 (P3F 835 AA), n = 5 (P3F-Δ18AA) and n = 4 (rest) independent experiments; two-way Anova, Tukey’s multiple comparisons test). e Luciferase assay performed as described under d using full-length P3F, a 60 AA fragment containing the AD fused to the PAX3 part of P3F (P3-AD 60AA) or wildtype FOXO1 (n = 2 independent experiments). f Luciferase assay performed as described under d with full-length P3F in combination with the P3F-Δ80AA deletion mutant in indicated ratios (n = 2 independent experiments). Source data are provided as a Source Data file.
Fig. 2
Fig. 2. Mutation of C793 reduces transcriptional activity of P3F and induces differentiation of FP-RMS cells.
a Alignment of amino acid sequences of FOXO family members around C612 of FOXO1 (C793 of P3F) (based on UniProt). Arrows indicate amino acids that were mutated in P3F for functional tests. b Luciferase reporter assay performed with HEK293T cells 48 h after transfection with either wildtype P3F or P3F containing indicated mutations. Plotted are mean ± SD of each construct normalized to an internal transfection control (Renilla luciferase) (n = 6 (P3F, C793S), n = 5 (D794), n = 4 (D792, M795, E796) and n = 3 (S795, C765) independent experiments, two-way Anova, Tukey’s multiple comparisons test). c Morphology of RH4 cells before (right panels) and after (left panels) silencing of endogenous P3F (shP3F) using a dox-inducible shRNA and rescued with either empty vector (ev), wild type P3F (P3Fwt) or C793S mutant P3F (C793S), respectively. Scale bar, 100 μm. d Proliferation curve of cells described in c, as determined by cell counting (n = 3 independent experiments; means ± SD, two-way Anova, Tukey’s multiple comparisons test). e mRNA levels of indicated genes in cells described in c 48 h after silencing of P3F. Data is normalized to shP3F d0 control. Plotted are means ± SD (n = 3 independent experiments, two-way Anova, Tukey’s multiple comparisons test, comparison to shP3F). f Disorder prediction of the C-terminal region (amino acid 777-831) of wildtype (red) and C793S mutant (green) P3F calculated with PrDOS (www.predictprotein.org). Results of the domain screen from b are overlaid as black bars (n = 3 independent experiments, plotted as means ± SD). g Sanger sequencing chromatograms depicting the region around C793 in endogenous P3F before and after base editing in Rh4-ABE8e cells. An amplicon covering C793 was amplified with cDNA from cells transduced with a control sgRNA (upper panel) or an sgRNA recruiting the ABE8e base editor to C793 (lower panel). h Phase contrast pictures of the same cells as described in g, 3 days after transduction. Scale bar, 400 μm. i mRNA levels of indicated genes measured in cells as described in g 5 days after transduction (n = 2 independent experiments). Source data are provided as a Source Data file.
Fig. 3
Fig. 3. Mutation of C793 leads to loss of expression of most of the P3F target genes.
RNA-seq analysis performed with RH4 cells after silencing of endogenous P3F with a Dox-inducible shRNA and rescue with either empty vector (ev), wild type P3F (P3Fwt) or P3F carrying a C793S mutation (C793S), respectively, for 24 h and 48 h (n = 2). Non-dox treated cells containing no rescue construct were used as baseline control (shP3F d0). a Principal component analysis (PCA) plot displaying 14 samples. b Unsupervised hierarchical clustering analysis using all genes up- or downregulated after silencing of endogenous P3F and rescued with wildtype P3F (n = 854) in RH4 cells (FDR < 0.05). c GSEA analysis performed using shP3F + /ev 48 h, shP3F + /P3Fwt 48 h, and shP3F + /P3F C793S 48 h data. Pre-ranked datasets were prepared using log-transformed data normalized with shP3F d0 baseline control construct data. The gene set was derived from a list of P3F target genes recurrent in RMS tumors and cell lines that fall within TADs containing P3F-bound enhancers. FDR, false discovery rate; NES, normalized enrichment score. d Changes in expression of P3F target genes (n = 512) after silencing of endogenous P3F in presence and absence of C793S mutant P3F. e Pie graph depicting genes with high and low C793 dependence among the 512 most downregulated genes after silencing of endogenous P3F at 48 h in RH4 cells. The majority of these genes have a high C793 dependence (n = 492). f ChIP-seq and RNA-seq data at PIPOX visualized in IGV. g TPM values of PIPOX across all construct treatments. Error bars represent the standard deviation across two biological replicates. h Pol2 ChIP-seq data for RH4 cells after base editing with sgcontrol (wildtype P3F) versus C793R mutant P3F at PIPOX visualized in IGV. Overlap between P3F sites and delta tracks highlighted in yellow. i Heatmap of Pol2 ChIP-seq shows that TSS with CpG islands have an increase in signal after P3F C793R mutation which is greater than that at the TSS without CpG islands. Source data are provided as a Source Data file.
Fig. 4
Fig. 4. Mutation of C793 affects binding of P3F to CBP/p300.
a Left panel, schematic of design for BioID experiment. Center panel, volcano plot depicting results of the BioID experiment using HEK293T cells transfected with P3F-BirA or C793S mutant P3F-BirA for identification of interactors. Log2 fold change of total spectral counts measured by mass spectrometry from the comparison of wildtype and C793S mutant P3F is shown (n = 3 independent experiments, unpaired two-tailed T-test). Right panel, Venn diagram depicting differences in the interactome of wildtype P3F versus C793S mutant P3F. The 12 proteins specific for wildtype P3F are indicated on the right. b Validation of BioID-MS results by Western Blot. BioID labeling was performed in 293T cells transfected with BirA or wildtype or C793S mutant P3F-BirA fusion protein constructs. Indicated proteins were detected in cell lysates for detection of input levels (upper panels) and in streptavidin pull-downs for evaluation of biotinylation levels (lower panels). One representative experiment from n = 2 is shown. c Representative pictures from the p300 recruitment assay performed with Lac-U2OS cells transfected with indicated LacI-CFP-FOXO1 fusion constructs. The CFP signal indicates the location of the LacI-CFP fusion; presence of p300 was determined by immunofluorescence staining. Pictures from one out of four independent experiments are shown. Scale bar, 20 μm. d Scheme displaying the LacI-CFP-FOXO1 constructs used for the recruitment assay shown in c. e Quantification of the p300 recruitment assay. Presence or absence of p300 signal was determined for each CFP dot and counted (n = 4 independent experiments, plotted as means ± SD, one-way Anova, Tukey’s multiple comparisons test). f Heatmap of p300, P3F, H3K27ac ChIP-seq and ATAC-seq signal. g RNA-seq analysis of RH4 cells after double knockout of p300 and CBP. Total RNA was isolated from p300/CBP double knockout and empty vector control cells three days after sgRNA transduction (n = 3 independent experiments for each knockout). PCA plot performed with normalized and log-transformed count data is shown. h Gene set enrichment plot for RNA-seq after knockout of p300 and CBP, resulting in selective downregulation of P3F target genes. Source data are provided as a Source Data file.
Fig. 5
Fig. 5. CBP/p300 are required for RMS growth and the activation of P3F target genes.
a, b Relative cell number after treatment of cells with A485 and A486 for 6 days, as determined by high content microscopy (n = 3 independent experiments, means ± SD). c ChIP-seq clusters of p300 in enhancers in RH4 cells. d L2FC of mRNA in RH4 cells treated with 10 μM A485 for 6 h. Genes are ranked according to p300 cluster decile (n = 1 independent experiment, box plots of median and quartiles, whiskers showing 1.5 × inter-quartile ranges). e Upper panels, dose-response curves of RH5 cells treated with A485 and dCBP1 over 5 days as determined by Incucyte microscopy (n = 2 independent experiments, means ± SD). Middle panels, schemes depicting the mechanism of action for both drugs. Lower panels, plots comparing RNA-seq data from cells treated with A485 and dCBP1 for 6 h (n = 1 independent experiment, Welch’s t-test). f Degree of downregulation of indicated gene classes after CBP/p300 inhibition (n = 1 independent experiment; box plots of median and quartiles, whiskers showing 1.5 × inter-quartile ranges). g TPM values of MYOD1 and MYCN after drug treatment in RH4 and RH5 (MYCN-amplified) cells. h GSEA comparing the degree of downregulation of core regulatory transcription factor genes and genes within P3F enhancer TADs upon P3F silencing via shRNA. i Western blot detection of indicated proteins from indicated cells after dCBP1 treatment for 24 h. One representative blot from n = 3 is shown. j mRNA levels in indicated cells after 24 h of dCBP1 treatment. L2FC to DMSO is shown (n = 3 independent experiments, means ± SD, Tukey’s multiple comparisons test). k Relative cell number and percentage of dead cells in indicated cells after dCBP1 treatment for 6 days (n = 3 independent experiments, means ± SD). l Cell cycle analysis of indicated cells after dCBP1 treatment for 24 h (n = 3 independent experiments, means ± SD). m H3K27ac ChIP-seq data for the PIPOX locus in RH4 cells treated with DMSO or dCBP1. Delta track shows control subtracted from dCBP1. n H3K27ac ChIP-seq signal in RH4 cells before and after treatment with dCBP1 for 6 h. Source data are provided as a Source Data file.
Fig. 6
Fig. 6. p300 is required for Pol2 clusters connecting P3F to its targets.
a Number of Pol2 HiChIP contacts (short and long AQuA-normalized contacts, counts-per-million (CPM)) in RH4 cells plotted for all HiChIP features ranked along the X-axis by increasing HiChIP signal using the GRACE algorithm. HiChIP features are categorized by number of HiChIP contacts, with peaks, loops, and clusters having 0, 1, and 1+ loops, respectively. Box plots of median and quartiles, whiskers showing 1.5 × inter-quartile ranges. b 3D connectivity as function of overlapping P3F peaks for Pol2 peaks, loops, and clusters. c Left, HiChIP contact maps (5 kb bins) for Pol2 (blue) and H3K27ac (gold) in RH4 cells at the MYOD1 locus (red circle, example cluster loop). Right, Aggregate Peak Analysis (APA) plots of all Pol2 loops from clusters. Box plots of median and quartiles, whiskers showing 1.5 × inter-quartile ranges. d Percentages of Pol2 HiChIP features containing 1 or more P3F peaks (from independent ChIP-seq experiment). e Pol2 HiChIP features plotted by the L2FC in expression of indicated gene classes associated with the contacts in RH4 cells following 6 h dCBP1 treatment. Each group is split between features which associate TSS to p300 sites with or without P3F. (n = 1 independent experiment; box plots of median and quartiles, whiskers showing 1.5 × inter-quartile ranges). f ChIP-seq signal in RH4 cells for p300 and P3F, and HiChIP for Pol2 before and after 6 h dCPB1 treatment for all Pol2 cluster anchor constituents that contain P3F ChIP-seq peaks (top panels), and at the TSS for genes contained in Pol2 HiChIP clusters (bottom panels); scheme of Pol2 HiChIP cluster containing p300, P3F, and Pol2 (top right). Pol2 HiChIP APA plot showing the 3D connectivity of one distal P3F-bound enhancer and its putative target TSS (bottom right). Blue line, positions in the left-adjacent 2D heatmaps. g M-A scatter plots for L2FC of Pol2 HiChIP density at Pol2 peaks distal and proximal to TSS after 6 h dCBP1 treatment of RH4 cells. h,i Rank plots of RH5 H3K27ac HiChIP (h) and RH4 Pol2 HiChIP (i) regions based on L2FC of AQuA RRPM between DMSO and dCBP1 treatments. Schematics show active (top) and inactive (bottom) chromatin.
Fig. 7
Fig. 7. CpG islands determine response to CBP/p300 degradation.
a L2FC of RNA Pol2 binding (RRPM) proximal (<=5kB) or distal from the gene TSS at 6 h after dCBP1 treatment (n = 1 independent experiments; Welch’s t-test (p = 0.0) was performed between samples; Box plots of median and quartiles, with whiskers showing 1.5 × inter-quartile ranges). b After 6 h dCBP1 treatment, the motifs of the downregulated peaks indicate their positioning at key transcription factors (TFs) of FP-RMS, MYOD, MYOG, P3F, and SOX8. Additionally, an increased motif enrichment of RNA Pol2 is observed at NFY, a promoter-binding TF that contributes a phenotype similar to that of P3F. NS, not statistically significant. c Percentage of up- and downregulated RNA Pol2 peaks at CpG islands of CBP/p300 independent and dependent genes. <1% of all downregulated RNA Pol2 peaks are located at CpG islands of CBP/p300 dependent gene promoters. d Boxplots showing the Log2(Fold Change) in the Contact Signal (RRPM) of RNA Pol2 loops between DMSO and dCBP1 treated RH4 cells, split by p300 and P3F occupancy and overlap with CpG islands (n = 1 independent experiment; Box plots of median and quartiles, with whiskers showing 1.5 × inter-quartile ranges). e A histogram showing the distribution of RNA Pol2 clusters from RH4 HiChIP based on the overlap between a cluster’s constituent loops and CpG islands. The number of P3F binding sites overlapping the ends of the loops in the cluster is shown in blue.
Fig. 8
Fig. 8. RNA Pol2 clusters collapse, migrating to promoters with CpG islands.
a Schematic patterns describing the various types of RNA Pol2 cluster collapse. In these instances, RNA Pol2 migrates from enhancers and promoters without CpG islands and collects at promoters with CpG islands across MYOD1, SOX8, FGFR4 and PIPOX. b 3D contact maps of SOX8 and MYOD1 showing AQuA-CPM RNA Pol2 contacts. After 6 h dCBP1 treatment, there is an observed loss of long-range contacts with a gain of short-range contacts at a central location. c Schematic map of RNA Pol2 migration between promoters and enhancers with and without CpG island. The RNA Pol2 contacts between enhancers lacking CpG islands were mainly lost, whereas the contacts between the promoters having CpG islands were highly gained. The enhancers lacking CpG islands gained contacts to CpG containing promoters. d Aggregate Peak Analysis (APA) plots for RNA Pol2 HiChIP in RH4 cells edited to express PAX3-FOXO1-FKBP12(F36V) treated with DMSO (left), dTAG-47 (center), and the delta of dTAG-47 compared to DMSO (right). AQuA CPM is represented as bins of +/− 1 kilobases at Pol2 anchors, e Depiction of the super-cluster disruption model. CBP/p300 entangled with P3F acetylates enhancers to seed RNA Pol2 clustering and dynamic interaction with P3F target genes, which is disrupted when the CBP/p300-P3F driven RNA Pol2 super-clustering is lost.

References

    1. Ognjanovic S, Linabery AM, Charbonneau B, Ross JA. Trends in childhood rhabdomyosarcoma incidence and survival in the United States, 1975-2005. Cancer. 2009;115:4218–4226. doi: 10.1002/cncr.24465. - DOI - PMC - PubMed
    1. Yohe ME, et al. Insights into pediatric rhabdomyosarcoma research: challenges and goals. Pediatric Blood Cancer. 2019;66:e27869. doi: 10.1002/pbc.27869. - DOI - PMC - PubMed
    1. Wachtel M, Schäfer BW. PAX3-FOXO1: Zooming in on an “undruggable” target. Semin Cancer Biol. 2018;50:115–123. doi: 10.1016/j.semcancer.2017.11.006. - DOI - PubMed
    1. Gryder BE, et al. PAX3-FOXO1 establishes myogenic super enhancers and confers BET bromodomain vulnerability. Cancer Discov. 2017;7:884–899. doi: 10.1158/2159-8290.CD-16-1297. - DOI - PMC - PubMed
    1. Böhm M, et al. Helicase CHD4 is an epigenetic coregulator of PAX3-FOXO1 in alveolar rhabdomyosarcoma. J. Clin. Investig. 2016;126:4237–4249. doi: 10.1172/JCI85057. - DOI - PMC - PubMed

Publication types

MeSH terms

Associated data