. 2023 Dec 15;14(1):8343.
doi: 10.1038/s41467-023-44085-2.

Diversity and dissemination of viruses in pathogenic protozoa

Affiliations

Diversity and dissemination of viruses in pathogenic protozoa

Senne Heeren et al. Nat Commun. .

Abstract

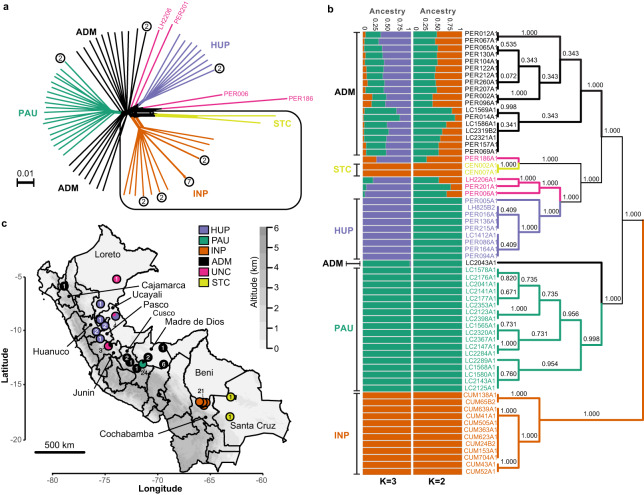
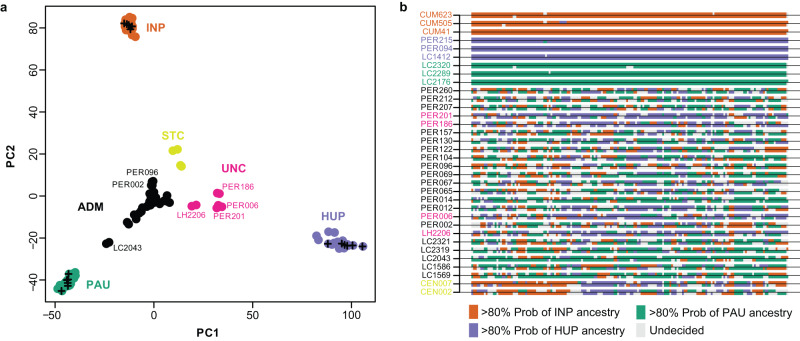
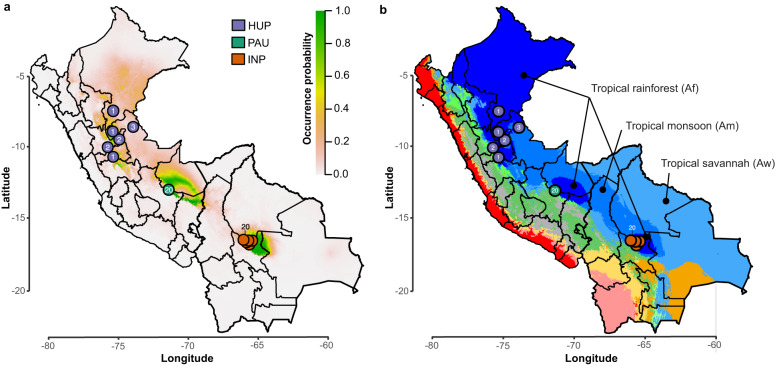
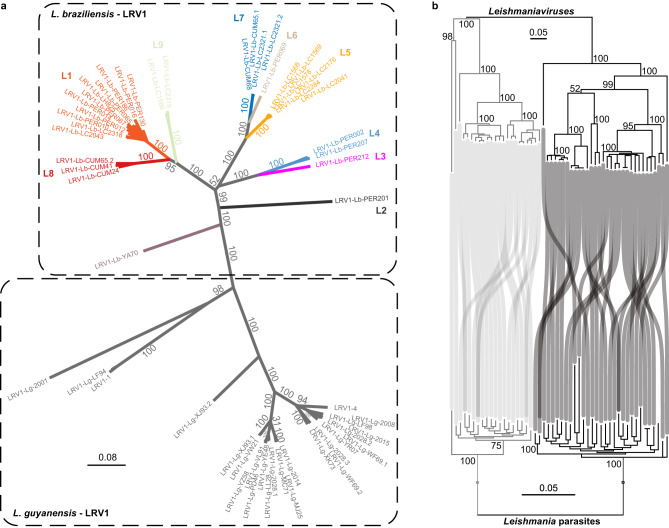
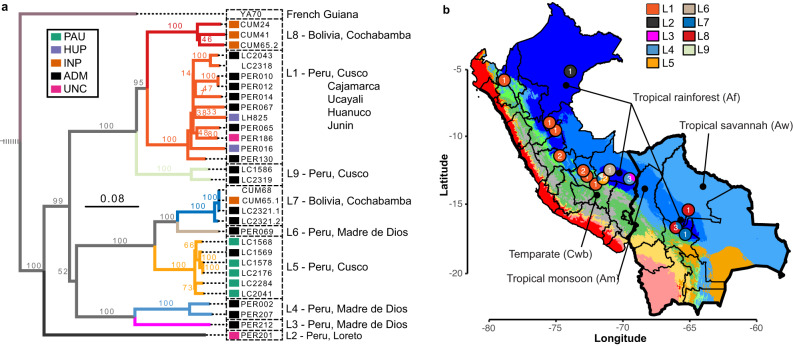
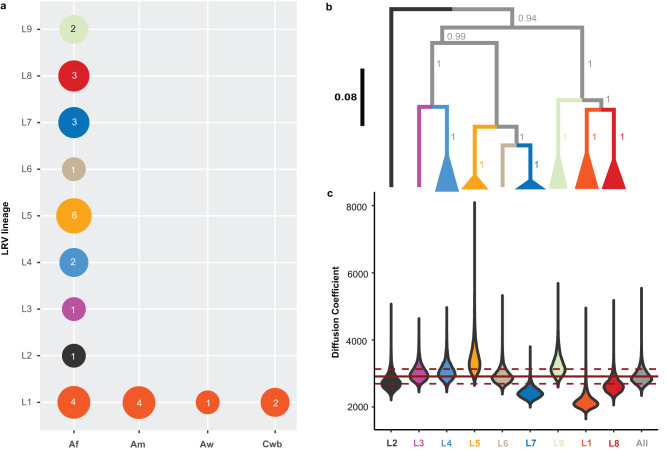
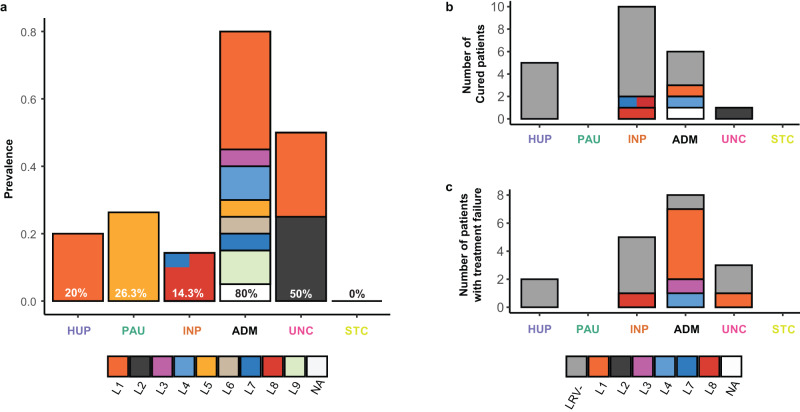
Viruses are the most abundant biological entities on Earth and play a significant role in the evolution of many organisms and ecosystems. In pathogenic protozoa, the presence of viruses has been linked to an increased risk of treatment failure and severe clinical outcome. Here, we studied the molecular epidemiology of the zoonotic disease cutaneous leishmaniasis in Peru and Bolivia through a joint evolutionary analysis of Leishmania braziliensis and their dsRNA Leishmania virus 1. We show that parasite populations circulate in tropical rainforests and are associated with single viral lineages that appear in low prevalence. In contrast, groups of hybrid parasites are geographically and ecologically more dispersed and associated with an increased prevalence, diversity and spread of viruses. Our results suggest that parasite gene flow and hybridization increased the frequency of parasite-virus symbioses, a process that may change the epidemiology of leishmaniasis in the region.


Conflict of interest statement

The authors declare no competing interests.

Figures

Fig. 1
Fig. 1. Population genomic structure and admixture in L. braziliensis from Peru and Bolivia.
a Phylogenetic network as inferred with SPLITSTREE based on uncorrected p-distances between 76 L. braziliensis genomes (excluding isolates CUM68, LC2318 and PER231) typed at 407,070 bi-allelic SNPs. Branches are colored according to groups of parasites as inferred with ADMIXTURE, fineSTRUCTURE and PCAdmix (Fig. 2a). Box indicates the position of the Bolivian genomes; all other genomes were sampled in Peru. Circles at the tips of seven branches point to groups of near-identical genomes and show the number of isolates. The terminal branches are colored according to the parasite groups as shown in (b, c), while the colors of the internal branches were left black. b ADMIXTURE barplot summarizing the ancestry components assuming K = 2 or K = 3 populations in 65 genomes (i.e., excluding near-identical genomes). The phylogenetic tree summarizes the fineSTRUCTURE clustering results based on the haplotype co-ancestry matrix (Supplementary Fig. 5). Numbers indicate the MCMC posterior probability of a given clade. Braces indicate the three ancestral populations (INP, HUP, PAU) and two groups of admixed parasites (ADM, STC); the remainder of the parasites were of uncertain ancestry (UNC). c Geographic map of Peru and Bolivia showing the origin of the 76 genomes. Dots are colored according to parasite groups as inferred with ADMIXTURE, fineSTRUCTURE and PCAdmix (Fig. 2a). Gray -scale represents altitude in kilometers, indicating the position of the Andes along the Peruvian and Bolivian Coast. Names are given for those Peruvian and Bolivian departments where a parasite was isolated. Country-level data for Peru and Bolivia, including administrative boundaries and altitude, were available from: http://www.diva-gis.org/Data. Source data are provided as a Source Data file.
Fig. 2
Fig. 2. Mosaic ancestry in hybrid parasites.
a PCA-based ancestry assignment of parasites (phased haplotypes) of uncertain ancestry (ADM, UNC, STC) assuming three ancestral populations (PAU, INP, HUP). Plus signs indicate three randomly selected genomes of each source population that were used as controls. b PCA-based local ancestry assignment to PAU, INP and HUP source populations of 19 ADM, 4 UNC, 2 STC isolates and three randomly selected isolates from each source population. Ancestry was assigned in windows of 30 SNPs along chromosome 35 (examples for other chromosomes are shown in Supplementary Fig. 7). Source data are provided as a Source Data file.
Fig. 3
Fig. 3. Impact of environment and geography on parasite genomic variability.
a Partial RDA model including geography, isothermality (bio3) and precipitation of driest month (bio14). Bioclimatic variables were selected based on the automated variable selection approach (Supplementary Data 5, see methods). b Partial RDA model including geography, isothermality (bio3), precipitation of driest month (bio14), precipitation of warmest quarter (bio18), precipitation seasonality (bio15) and annual mean diurnal range (bio2). Bioclimatic variables were selected based on the manual variable selection approach (Supplementary Data 5, see methods). Source data are provided as a Source Data file.
Fig. 4
Fig. 4. Distribution of ancestral parasite populations in Peru and Bolivia.
a Present-day predicted suitability regions (rm = 1.5) for L. braziliensis as revealed with ecological niche modeling. The continuous-scale legend represents habitat suitability (probability of occurrence). Map shows the distribution of isolates belonging to the three ancestral parasite populations HUP, PAU and INP. b Base map represents ecological regions in Peru and Bolivia as per Köppen-Geiger climate classification. Only three ecological regions were labeled for visibility reasons. The distribution is shown for isolates (colored circles) belonging to the three ancestral parasite populations HUP, PAU and INP. Country-level data for Peru and Bolivia, including administrative boundaries, were available from: http://www.diva-gis.org/Data.
Fig. 5
Fig. 5. Co-divergence of Leishmania and LRV1.
a Unrooted maximum likelihood phylogenetic tree based on 31 LRV1 genomes of L. braziliensis from Peru and Bolivia, one LRV1 genome (YA70) of L. braziliensis from French Guiana and 26 LRV1 genomes of L. guyanensis from Brazil, Suriname and French Guiana. LRV1 sequences of L. braziliensis are colored according to the different viral lineages identified in this study (L1-L9) (see Fig. 6). Branch values represent bootstrap support based on 100 replicates. b Phylogenetic tangle plot revealing clear patterns of virus-parasite co-divergence between L. braziliensis and L. guyanensis and their respective LRV1 clades. The gray and black branches and tree links correspond to L. guyanensis and L. braziliensis, respectively. Branch values represent bootstrap support based on 100 replicates.
Fig. 6
Fig. 6. Evolutionary history of LRV1 in Peru and Bolivia.
a Midpoint-rooted maximum likelihood phylogenetic tree based on 31 LRV1 genomes of L. braziliensis from Peru and Bolivia, one LRV1 genome (YA70) of L. braziliensis from French Guiana and 26 LRV1 genomes of L. guyanensis from Brazil, Suriname and French Guiana (the latter were omitted for visibility reasons). The position of the root is indicated with a dashed line. Clades are colored according to the different viral lineages (L1-L9). Branch values represent bootstrap support based on 100 replicates. The scale bar depicts the number of substitutions per site. Colored boxes at the tips of each branch represent the population structure of L. braziliensis (see legend), with colors matching the different groups of parasites as shown in Fig. 1. Note that the tetraploid hybrid parasites LC2318 and CUM68 from Peru and Bolivia, and isolate YA70 from French Guiana were omitted from the analyses of parasite population structure; these were thus not assigned to any parasite group. b Base map represents the ecological regions in Peru and Bolivia as per Köppen-Geiger climate classification. Only four ecological regions were labeled for visibility reasons. The distribution is shown for the nine viral lineages L1-L9 (colored circles). Country-level data for Peru and Bolivia, including administrative boundaries, were available from: http://www.diva-gis.org/Data.
Fig. 7
Fig. 7. Phylogeographic reconstruction of LRV1.
a LRV1 sample size structured per lineage and per ecological region as per Köppen-Geiger classification. Af tropical rainforest. Am Tropical monsoon forest. Aw Tropical savannah. Cwb Temperate, dry winter, warm summer. b The summarized maximum clade credibility (MCC) tree (excluding PER010) from the posterior tree distribution. Lineages are collapsed for visibility purposes and are color coded according to the x-axis in (c). Branch support values represent posterior probabilities. The black scale bar represents the number of substitutions per site. c Distribution of the inferred diffusion coefficients of the whole LRV1 dataset (excluding PER010) and lineage-excluded partitions. The most right violin (gray) represents the diffusion coefficient distribution of the full LRV1 phylogeny. The other violins (colored per lineage) represent the change in the diffusion coefficient after removal of the specified lineage from the phylogeny. The solid and dashed red lines show the mean diffusion coefficient from the full LRV1 phylogeny and the standard deviation, respectively. Source data are provided as a Source Data file.
Fig. 8
Fig. 8. Viral prevalence and lineage diversity among parasite groups.
a Prevalence of LRV1 in each of the inferred parasite groups. Occurrence of clinical cure (b) and treatment failure (c) for the different parasite groups. In all panels, the colored stacked bars represent the contribution of each viral lineage. Source data are provided as a Source Data file.

Update of

References

    1. Wang AL, Wang CC. Viruses of the protozoa. Annu. Rev. Microbiol. 1991;45:251–263. doi: 10.1146/annurev.mi.45.100191.001343. - DOI - PubMed
    1. Banik G, Stark D, Rashid H, Ellis J. Recent advances in molecular biology of parasitic viruses. Infect. Disord. - Drug Targets. 2015;14:155–167. doi: 10.2174/1871526514666140713160905. - DOI - PubMed
    1. Ghabrial SA, Castón JR, Jiang D, Nibert ML, Suzuki N. 50-plus years of fungal viruses. Virology. 2015;479-480:356–368. doi: 10.1016/j.virol.2015.02.034. - DOI - PubMed
    1. Chen B, Geletka LM, Nuss DL. Using chimeric hypoviruses to fine-tune the interaction between a pathogenic fungus and its plant host. J. Virol. 2000;74:7562–7567. doi: 10.1128/JVI.74.16.7562-7567.2000. - DOI - PMC - PubMed
    1. Applen Clancey, S., Ruchti, F., LeibundGut-Landmann, S., Heitman, J. & Ianiri, G. A novel mycovirus evokes transcriptional rewiring in the fungus malassezia and stimulates beta interferon production in macrophages. MBio11, e01534-20 (2020). - PMC - PubMed

Publication types