. 2023 Dec 15;9(1):102.
doi: 10.1038/s41522-023-00471-8.

A manifold-based framework for studying the dynamics of the vaginal microbiome

Affiliations

A manifold-based framework for studying the dynamics of the vaginal microbiome

Mor Tsamir-Rimon et al. NPJ Biofilms Microbiomes. .

Abstract

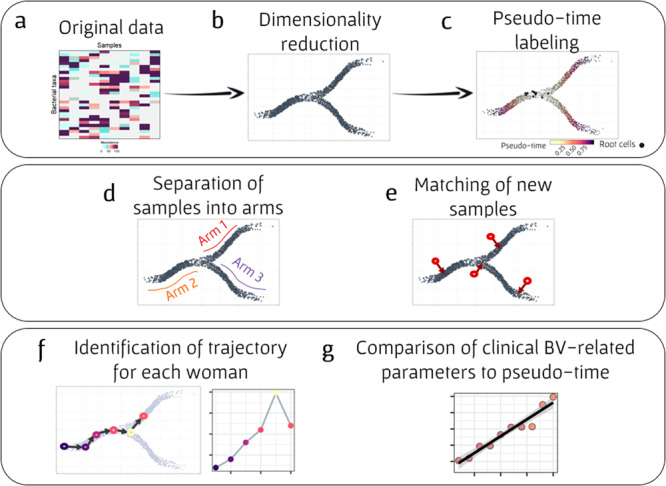
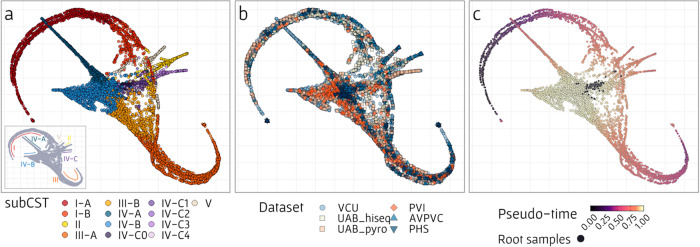
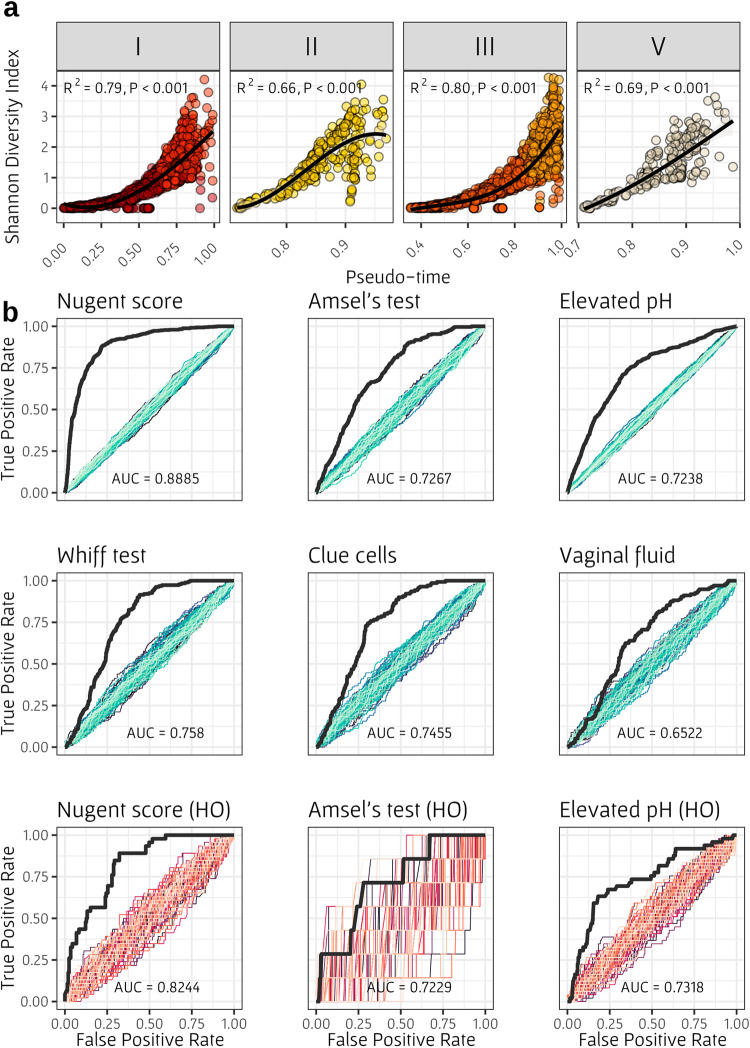
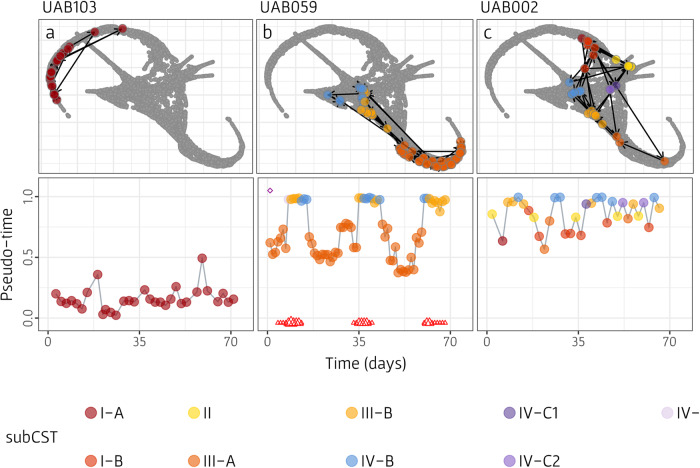
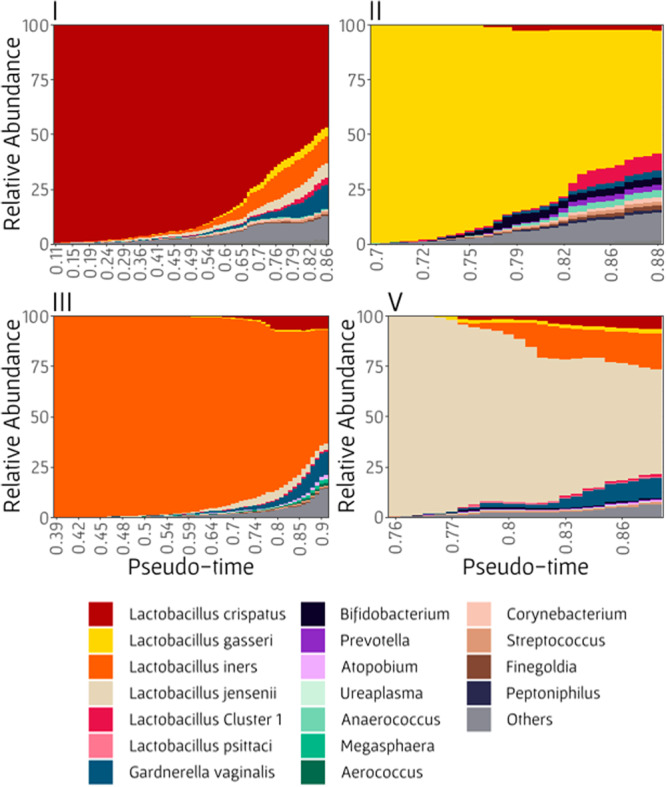
The vaginal microbiome plays a crucial role in our health. The composition of this community can be classified into five community state types (CSTs), four of which are primarily consisted of Lactobacillus species and considered healthy, while the fifth features non-Lactobacillus populations and signifies a disease state termed Bacterial vaginosis (BV), which is associated with various symptoms and increased susceptibility to diseases. Importantly, however, the exact mechanisms and dynamics underlying BV development are not yet fully understood, including specifically possible routes from a healthy to a BV state. To address this gap, this study set out to characterize the progression from healthy- to BV-associated compositions by analyzing 8026 vaginal samples and using a manifold-detection framework. This approach, inspired by single-cell analysis, aims to identify low-dimensional trajectories in the high-dimensional composition space. It further orders samples along these trajectories and assigns a score (pseudo-time) to each analyzed or new sample based on its proximity to the BV state. Our results reveal distinct routes of progression between healthy and BV states for each CST, with pseudo-time scores correlating with community diversity and quantifying the health state of each sample. Several BV indicators can also be successfully predicted based on pseudo-time scores, and key taxa involved in BV development can be identified using this approach. Taken together, these findings demonstrate how manifold detection can be used to successfully characterize the progression from healthy Lactobacillus-dominant populations to BV and to accurately quantify the health condition of new samples along the route of BV development.


Conflict of interest statement

The authors declare no competing interests.

Figures

Fig. 1
Fig. 1. Analysis scheme of the manifold detection framework.
a The framework takes as input a high-dimensional microbial data table, describing microbial features of each sample. b Data are then projected onto a lower dimensional space, resulting in a compositional manifold. c Each sample is labeled with a pseudo-time score, calculated based on its distance along the manifold from a pre-defined group of root samples. d The manifold is also partitioned into “arms” (which represent distinct routes on the manifold and different possible routes to BV), based on the assigning CSTs to the various sample. e New samples are matched to their nearest neighbor on the manifold, obtaining their pseudo-time label and location on the manifold from their nearest neighbor. f Samples from a longitudinal dataset can be mapped to this manifold and used to characterize the trajectory of each woman along the manifold, comparing samples’ pseudo-time labels to the chronological time in which the sample was obtained. g Pseudo-time labels associations with various clinical BV-related variables, including community diversity, Nugent score, and pH, can be examined.
Fig. 2
Fig. 2. Visualization of the vaginal microbiome composition manifold and its relation to various sample properties.
Each point represents a single sample (from the pooled set of 8026 samples from the five datasets analyzed), where its location was determined by low dimensionality reduction using the PAGA algorithm. a Colors indicate the subCST determined for each sample based on VALENCIA. The inset on the bottom left corner represents the partition of the samples into the different manifold’s arms, where each arm is associated with a different CST. b Colors indicate the dataset each sample was obtained from. The UAB dataset was further partitioned according to the sequencing method that was used. c Colors indicate the pseudo-time label that was assigned to each sample based on results from the PAGA algorithm. Black points denote root samples, defined as highly diverse samples (Shannon diversity index >3.5) with positive Amsel’s test.
Fig. 3
Fig. 3. Association between pseudo-time labels and BV-related clinical indicators.
a Shannon-diversity index as a function of pseudo-time label in healthy arms. Each plot represents a different CST arm and colors indicate subCST, including in total 4627 healthy samples from all five datasets. The black line represents a linear regression to transformed polynomial values of pseudo-time. The R2 and p value presented in each panel were determined by Spearman correlation test. b Receiver operating characteristic (ROC) curves for predicting six BV indicators with pseudo-time labels. The area under the ROC curve (AUC) is presented at the bottom of each plot. Colored curves represent prediction obtained using shuffled indicator labels. Bottom plots represent similar analysis, based only on held-out samples. The manifold-based curves are constructed using a range of 677–4055 samples (depending on the datasets that included the required data), while the held-out-based curves are generated using between 251–501 samples.
Fig. 4
Fig. 4. A manifold-based characterization of the trajectories of three representative women from the daily longitudinal dataset (UAB).
The top plot in each panel (ac) illustrates the trajectory of the woman on the detected manifold. Gray dots represent the UMAP visualization of the vaginal microbiome composition manifold, and colored dots represent the locations of samples obtained from a specific woman, where each color represent the determined subCST of the sample. Black arrows denote the direction of the woman’s trajectory, showing the order of the samples based on the time they were obtained in the experiment. The bottom plot in each panel illustrates pseudo-time progression of the woman, as a function of chronological time. Dots colors are as in the top plots. Red triangles at the bottom of the plot represent self-reported menstruation, where size indicates menstruation spotting (small), medium or heavy bleeding (large).
Fig. 5
Fig. 5. Bacterial taxa’s relative abundances as a function of by pseudo-time.
Each plot represents the taxa’s abundances in each healthy manifold arm (I, II, III, and V). Taxa’s abundances were averaged using a sliding window approach to reduce noise.

Update of

Similar articles

References

    1. Alisoltani A, et al. Microbial function and genital inflammation in young South African women at high risk of HIV infection. Microbiome. 2020;8:1–21. doi: 10.1186/s40168-020-00932-8. - DOI - PMC - PubMed
    1. Ziklo N, Vidgen ME, Taing K, Huston WM, Timms P. Dysbiosis of the vaginal microbiota and higher vaginal kynurenine/tryptophan ratio reveals an association with Chlamydia trachomatis genital infections. Front. Cell. Infect. Microbiol. 2018;8:1–11. doi: 10.3389/fcimb.2018.00001. - DOI - PMC - PubMed
    1. Ravel J, et al. Vaginal microbiome of reproductive-age women. Proc. Natl Acad. Sci. USA. 2011;108:4680–4687. doi: 10.1073/pnas.1002611107. - DOI - PMC - PubMed
    1. Zhou X, et al. Differences in the composition of vaginal microbial communities found in healthy Caucasian and black women. ISME J. 2007;1:121–133. doi: 10.1038/ismej.2007.12. - DOI - PubMed
    1. France MT, et al. VALENCIA: a nearest centroid classification method for vaginal microbial communities based on composition. Microbiome. 2020;8:1–15. doi: 10.1186/s40168-020-00934-6. - DOI - PMC - PubMed