. 2023 Dec 15;6(1):1271.
doi: 10.1038/s42003-023-05676-3.

The centrosomal protein 131 participates in the regulation of mitochondrial apoptosis

Affiliations

The centrosomal protein 131 participates in the regulation of mitochondrial apoptosis

Clotilde C N Renaud et al. Commun Biol. .

Abstract

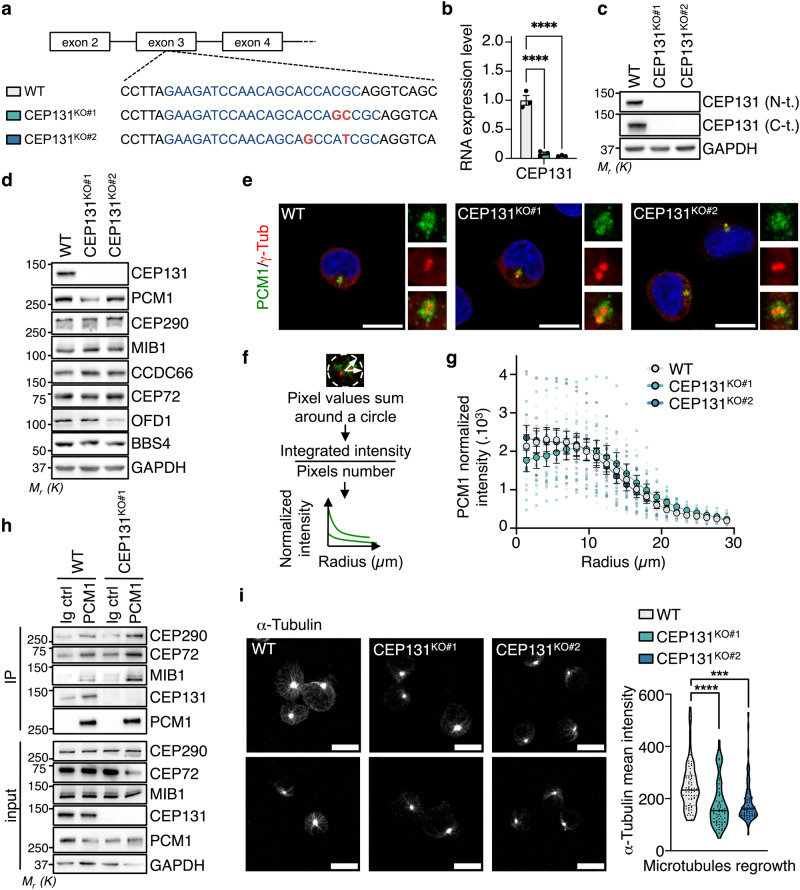
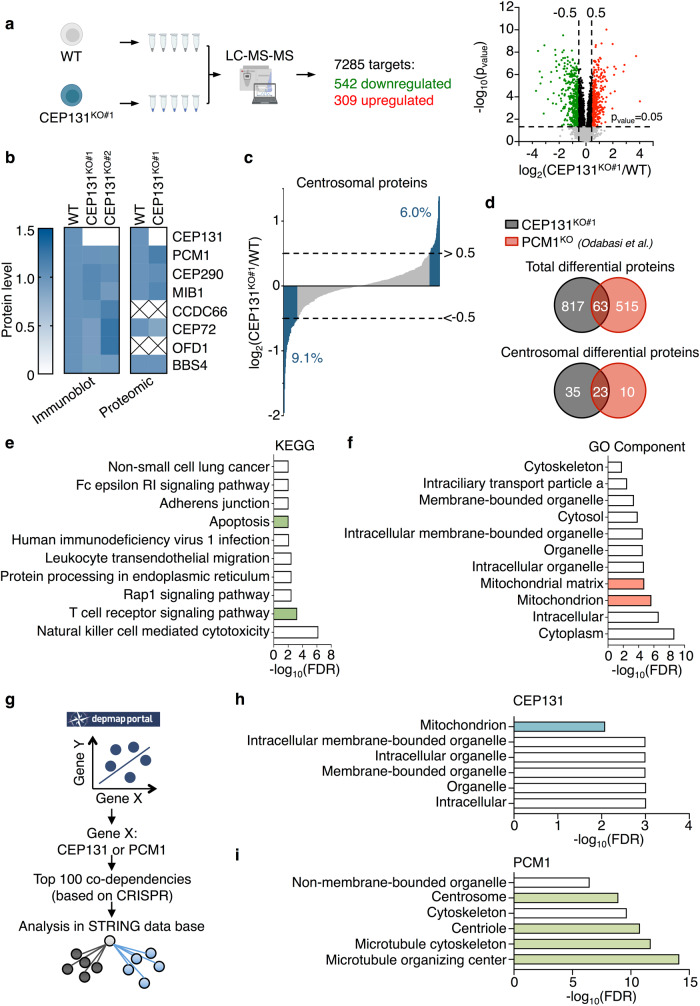
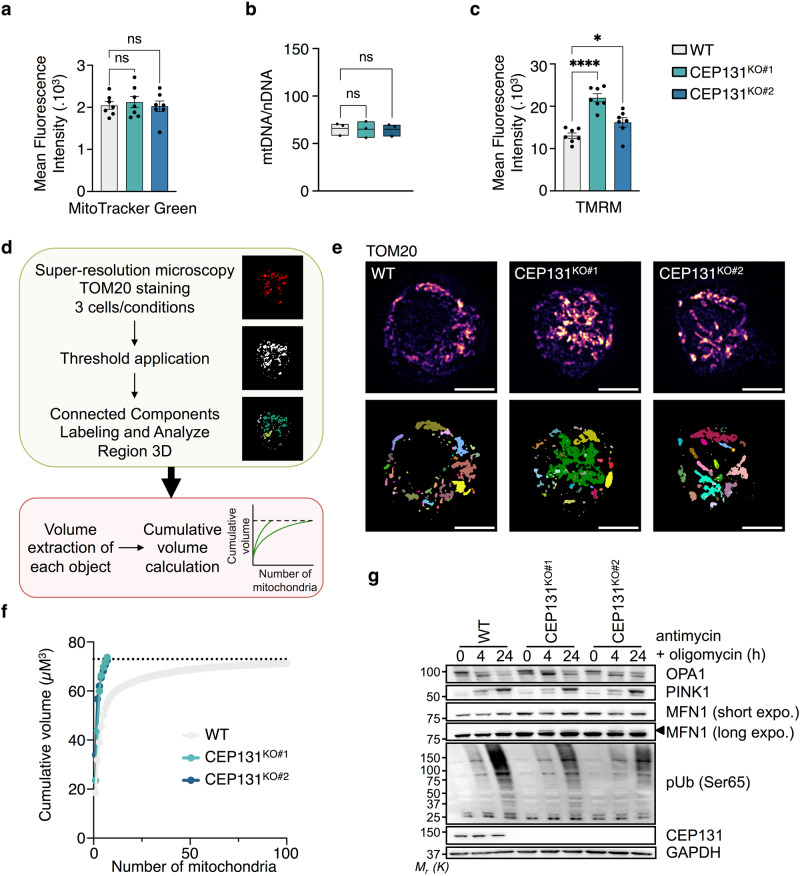
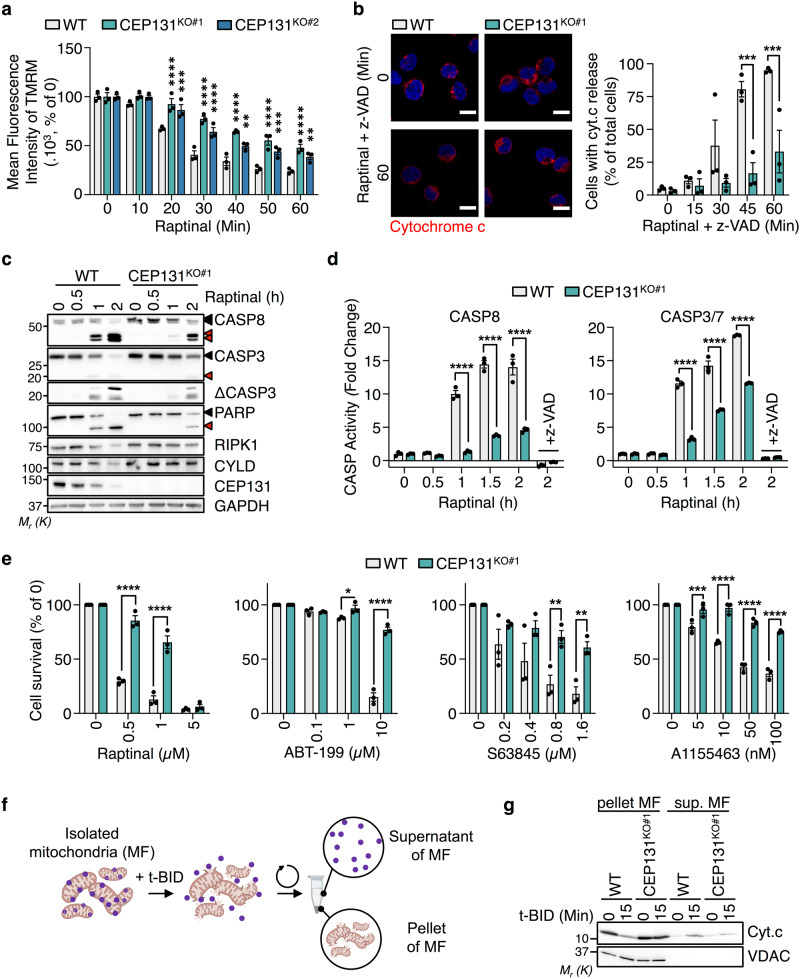
Centriolar satellites are multiprotein aggregates that orbit the centrosome and govern centrosome homeostasis and primary cilia formation. In contrast to the scaffold PCM1, which nucleates centriolar satellites and has been linked to microtubule dynamics, autophagy, and intracellular trafficking, the functions of its interactant CEP131 beyond ciliogenesis remain unclear. Using a knockout strategy in a non-ciliary T-cell line, we report that, although dispensable for centriolar satellite assembly, CEP131 participates in optimal tubulin glycylation and polyglutamylation, and microtubule regrowth. Our unsupervised label-free proteomic analysis by quantitative mass spectrometry further uncovered mitochondrial and apoptotic signatures. CEP131-deficient cells showed an elongated mitochondrial network. Upon cell death inducers targeting mitochondria, knockout cells displayed delayed cytochrome c release from mitochondria, subsequent caspase activation, and apoptosis. This mitochondrial permeabilization defect was intrinsic, and replicable in vitro with isolated organelles. These findings extend CEP131 functions to life-and-death decisions and propose ways to interfere with mitochondrial apoptosis.


Conflict of interest statement

The authors declare no competing interests.

Figures

Fig. 1
Fig. 1. Characterization of CEP131 knockout Jurkat cells.
a Schematic representation of the CEP131 gene, with positioning of the CRISPR sequence guide (blue) in exon 3. Genomic sequences in wild-type (WT) and two bi-allelic clones (KO#1 and KO#2; mutations in red) are shown. b The RNA expression level of CEP131 was assessed by qPCR in WT, CEP131KO#1, and KO#2 cells (mean ± SEM, n = 3 biological replicates, fold change using ACTB and HPRT1 as housekeeping genes for normalization, one-way ANOVA, ****p < 0.0001). c, d Lysates from WT, CEP131 KO#1, and KO#2 Jurkat cells were prepared and analyzed by immunoblotting with antibodies specific to the indicated proteins. e Representative immunofluorescence images of PCM1 (green) and γ-tubulin (red) in WT, CEP131 KO#1, and KO#2 Jurkat cells. Nuclei were counterstained with 4’−6-diamidino-2- phenylindole (DAPI). Scale bars, 10 µm. f, g Radial profile analysis of PCM1 in a 29 µm circle whose center is defined by γ-tubulin, in WT, CEP131 KO#1, and KO#2 Jurkat cells (mean ± SEM of n = 10 cells/condition). h Cell lysates from WT, CEP131 KO#1, and KO#2 Jurkat were immunoprecipitated (IP) with antibodies against PCM1 or with non-relevant Ig (negative control). Samples were then analyzed by immunoblotting as indicated. Inputs are the total lysates collected before the IP. i WT, CEP131 KO#1, and KO #2 Jurkat cells were treated with 10 µM nocodazole for 1 h, prior to washing. Microtubule regrowth was assessed after 5 min by confocal microscopy analysis of α-tubulin. Representative images of three independent experiments (left) (scale bars, 10 µm), and quantification of α-tubulin intensity of one representative experiment (right) (n = 70 cells/condition; one-way ANOVA, ****p < 0.0001). Data information: (c, d, h) GAPDH served as a loading control. Molecular weight markers (Mr) are shown. Data are representative of three independent experiments.
Fig. 2
Fig. 2. CEP131 knockout Jurkat cells display an apoptosis and mitochondrial signature.
a Schematic overview of the mass spectrometry analysis performed on five biological replicates of wild-type (WT) or CEP131 KO#1 Jurkat cells. The volcano plot illustrates the 7285 detected proteins of which 542 are downregulated and 309 are upregulated. Proteins were classified as downregulated or upregulated if the pvalue < 0.05 and |log2(fold change)|>0.5. b Heatmaps representing the abundance of centriolar satellite components based on the densitometric analysis performed on immunoblotting of lysates from WT, CEP131KO#1, and KO#2 Jurkat cells (mean of n = 3 biological replicates) and on the proteomic analysis of WT and CEP131 KO#1 Jurkat cells (mean of n = 5 biological replicates). c Comparison of the CEP131 KO#1 Jurkat cells proteome to the centrosomal proteome (GO:0005813). Upregulated and downregulated proteins among the 385 detected centrosomal ones are shown in blue and percentages are indicated ( | log2(FC)|>0.5). d Comparison of the proteome of CEP131 KO#1 Jurkat cells with the one of PCM1 knockout IMCD3 cells. The top Venn diagram shows total differential proteins and the bottom Venn diagram is focused on centrosomal differential proteins (pvalue < 0.05, |log2(FC) | > 0.5). e The top 10 KEGG pathways enriched for the proteins significantly downregulated in CEP131 KO#1 Jurkat cells (pvalue < 0.05, log2(FC) < −0.5). f The top 10 GO Component enrichment for the proteins significantly upregulated in CEP131 KO#1 Jurkat cells is presented (pvalue < 0.05, log2(FC) > 0.5). g–i Workflow of the data mining performed (g). The top 100 genes that presented co-dependencies (based on CRISPR screening) with CEP131 or PCM1 were extracted from the depmap portal database. Analysis of the enrichment was done on the STRING database and compartments enriched in the top 100 co-dependencies with CEP131 (h) or PCM1 (i) are presented. Data information: (e, f, h, i) data are represented using the false discovery rate (FDR).
Fig. 3
Fig. 3. CEP131 participates in mitochondrial dynamics.
a Flow cytometry analysis of the mitochondrial mass using MitoTracker Green in wild-type (WT), CEP131 KO#1, and KO#2 Jurkat cells (mean ± SEM, n = 7 biological replicates, one-way ANOVA, ns: non-significant). b Expression of the mitochondrial DNA (mtDNA) normalized to the nuclear DNA (nDNA) assessed by qPCR. For mtDNA and nDNA, the expression of three genes were measured and the mean of three ratios mtDNA/nDNA is presented for n = 3 biological replicates (one-way ANOVA, ns: non-significant). c Flow cytometry analysis of the mitochondrial transmembrane potential using TMRM (tetramethylrhodamine) in WT, CEP131 KO#1, and KO#2 Jurkat cells (mean ± SEM, n = 7 biological replicates, one-way ANOVA, *p < 0.05, ****p < 0.0001). d Schematic overview of the workflow used to measure mitochondrial volumes. e TOM20 staining analysis by structure illumination microscopy (SIM) in WT, CEP131 KO#1, and #2 cells. Top panel, max intensity projection of z-stacked images are shown. Bottom panel, each detected object is represented by one color as explained in (d). Representative images of three independent experiments are shown (scale bars, 10 µm). f Cumulative plots of mitochondrial volume distribution in WT and CEP131 knockout cells derived from (e) (three cells/conditions). Data are representative of three independent experiments. g Cell lysates from WT, CEP131 KO#1, and KO#2 cells stimulated with 1 µM antimycin and 1 µM oligomycin for the indicated times were prepared and analyzed by immunoblotting with specific antibodies. Black arrowhead, ubiquitinated MFN1. GAPDH served as a loading control. Molecular weight markers (Mr) are shown. Data are representative of three independent experiments.
Fig. 4
Fig. 4. CEP131 participates in mitochondria-dependent cell death.
a Wild-type (WT), CEP131 KO#1, and KO#2 Jurkat cells were treated with 10 µM Raptinal for the indicated times and mitochondria membrane potential was assessed by flow cytometry analysis using TMRM (mean ± SEM, n = 3 biological replicates, two-way ANOVA, **p < 0.01, ***p < 0.001, ****p < 0.0001). b Left, confocal microscopy analysis of cytochrome c distribution (red) in cells treated as indicated. The pan-caspase inhibitor z-VAD was added 30 min prior to treatment with Raptinal. Nuclei were counterstained with 4’−6-diamidino-2- phenylindole (DAPI). Scale bars, 10 µm. Representative images of three independent experiments are shown. Right, quantification of the percentage of cells presenting cytochrome c release (mean ± SEM, n = 3 biological replicates, two-way ANOVA, ***p < 0.001). c Cell lysates from WT and CEP131 KO#1 cells stimulated with 10 µM Raptinal for the indicated times were prepared and analyzed by immunoblotting with specific antibodies. Full-length and cleaved protein forms are indicated with black and red arrowheads, respectively. GAPDH served as a loading control. d CASP8 and CASP3/CASP7 catalytic activity was measured by luminescent substrate cleavage (Caspase-Glo assay) in cells treated with 10 µM Raptinal for the indicated times. The pan-caspase inhibitor z-VAD (20 µM) was added 30 min prior to treating with Raptinal and served as a control (mean ± SEM, n = 3 technical replicates, one representative experiment of three independent one is shown, two-way ANOVA, ****p < 0.0001). e Cell viability was assessed by CellTiter Glo in cells treated with increasing concentrations of Raptinal, ABT-199, S63845, or A1155463 for 16 h in WT and CEP131 KO#1 cells (mean ± SEM, n = 3 biological replicates, two-way ANOVA, *p < 0.05, **p < 0.01, ***p < 0.001, ****p < 0.0001). f, g Fractions enriched with mitochondria (mitochondrial fraction, MF) from WT and CEP131 KO#1 cells were treated with 10 nM truncated BID (t-BID) at 30 °C for 0 and 15 min. After a centrifugation step, the supernatants and mitochondria pellets were collected and analyzed by immunoblotting with antibodies against cytochrome c (cyt.c). VDAC served as a control of mitochondria isolation. Data information: (c, g). Molecular weight markers are shown. Data are representative of three independent experiments.

Similar articles

Cited by

References

    1. Prosser SL, Pelletier L. Centriolar satellite biogenesis and function in vertebrate cells. J. Cell Sci. 2020;133:jcs239566. doi: 10.1242/jcs.239566. - DOI - PubMed
    1. Kubo A, Tsukita S. Non-membranous granular organelle consisting of PCM-1: subcellular distribution and cell-cycle-dependent assembly/disassembly. J. Cell Sci. 2003;116:919–928. doi: 10.1242/jcs.00282. - DOI - PubMed
    1. Odabasi E, Batman U, Firat-Karalar EN. Unraveling the mysteries of centriolar satellites: time to rewrite the textbooks about the centrosome/cilium complex. Mol. Biol. Cell. 2020;31:866–872. doi: 10.1091/mbc.E19-07-0402. - DOI - PMC - PubMed
    1. Rai AK, Chen J-X, Selbach M, Pelkmans L. Kinase-controlled phase transition of membraneless organelles in mitosis. Nature. 2018;559:211–216. doi: 10.1038/s41586-018-0279-8. - DOI - PubMed
    1. Villumsen BH, et al. A new cellular stress response that triggers centriolar satellite reorganization and ciliogenesis: Stress-induced reorganization of centriolar satellites. EMBO J. 2013;32:3029–3040. doi: 10.1038/emboj.2013.223. - DOI - PMC - PubMed

Publication types