. 2024 Jan;25(1):155-165.
doi: 10.1038/s41590-023-01688-7. Epub 2023 Dec 15.

Human serous cavity macrophages and dendritic cells possess counterparts in the mouse with a distinct distribution between species

Affiliations

Human serous cavity macrophages and dendritic cells possess counterparts in the mouse with a distinct distribution between species

Jichang Han et al. Nat Immunol. 2024 Jan.

Abstract

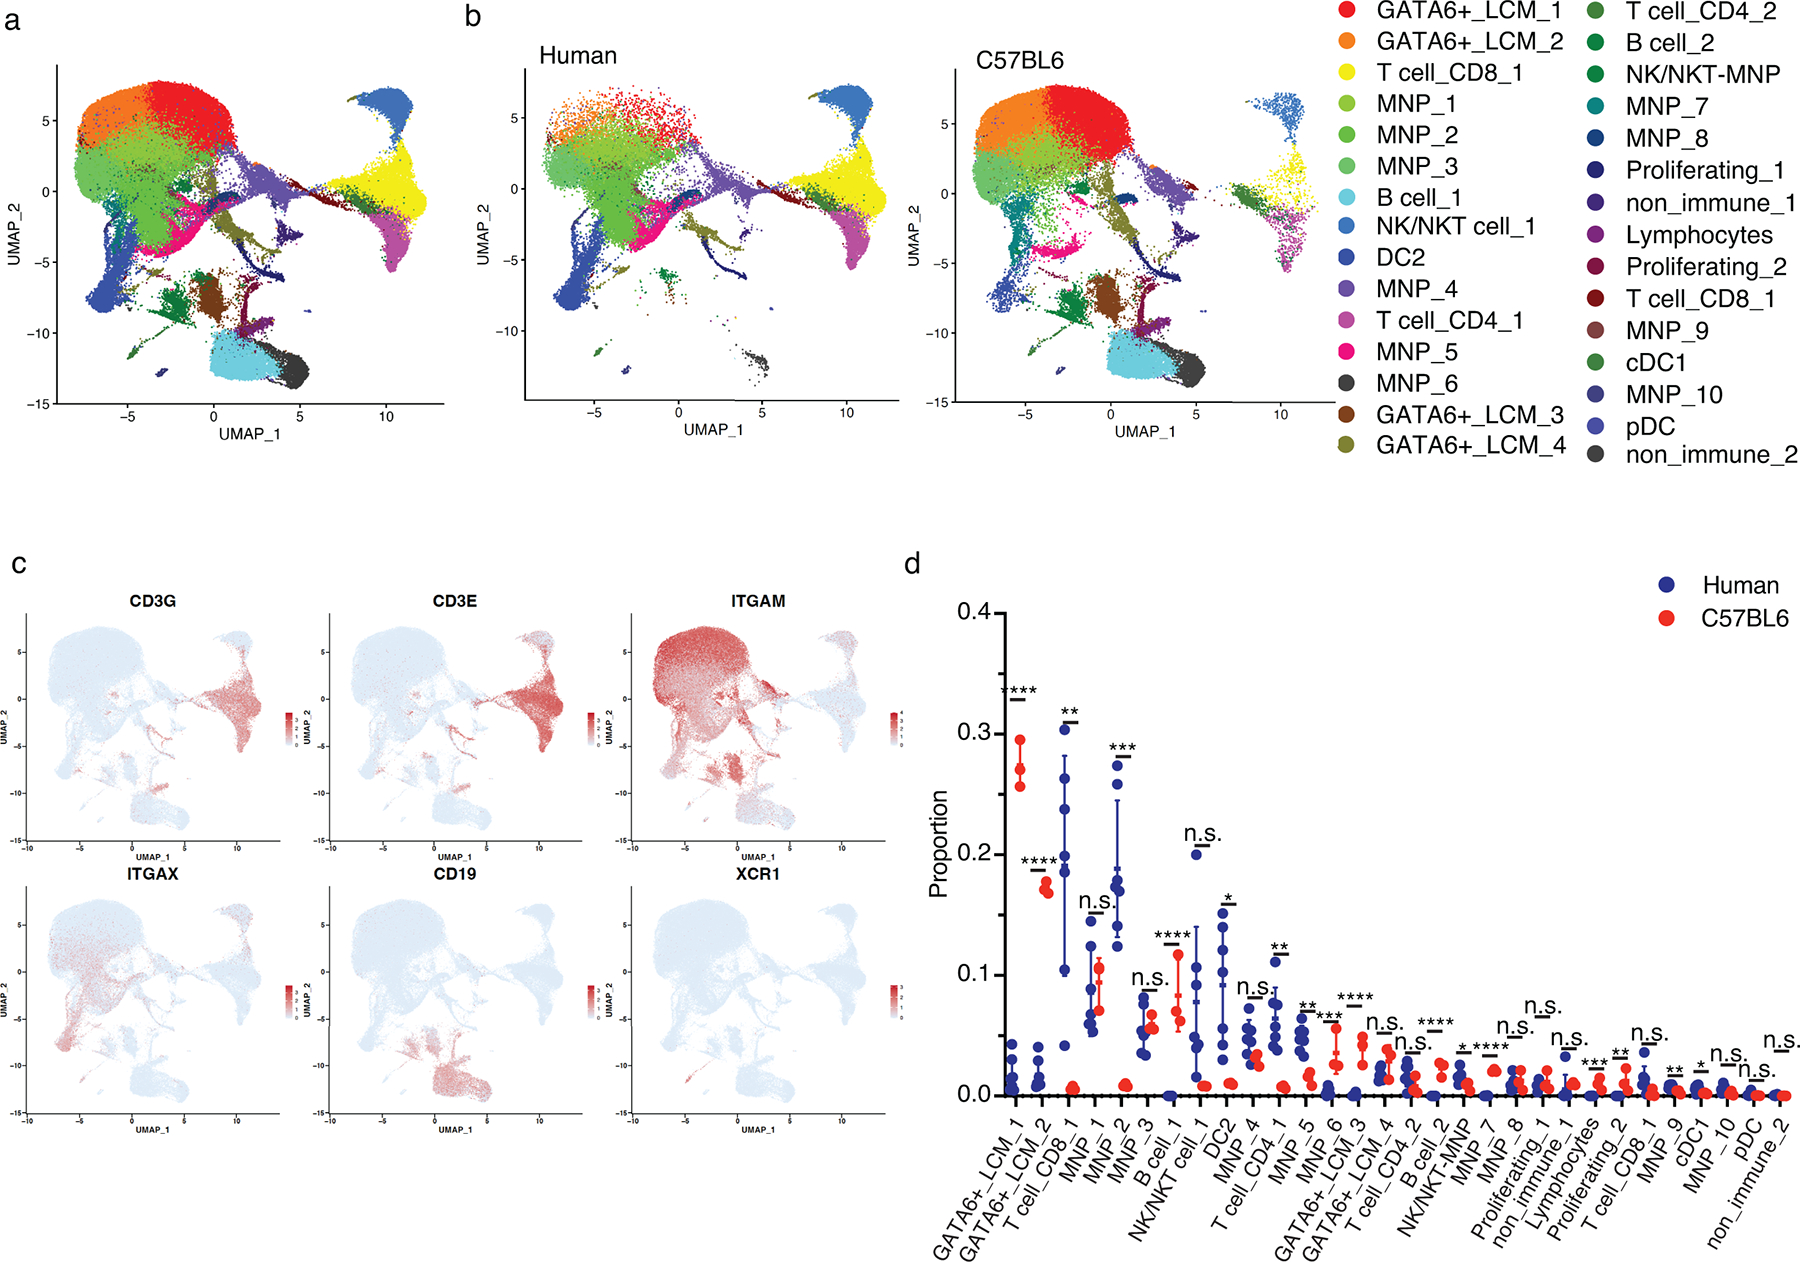
In mouse peritoneal and other serous cavities, the transcription factor GATA6 drives the identity of the major cavity resident population of macrophages, with a smaller subset of cavity-resident macrophages dependent on the transcription factor IRF4. Here we showed that GATA6+ macrophages in the human peritoneum were rare, regardless of age. Instead, more human peritoneal macrophages aligned with mouse CD206+ LYVE1+ cavity macrophages that represent a differentiation stage just preceding expression of GATA6. A low abundance of CD206+ macrophages was retained in C57BL/6J mice fed a high-fat diet and in wild-captured mice, suggesting that differences between serous cavity-resident macrophages in humans and mice were not environmental. IRF4-dependent mouse serous cavity macrophages aligned closely with human CD1c+CD14+CD64+ peritoneal cells, which, in turn, resembled human peritoneal CD1c+CD14-CD64- cDC2. Thus, major populations of serous cavity-resident mononuclear phagocytes in humans and mice shared common features, but the proportions of different macrophage differentiation stages greatly differ between the two species, and dendritic cell (DC2)-like cells were especially prominent in humans.


Conflict of interest statement

Competing interests: The authors declare no competing interests.

Figures

Extended Data Figure 1.
Extended Data Figure 1.. Human peritoneal macrophages are heterogenous and have limited population expression GATA6.
(a) Heatmap of differentially expressed genes (rows) of different clusters (columns). Heatmap colors indicate Z-transformed expression of genes in each row, with scale depicted in legend. Annotations (left) highlight representative genes with high differential gene expression within each cluster, relative to other clusters. Colors of gene names indicate corresponding clusters in Fig. 1a. (b) The proportion of cells from each patient contributed to each cluster. Color represents different human samples. (c) Confocal images showing the channels of DAPI and CD14, CD62P and GATA6, separately for the merged image in Figure 1c. Biological samples were analyzed over two independent experiments. (d) Additional confocal images showing the expression GATA6 and CD62P in human adult peritoneal cells. Biological samples were analyzed over two independent experiments. (e) Violin plot showing the converting macrophage signature score (y-axis) in Figure 1f for each cluster (x-axis) (n=3977, 3537, 3504, 2169, 1895, 1571, 1551, 1518, 1001, 351, 347, 283,67,66,28,27 cells respectively). Red bars depict means with error bars representing standard deviation. A one-way ANOVA and post-hoc comparisons using Tukey’s HSD were conducted to compare the means of different groups, **** p<0.0001. (f) The spliced ratio of GATA6 transcripts in GATA6+ cells versus GATA6- cells in 7 human adult samples. Bars depict means with error bars representing standard deviation. ****p<0.0001, two-sided t-test. Exact p-value= 2.77028E-05 (g) Principal component analysis showing the distinct transcriptome profiles (microarray) between Gata6 KO and wild-type peritoneal macrophages integrated from three independent studies (GSE56711, GSE47049 and GSE37448).
Extended Data Figure 2.
Extended Data Figure 2.. Human and mouse peritoneal immune cell composition is different.
(a) UMAP projection of all CD45+ cells sequenced from the peritoneal cavity of 7 adults and 3 C57BL6 mice, forming 30 distinct clusters (colored as shown in the legend), with cluster names assigned based on inferred function. (b) UMAP plots showing the distinct immune cell composition of the mouse (right) and human (left) peritoneal cavity. Colors are coded as in a. (c) Feature plots demonstrating the expression of key immune cell markers, including markers for T and B lymphocytes and myeloid cells. Color scale represents the normalized gene expression. (d) Proportion of each cluster out of total immune cells for each sample, grouped by species (n=7 human adult samples and n=3 mouse samples). Bars depict means with error bars representing standard deviation. Multiple two-tailed t-tests followed by false discovery rate (FDR) correction; *p<0.05, **p<0.01, ***p<0.001, ****p<0.0001, n.s. not significant. The exact p-values and FDR corrected q-values are reported as Source Data
Extended Data Figure 3.
Extended Data Figure 3.. Further analysis of peritoneal MNPs between mouse and human.
(a) Heatmap of differentially expressed genes (rows) of different clusters (columns). Heatmap colors indicate Z-transformed expression of genes in each row, with scale depicted in legend. Annotations (left) highlight representative genes with high differential gene expression within each cluster, relative to other clusters. Colors of gene names indicate corresponding clusters in Fig. 2a. (b) Dot plot showing the average Z-transformed normalized expression of markers for large cavity-, converting- or monocyte like macrophages. The size of each dot indicates the fraction of cells expressing each gene; the color scale represents Z-transformed normalized expression. (c) The projection of cells from each cluster in Figure 1 in the new UMAP space of Figure 2. Colors correspond to Figure 1a. (d) UMAP projection showing the different cell cycle phases of the peritoneal immune cell subsets in mouse or human separately. Colors representing the predicted classification of cell cycle phase based on the S and G2/M scores calculated by the CellCycleScoring function in the Seurat package. (e) The proportions of cells in each cell cycle phase of mouse and human (n=7 human adult samples and n=3 mouse samples). Bars depict means with error bars representing standard deviation. * represents p<0.05, two-tailed t-test.
Extended Data Figure 4.
Extended Data Figure 4.. Summary of patient cohort and patient contributions to each cluster
(a) Summary for the age, gender and operational procedure of patients we have collected and analyzed in this study. The table was organized by the different experimental approaches performed on the samples collected. (b) Pie charts depicting the proportion of cells from each patient to the total number of cells in each cluster (Fig. 3a). Each color represents one individual patient, with the total number of each cluster labeled at the bottom of each pie chart.
Extended Data Figure 5.
(a) Heatmap of differentially expressed genes (rows) of different clusters (columns). Heatmap colors indicate Z-transformed expression of genes in each row, with scale depicted in legend. Annotations (left) highlight representative genes with high differential gene expression within each cluster, relative to other clusters. Colors of gene names indicate corresponding clusters in Fig. 3a. (b) The percentage (x-axis) of each macrophage/DC cluster (y-axis) out of total MNPs in each patient (n=7 human adult samples, n=9 human pediatric samples). Black and white squares represent male and female patient, respectively. Bars depict means with error bars representing standard deviation. Two-sided student’s t-test was applied and n.s. represents not significant.
Extended Data Figure 6.
Extended Data Figure 6.. Gating strategies for human and mouse macrophages and dendritic cells subpopulations.
(a) Gating strategy for the different human peritoneal macrophage and DC subsets in Fig. 4. (b) Gating strategy for the mouse counterparts of human peritoneal SCM, cDC1, cDC2 and pDC populations.
Extended Data Figure 7.
Extended Data Figure 7.. Unsupervised clustering of human peritoneal macrophages based on flow cytometry validates the key macrophage populations.
(a) Projection of manually gated CD14+ CCR2+ CM (blue), CD206+ LYVE1+ CCR2 CD62P CM (orange), CD62P+ CM (red), CD1c+ CD64+ MNPs (green), CD1c+ CD64 MNPs (pink) and cDC1 (purple) over UMAP displayed in Figure 4a. (b-c) Histograms representing TIMD4 and LYVE1 expression in CD14+ CCR2+ (blue), CD206+ CCR2 CD62P (Orange) and CCR2 CD62P+ (red) CM across all adult (b, n=7) or pediatric (c, n=6) samples.
Extended Data Figure 8.
Extended Data Figure 8.. Gating strategies and flow cytometry plots for the studies in mice to assess impact of environmental triggers on macrophage phenotype.
(a) Gating strategy used for identification of mouse LCM populations based on LYVE1 and CD206 expression. (b) Representative plots of Figure 5b showing expression of CD206 and LYVE1 by LCMs from control (Gata6fl/fl) and Csf1rERCre x Gata6fl/fl mice 16 days post-tamoxifen administration. (c) Body weight from female mice fed either normal chow diet (n=6) or high-fat diet (n=5) for 5 months to induce obesity. Data representative of two similar experiments. A Mann-Whitney test was used for statistical analysis (p=0.0087). ** represents p<0.01 and data are represented as mean value +/- SEM. (d) Isotype controls for CD206 and LYVE1, comparing to the expression of control or high-fat diet mice. (e) Gating strategy used for analysis of LCMs from wild-caught mice.
Figure 1.
Figure 1.. Human peritoneal immune cells and initial assessment of GATA6 and SELP expression in macrophages
(a) UMAP projection of mononuclear phagocytes (MNPs) from the peritoneal cavity of 7 adults (5 females, 2 males) forming 16 distinct clusters. Cluster names assigned based on inferred function or functional markers. (b) Feature plots showing the expression of general marker genes for myeloid cells and peritoneal macrophages. Color scale represents the normalized gene expression. (c) Confocal analysis of GATA6 and CD62P expression in human peritoneal CD14+ macrophages. Biological samples were analyzed over two independent experiments. Scale bar=10, 5 and 10 μm respectively. (d) Bar plot delineating the proportions of GATA6+ peritoneal macrophages, identified by either RNA (n=7 human samples) or protein expression assessed by immunofluorescence (IF) (n=3 human samples and n=4 mice). A one-way ANOVA and post-hoc comparisons using Tukey’s HSD were conducted to compare the means of the three groups. **** represents p<0.0001. (e) Pathway activity estimation of previously published converting macrophage and monocyte-like macrophage gene sets across MNPs in human peritoneal cavity. Color scale represents the scaled score calculated by GSVA. (f) RNA velocity analysis of macrophage clusters in all 7 adult patients, visualized on the pre-defined UMAP plot from Fig 1a. Arrows denote velocity vectors illustrating potential differentiation paths. (g) GSEA comparing LCM from Gata6 cKO mice to the gene signatures of the MRC1hi convMac or TIMD4hi LCM clusters from the human peritoneal macrophage dataset. Ticks below the line correspond to gene ranks. Statistical analysis was performed using a Kolmogorov–Smirnov test. Multiple testing correction was conducted automatically using the BH-FDR method. Normalized enrichment scores (NESs) and FDR q-values are shown for each cluster.
Figure 2.
Figure 2.. scRNA-seq defines relationship between mouse and human peritoneal cells
(a) UMAP projection of MNPs as in Fig. 1 and three C57BL/6J mouse datasets (GSM7053956, GSM7053957 and GSM7053958) (left) and UMAP plots showing the distinct MNP composition of mouse (middle) and human (left) peritoneal cavity. Cluster names assigned based on marker genes and clusters are color coded. (b) Feature plots depicting the expression of marker genes of interest on macrophages in mouse and human. Color scale represents the normalized gene expression. (c) Bar plot defining proportions of GATA6+ macrophages in the peritoneal cavity of human (n=7) and mouse (n=3) peritoneal cavity. Bars depict means with error bars representing standard deviation. Two-sided student’s t-test, **** p<0.0001 (p=1.91326E-09). (d) Proportion of MNP clusters in total MNPs for each sample including those expressing GATA6, MRC1hi convMacs, GLUL+ CM, TIMD4+ LCM, CCR2+ mono-LCM, CD1C+CD14+ cells, CD1C+CD14 cells, and cDC1 in human (n=7) and mice (n=3). Bars depict means with error bars representing standard deviation. Multiple two-tailed t-tests followed by false discovery rate (FDR) correction; *p<0.05, **p<0.01, ****p<0.0001, n.s. not significant. The exact p-values and FDR corrected q-values are reported as Source Data (e) Z-transformed mean mRNA expression intensity of the top 50 differentially expressed genes between the CD1C+CD14+ and CD1C+CD14 human cell clusters. (f) GSEA analysis for the enrichment of published SCM gene signatures when compared to CD1C+CD14 or CD1C1+CD14+ human cells. Ticks below the line correspond to gene ranks. Statistical analysis was performed using a Kolmogorov–Smirnov test. Multiple testing correction was conducted automatically using the BH-FDR method. Normalized enrichment scores (NESs) and FDR q-values are shown for each cluster.
Figure 3.
Figure 3.. Children have abundant peritoneal DC2 but not GATA6+ macrophages
(a) UMAP projection (left) of live CD45+ peritoneal wash cells from 7 adult and 9 pediatric donors showing 25 distinct color-coded clusters. Cluster names assigned based on marker genes. Separated UMAP visualization of immune cell clustering in adult (right, top) or pediatric (right, bottom) peritoneal wash samples as in a. (b) Feature plots showing the expression of marker genes in adult and pediatric human peritoneal cavity macrophages as in a. Color scale represents the normalized gene expression. (c) The frequency of each cluster, as defined in a, among total MNPs in each human adult (n=7) and pediatric (n=9) sample. GATA6+ cells are a subcluster and not depicted here. Bars depict means with error bars representing standard deviation. Multiple two-tailed t-tests followed by false discovery rate (FDR) correction; *p<0.05, **p<0.01, ***p<0.001, n.s. not significant. Both the exact p-values and FDR corrected q-values are reported in Source Data Fig.3. (d) The percentage of GATA6+ cells as determined from the frequency GATA6+ cells in the UMAP plots between adult (n=7) and pediatric (n=9) samples. Bars depict means with error bars representing standard deviation. Two-sided student’s t-test was applied and p=0.08 (e) GSEA analysis evaluating enrichment of a published SCM gene signature in CD1C+CD14+ or CD1C+CD14 human cells. Ticks below the line correspond to gene ranks. Statistical analysis was performed using a Kolmogorov–Smirnov test. Multiple testing correction was conducted automatically using the BH-FDR method. Normalized enrichment scores (NESs) and FDR q-values are shown for each cluster.
Figure 4.
Figure 4.. Flow cytometry of human peritoneal mononuclear phagocytes reveals few CD62P+ but many CD1c+ cells
(a) Unsupervised clustering based on multicolor flow cytometry of all MNPs from human adult (n=7) and pediatric (n=6) samples, projected on a UMAP space after cells from each patient were randomly down sampled to 10000 events to generate UMAP dimensional reduction and concatenated, and UMAP was generated after negative selection of gating out dead cells, CD45 cells, CD3+ T cells, CD56+ NK cells, CD19+ B cells and CD16+ SSChi neutrophils. Clusters are identified based on their unique surface markers. (b) UMAP plots of the negatively selected MNPs showing the expression of CD14, CD11b, CD11c, CD64, CCR2, HLA-DR, LYVE1, CD206, TIMD4, CD62P, CLEC9A, CD163, CD1C and CD226. (c) Frequency of CCR2+CD14+ CM, CD206+LYVE1+CCR2CD62P CM, CD62P+CCR2 CM, CD1c+CD14+CD64+ cells, CD1c+CD14CD64 cells, and cDC1 MNP subsets in adult (n=7) and pediatric (n=6) samples. Bars depict means with error bars representing standard deviation. Multiple two-tailed t-tests followed by false discovery rate (FDR) correction were applied; *p<0.05, **p<0.01, ****p<0.0001, n.s. not significant. Both the exact p-values and FDR corrected q-values are reported in Source Data Fig.4. (d) Frequency of ICAM2 CD11b+ CD115+ CD226+ SCMs, ICAM2 CD115 CD11c+ MHC-II+ XCR1+cDC1, ICAM2 CD115 CD11c+ MHC-II+ Sirpα+ cDC2 and ICAM2 CD115 CD11cint MHC-IIint Sirpα+ Ly6C+ pDC among mouse MNPs (n=12). Bars depict means with error bars representing standard error. A one-way ANOVA and post-hoc comparisons using Tukey’s HSD were conducted. *** represents p<0.001 and **** represents p<0.0001. (e) Expression of TIMD4, LYVE1, CD163, CD14 and CD226 across human MNP subsets as in Extended Data Fig. 7a.
Figure 5.
Figure 5.. Open environment, obesity or acute inflammation in mice do not produce a shift that mirrors the low abundance of Gata6+ cells seen in humans.
(a) Confocal microscopy examining GATA6 expression in peritoneal cells from Csf1rERCre+GATA6fl/fl and GATA6fl/fl mice 16 days post-tamoxifen administration. Scale bar = 20μm. (b) Kinetic of CD206+LYVE1+ LCM accumulation in Csf1rERCre+GATA6fl/fl (day 2, n=2; day 8, n=1 day 16, n=3) and GATA6fl/fl (day 2, n=2; day 8, n=2; day16, n=3) mice at the indicated days post-tamoxifen administration orally. Data representative of two independent experiments. (c) Quantification of LCMs in Csf1rERCre+GATA6fl/fl (n=8) and GATA6fl/fl (n=10) mice on day 16 post-tamoxifen administration. Biological samples were analyzed over two independent experiments. Two-sided Mann-Whitney (p=0.0003), *** p<0.001 (d) Representative flow cytometry plots (left) and quantification (right) of F4/80+ICAM2+ LCMs in Lyz2Cre/+GATA6fl/fl (n=6 mice per group) and Lyz2+/+GATA6fl/fl mice 3 h post-intraperitoneal injection of saline or 1 mg zymosan (saline, n=3; zymosan, n=4). Biological samples were analyzed in two independent experiments. Two-way ANOVA test, *** p<0.001, **** p<0.0001 (e) Representative flow cytometry plots (top) and quantification (bottom) of total LCM (p=0.9307) and LYVE1+CD206+ LCMs (p=0.0043) in female C57BL/6 wild-type mice fed either chow diet (n=6) or high-fat diet (n=5) for 5 months to induce severe obesity. Mice were 8 week-old at the onset of high fat diet. Data representative of two similar experiments. Two-sided Mann-Whitney tests, ** p<0.01, n.s. not significant (f) Representative flow cytometry plots (left) and frequency (right) of F4/80hiCD206low LCMs and F4/80intCD206+ converting CM in wild mice (n=165). H-014 and H-019, identifier codes assigned to two wild mice with different macrophage profiles. Two-sided Mann-Whitney test; **** p<0.0001. (g) Correlation between proportions of converting CM, Trichuris burden and maturity index in wild mice using spearman’s rank-order correlation. In all bar graphs, each dot represents a single sample (n=165 wild mice) and error band represents 95% confidence interval.

References

    1. Gautier EL et al. Gene-expression profiles and transcriptional regulatory pathways that underlie the identity and diversity of mouse tissue macrophages. Nat Immunol 13, 1118–1128 (2012). - PMC - PubMed
    1. Jenkins SJ et al. Local macrophage proliferation, rather than recruitment from the blood, is a signature of TH2 inflammation. Science 332, 1284–1288 (2011). - PMC - PubMed
    1. Zhang N et al. Expression of factor V by resident macrophages boosts host defense in the peritoneal cavity. J Exp Med 216, 1291–1300 (2019). - PMC - PubMed
    1. Chow A et al. Tim-4(+) cavity-resident macrophages impair anti-tumor CD8(+) T cell immunity. Cancer Cell 39, 973–988 e979 (2021). - PMC - PubMed
    1. Jin H et al. Genetic fate-mapping reveals surface accumulation but not deep organ invasion of pleural and peritoneal cavity macrophages following injury. Nat Commun 12, 2863 (2021). - PMC - PubMed

Methods-only REFERENCES

    1. Elpek KG et al. The tumor microenvironment shapes lineage, transcriptional, and functional diversity of infiltrating myeloid cells. Cancer Immunol Res 2, 655–667 (2014). - PMC - PubMed
    1. Bolstad BM, Irizarry RA, Astrand M & Speed TP A comparison of normalization methods for high density oligonucleotide array data based on variance and bias. Bioinformatics 19, 185–193 (2003). - PubMed
    1. Leek JT, Johnson WE, Parker HS, Jaffe AE & Storey JD The sva package for removing batch effects and other unwanted variation in high-throughput experiments. Bioinformatics 28, 882–883 (2012). - PMC - PubMed
    1. Liberzon A et al. The Molecular Signatures Database (MSigDB) hallmark gene set collection. Cell Syst 1, 417–425 (2015). - PMC - PubMed
    1. Subramanian A et al. Gene set enrichment analysis: a knowledge-based approach for interpreting genome-wide expression profiles. Proc Natl Acad Sci U S A 102, 15545–15550 (2005). - PMC - PubMed