. 2023 Dec 15;23(1):458.
doi: 10.1186/s12906-023-04280-6.

Integrated bioinformatics and network pharmacology to explore the therapeutic target and molecular mechanisms of Bailing capsule on polycystic ovary syndrome

Affiliations

Integrated bioinformatics and network pharmacology to explore the therapeutic target and molecular mechanisms of Bailing capsule on polycystic ovary syndrome

Hao-Ru Guan et al. BMC Complement Med Ther. .

Abstract

Background: Polycystic ovary syndrome (PCOS) is a complex endocrine and metabolic disorder that is common in women of reproductive age. The clinical features of PCOS include hyperandrogenemia and polycystic ovarian changes. Bailing capsule (BL), a proprietary Chinese medicine that contains fermented Cordyceps sinensis powder, has been applied to treat PCOS. However, the specific active ingredients of BL and its mechanisms of action are yet to be elucidated.

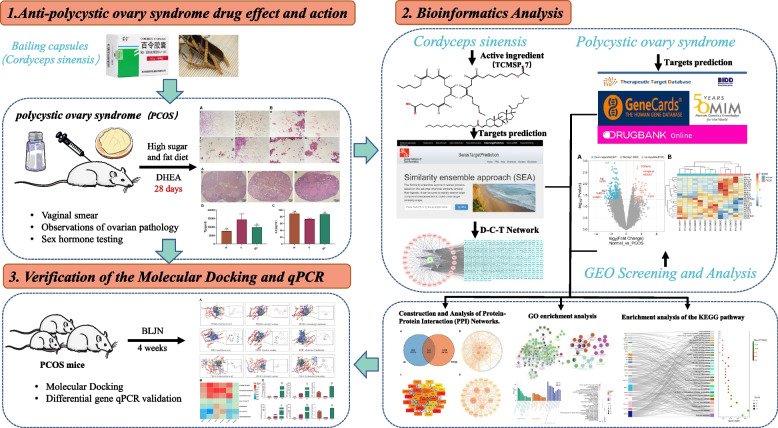
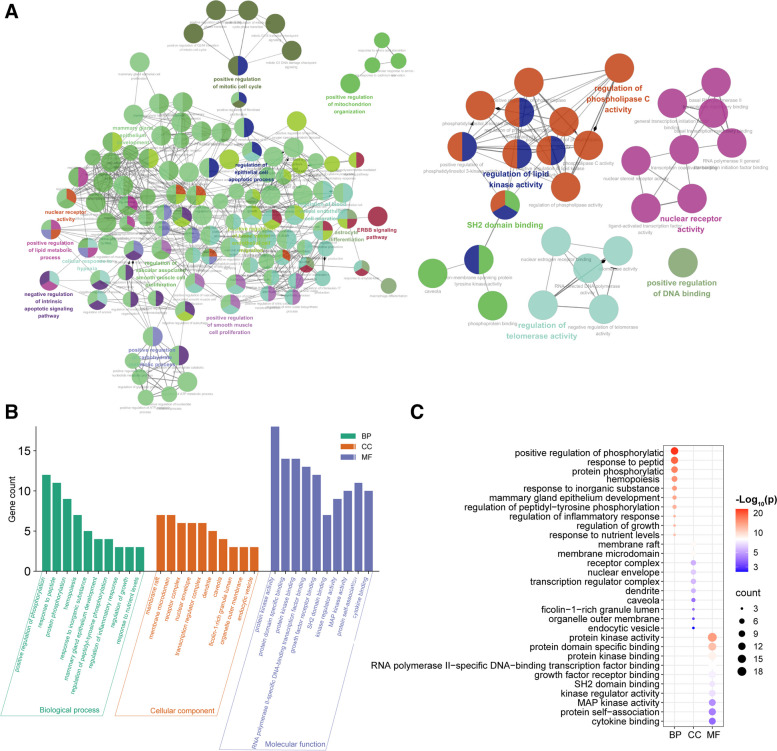
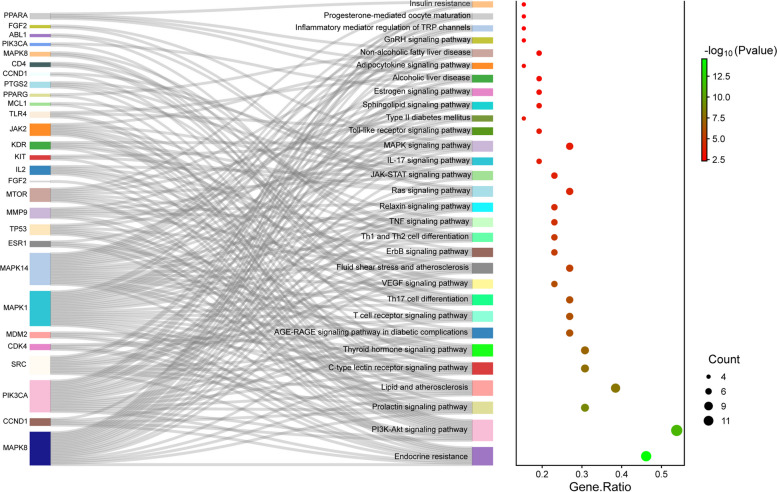
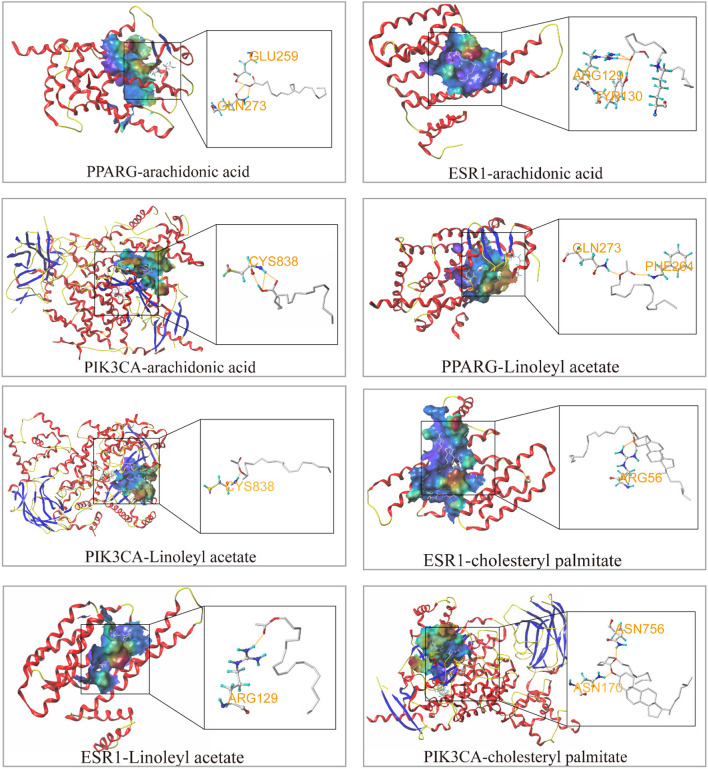
Methods: Initially, the effectiveness of BL on PCOS model mice was evaluated. Subsequently, the active ingredients of BL were searched in the TCMSP and TCM Systems Pharmacology databases, and their targets were predicted using Swiss Target Prediction and SEA databases. Furthermore, the GEO gene database was used to screen for differentially expressed genes (DEGs) related to PCOS. Data from Gene Card, OMIM, DDT, and Drugbank databases were then combined to establish a PCOS disease gene library. Cross targets were imported into the STRING database to construct a protein-protein interaction network. In addition, GO and KEGG pathway enrichment analyses were performed using Metascape and DAVID databases and visualized using Cytoscape software and R 4.2.3. The core targets were docked with SYBYL-X software, and their expressions in PCOS mice were further verified using qPCR.

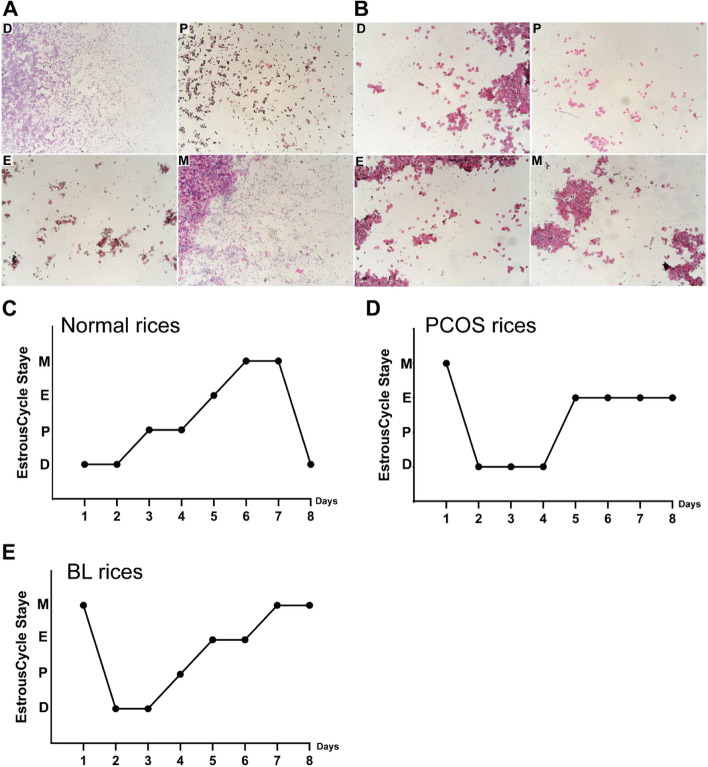
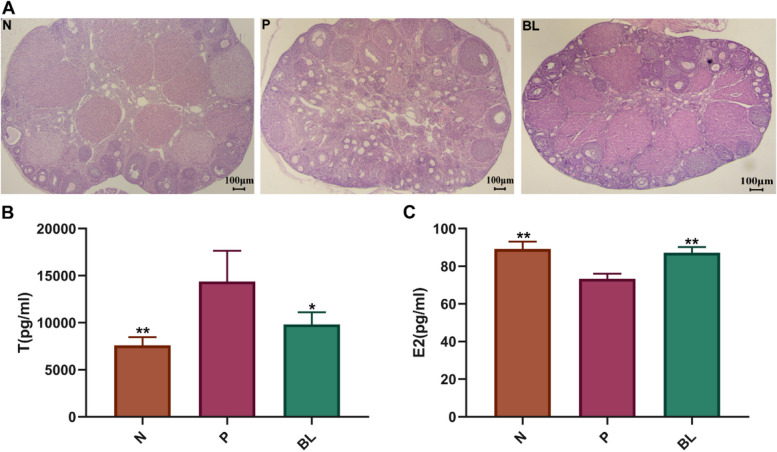
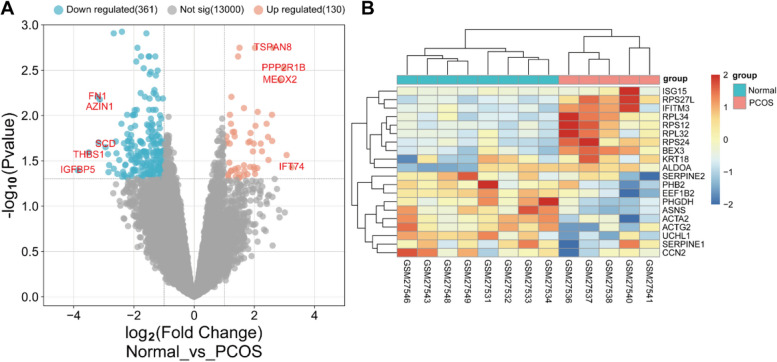
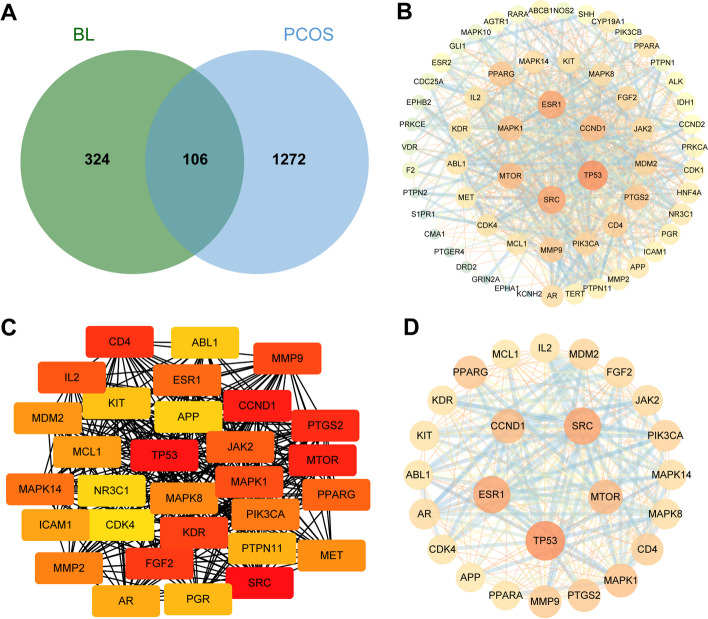
Results: The core active ingredients of BL were identified to be linoleyl acetate, cholesteryl palmitate, arachidonic acid, among others. Microarray data sets from four groups containing disease and normal samples were obtained from the GEO database. A total of 491 DEGs and 106 drug-disease cross genes were selected. Estrous cycle and ovarian lesions were found to be improved in PCOS model mice following BL treatment. While the levels of testosterone, progesterone, and prolactin decreased, that of estradiol increased. qPCR findings indicated that the expressions of JAK2, PPARG, PI3K, and AKT1 were upregulated, whereas those of ESR1 and IRS1 were downregulated in PCOS model mice. After the administration of BL, the expressions of associated genes were regulated. This study demonstrated that BL exerted anti-PCOS effects via PIK3CA, ESR1, AKT, PPARG, and IRS1 targets affecting PI3K-Akt signaling pathways.

Discussion: This research clarified the multicomponent, multitarget, and multichannel action of BL and provided a theoretical reference for further investigations on its pharmacological basis and molecular mechanisms against PCOS.

Keywords: Bailing capsule; Bioinformatics; Gene expression; Microarray; Network pharmacology; Polycystic ovary syndrome.


Conflict of interest statement

The authors declare no competing interests.

Figures

Fig. 1
Fig. 1
Experimental flowchart
Fig. 2
Fig. 2
Changes in the estrous cycle of mice. A The four stages of the estrous cycle in normal mice; B The four stages of the estrous cycle in PCOS mice; C-E Changes in the estrous cycle of mice in the normal group, model group, Bailing capsule group. P: Proestrus, E: Estrus, M: Metestrus, D: Diestrus
Fig. 3
Fig. 3
Effect of supplementation with Bailing capsule on ovarian dysfunction and serum sex hormone levels in DHEA-induced PCOS-like rats. Serum hormonal levels were using enzyme linked immunosorbent assay (ELISA). A Section of the ovary from each experimental group (H&E, scale bar = 100 µm). B Testosterone(T), C Estradiol(E2). All values represent means ± SD, n = 4 per group. *p < 0.05, **p < 0.01 vs PCOS. N: normal group N: normal group; P: PCOS group; BL: Bailing capsule group
Fig. 4
Fig. 4
D-C-T network. The green hexagon is the drug; the purple V-shape is the active ingredient; the circle is the target with degree > 2, indicating more than two active ingredients acting on this target; the rectangle is the target with degree = 1
Fig. 5
Fig. 5
Heat map and volcano map of differential genes of Normal and PCOS patients with GSE1615 chip. A Volcano map. The X-axis was log2 (fold change). The Y-axis was -log10 (Pvalue). B We selected the top 20 differentially expressed genes for the heat map (blue is a low expression, yellow is a medium expression, and red is a high expression). All genes were first set as undifferentiated genes (denoted in Grey) and screened according to the logFC and adjusted p-value. When the adjusted p-value was < 0.05 and the logFC ≥ 1, it was noted as an upregulated gene (shown in red); when the adjusted p-value was < 0.05 and the logFC ≤ -1, it was noted as a downregulated gene (shown in blue)
Fig. 6
Fig. 6
Construction and analysis of protein-protein interaction (PPI) networks. A Venn diagram of shared targets of BL and PCOS. Blue circles represent BL targets, orange circles represent disease targets. B PPI network from database. The circle represents the target point, the larger the radius of the circle, the darker the fill color means the larger the target point degree, the darker and thicker the line between the target points means the larger the combine score. C MCC algorithm. The darker the color, the higher the value of the target. D Degree algorithm. The darker the color, the higher the value of the target
Fig. 7
Fig. 7
GO enrichment analysis. A GO enrichment networks. B Go enrichment bar plot. Different colors indicate different types of enrichment, and the higher the bar indicates the higher the number of genes in that enrichment term. C Go enrichment dotplot. The size of the bubbles indicates the number of gene enrichment, and the darker the red color indicates the larger the p-value
Fig. 8
Fig. 8
Enrichment analysis of the KEGG pathway. On the left is a Sankey plot, reflecting the enrichment of genes with respect to the pathway. On the right is the bubble plot, the size of the dots indicates the number of genes in the pathway, the X coordinate indicates the Gene Ratio, and the color represents the pathway enrichment-log10 (Pvalue), with red indicating a larger value and green indicating a smaller value
Fig. 9
Fig. 9
Molecular docking. Visualization of partial molecular docking results. The yellow dashed line represents the polar connection of the active ingredient to the target, the small molecule in gray is the active ingredient, and the amino acid residues connected to the small molecule are represented by the rod model
Fig. 10
Fig. 10
qPCR validation. A Total score heat map. The darker the red color, the higher the docking score of the component and the target. B Real time fluorescence quantitative PCR detection of the relative expression level of PCOS gene mRNA. All values represent means ± SD, n = 4 per group. *p < 0.05, **p < 0.01 vs PCOS

References

    1. Escobar-Morreale HF. Polycystic ovary syndrome: definition, aetiology, diagnosis and treatment. Nat Rev Endocrinol. 2018;14(5):270–284. doi: 10.1038/nrendo.2018.24. - DOI - PubMed
    1. Walter K. What is polycystic ovary syndrome? JAMA. 2022;327(3):294. doi: 10.1001/jama.2021.19776. - DOI - PubMed
    1. Cooney LG, Dokras A. Beyond fertility: polycystic ovary syndrome and long-term health. Fertil Steril. 2018;110(5):794–809. doi: 10.1016/j.fertnstert.2018.08.021. - DOI - PubMed
    1. Patel S. Polycystic ovary syndrome (PCOS), an inflammatory, systemic, lifestyle endocrinopathy. J Steroid Biochem Mol Biol. 2018;182:27–36. doi: 10.1016/j.jsbmb.2018.04.008. - DOI - PubMed
    1. Huddleston HG, Dokras A. Diagnosis and treatment of polycystic ovary syndrome. JAMA. 2022;327(3):274–275. doi: 10.1001/jama.2021.23769. - DOI - PubMed